Loving this thread. I read it when I first started forex and it was a little over my head. Just rediscovered it a few days ago. Anyway, here’s a trade opportunity I just saw.
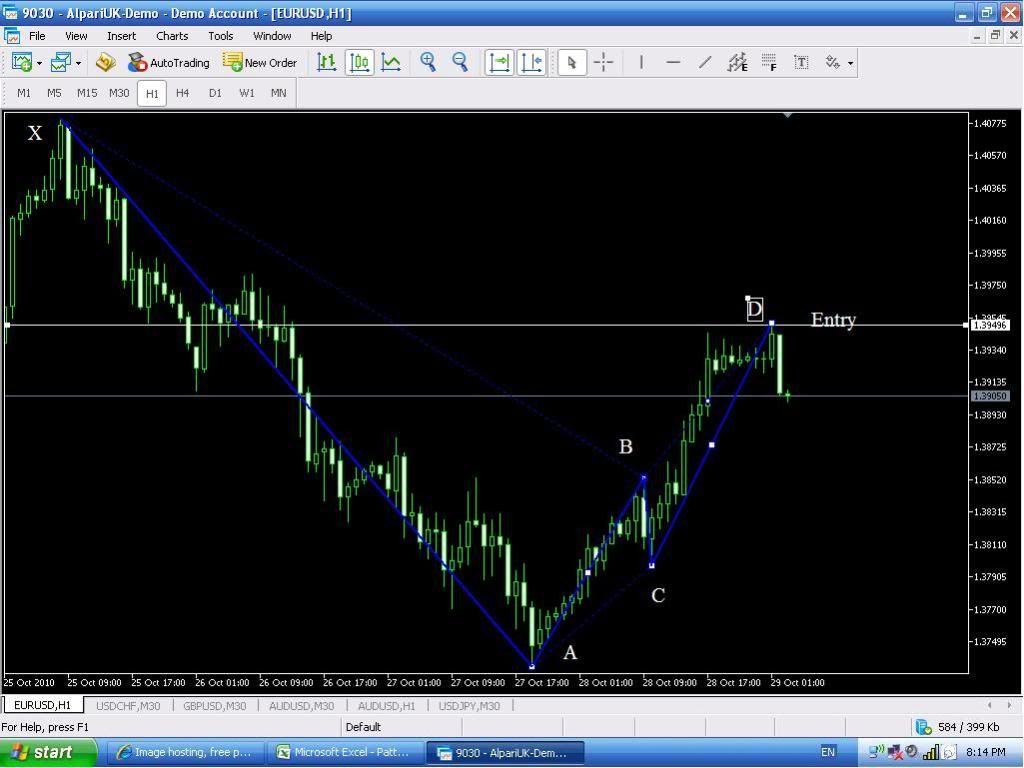
Very nice convergence forming on EURUSD H1 at 1.3948. It occurs at the 61.8% level of XA, the 127% of CD and the 261.8 level of BC. Time is not very symmetrical (BC is less than 15% and price action looks like it may come close to 61.8% of the time for AB) but otherwise looks like a solid trade to me. Current candle forming appears to found resistance at the 1.0 level of AB but, if not, it could turn into a solid 30 pips. (Image attached)
I haven’t done a great deal of pattern trading. I’m more of a indicator guy, so if I’m off on my chart please let me know. GL!
Man wasnt that a beauty? on the weird AUD/USD patern price hit 0,500 of AD and went down like a rock…Inspira i hope u drained every last pip out of this move…cheers!
Hi Grandmaster Pip, welcome.
Lol, I love your name, very cool!
Excellent analysis, I don’t think you’re “off your chart” at all lol!
Not many people mention the symmetry and especially the time aspect of these patterns but you do! And I consider that a critical component as well. There’s great convergence, that’s unmistakable, but as you say the symmetry is not ideal on this one.
And that, for me, would be a very big red flag… that’s not to say it won’t move xx number of pips. But I would much prefer a pattern with roughly equal number of bars for each swing point - in this case the BC swing is only made up of 2 bars compared to the rest of the swings, and I’d say it was significantly less than 15% in comparison.
Normally I can spot these patterns quite easily before ‘fibbing’ them and if I were to look at this area on a naked chart, nothing really sticks out at me. In short, I wouldn’t have considered this a valid harmonic pattern and so wouldn’t have traded it.
However, I’ve found this method to be quite robust and readily adaptable to ones own style and preference. And with a little experience, the pips will surely come to play.
Hope this makes sense and isn’t too discouraging. Your analysis is very thorough regardless,
inspira
hi Inspira
i had some time to look at both mine and yours patterns on USD/JPY
and i just wanted to explain how i make my mind around the chart…i hope it will help and please comment…
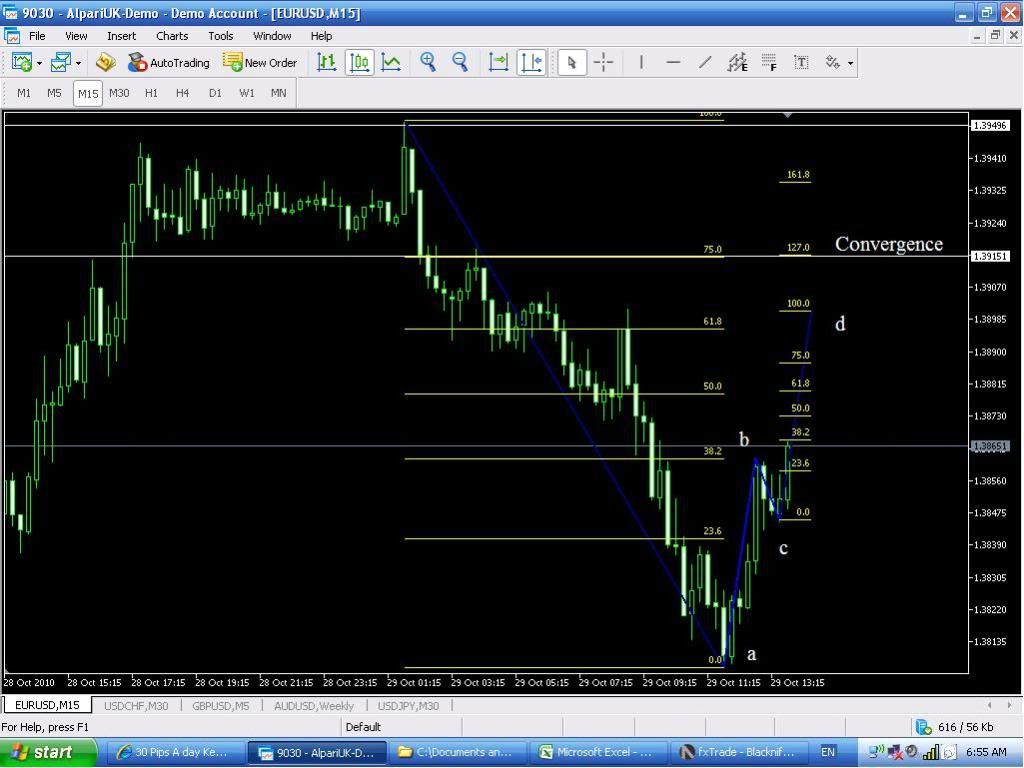
both patterns have same abc but different x point…i use the rule TMB uses to choose extreme in price for x point …thats why choose the other x point and i wouldnt enter the 15 min pattern because the convergence lvl is too wide /around 8 pips/ …the 1h pattern with more extreme x and same abc points have convergence of 2 pips and different d point …for me this is 1H pattern and its not completed yet
again… its nice to see other people think and comment over this trading method…this is how we learn it…
cheers to all
First post in this thread, been following it for a while now. I just saw a pattern forming on the 4H EUR/USD and wanted to know I’m on the right track. I havent looked at the charts you guys have uploaded lately.
The ABCD of the pattern seems to be very atypical. First, the AB leg didn’t come to a fib level of XA. Same is true of the BC leg. It didn’t find resistance on the fib levels of the AB leg. Having a large retracement on the BC leg doesn’t invalidate the pattern, but it could suggest a possible pattern failure. Time may end up being more symmetrical when D develops but atm it doesn’t look too good.
Knowing all of that, the bearish pattern completing on the weekly and hourly chart, and the current fundamental data (some solid numbers coming back on the US and possible trouble for the EU) I don’t plan on trading it. That being said, a tight stop and 30 pip take profit level may garner you some pips.
I decided to go ahead with the pattern but I kept a very short stop. As you can see the trade worked out very well. The order triggered 2 pips from the top. Closed at a 36 pip profit :D.
Probably wouldn’t have traded this one but I didn’t catch a deal this morning because of other obligations.
Yep, some excellent discussion… that’s what’s it all about. We have a nice trading tribe here amongst other places.
No prob’s re: explaining. Like I said before, this method is quite accomodating to everyone.
I’ve just had a look at your pattern, and it does look perfect - the convergence is extremely tight as you say, and even the 300BC falls right alongside the other 2 fibs.
The convergence on mine is a little bigger though I don’t mind so much - I always consider the PRZ a ‘zone’ or small band as the name suggests so it’s not a big deal. That said, you could argue taking the PRZ just from the 1618XA to 2618BC and it would be ~30% smaller. But again… just semantics.
What is more important, above all else is Risk Reward Ratio (RRR). This will always be the deciding factor for me.
Also, just so everyone knows, I typically use Carney’s method as my foundation. Thus, X will not always be at the extremes as TMB’s charts are.
Happy trading all,
inspira
PS. [B]Trade updates:[/B]
USDJPY m30 out at be/e. But now extended into an almost perfect crab, so I’m long again!!
Gold, still short, consolidating @ 236 AD and S/R
** Also note some of the Yen crosses have now formed butterflies with the Yen strength in the early Asian Session this morning.
You’ve done your homework - your bearish butterfly EURUSD 4h looks perfectly identical to Carney’s.
The only obvious thing is it could take while to setup…
I’m bearish EURUSD at the moment long term - there’s a macro pattern on the larger timeframes, also an AB=CD pattern.
Dbear0398,
I pretty much have the same opinion as per my post to Grandmaster Pip, so please refer to that one.
Thanks for the input, and I like your favorite saying about being out of the market wishing you were in; I should post it on top of my monitor in big red letters
Good quote! (The chiasmus makes for nice symmetry, lol) I should remember that when I’m in the mood to “gamble.” Thanks for the advice on the symmetry of it as well. It kept me from taking the trade with too big of a SL.
If your looking for an opportunity to short EURUSD this may be it. Good looking Gartley forming on the 15m EUR USD. Time symmetry looks good and there is a solid convergence at the 75% XA and 127% CD point.
hi all… last one for this week…i took a small loss earlier on this pattern but made it back fast …one mistake i made… .i entered a bit late and it cost me around 10 pips and it made me nervous because i had to put wider SL…
ALLWAYS set you price alarms!
happy weekend to all …
By radofx at 2010-10-29
here is something from Jesse Livermore himself
‘All through time, people have basically acted and reacted the same way in the market as a result of: greed, fear, ignorance, and hope. That is why the numerical formations and patterns recur on a constant basis.’
’
‘The game of speculation is the most uniformly fascinating game in the world. But it is not a game for the stupid, the mentally lazy, the person of inferior emotional balance, or the get-rich-quick adventurer. They will die poor.’
I agree, gotta give it some time. I’ve been watching that AB=CD form on the daily for a while now. I’m in bearish pattern mode and as I see there’s been some great profitable patterns lately. Thanks for your help. Keep up the great finds guys!