Daily Technical Analysis by FxGrow

FxGrow Fundamental Analysis – 05th April, 2017
By FxGrow Investment Research Desk

EUR/USD Steadies Ahead of local Data, Eyes on FOMC Meeting

Last week, EUR/USD witnessed an intensive decline and the pair plunged to 1.0649 on Friday after peeking to 1.0906 last Monday. This week, the pair was confined with 50-pips as price action and prolonged the third consolidation consecutive session with a weekly high at 1.0685. Although U.S Dollar has awakened with a 100.59 high yesterday, market is showing some immunity by other currency rivals due to overall political uncertainties and economies are shifting courses at a high pace, add to that, mixed data leaving markets confused and cautious trading.

According to the analysts at Danske Bank, if we are close to a peak in inflation and they are right that the pricing of hikes in the Eurozone will prove premature, EUR/USD should stay under pressure in coming months and fall back towards 1.05 as close-to-neutral positioning in the cross makes room for a revival in relative rates. Eurozone still has many obstacles to overcome before the whole image is drawn, especially the French coming elections and Frexit is already on tongues.

This week, currency majors traded narrow as analysts awaits FOMC meeting minutes today and U.S NFP this Friday which should create higher volatility despite a negative or positive outcome especially EUR/USD. Local EURO services PMI is expected to have minor volatility. The main focus will be on tonight’s FOMC meeting with eyes and ears focused on every word, trying to decipher messages, and the process of pricing the market could start all over again and FOMC members will do their best of avoid this scenario.

Fundamentals:

1- EUR - Final Services PMI today at 7:00 AM GMT.

2- USD - FOMC Meeting Minutes today at 6:00 PM GMT.

3- USD - Non-Farm Payrolls on Friday at 12:30 PM GMT.

Remark : U.S Data is heavy this week, but market poised and tied with FOMC meeting and NFP result, which leaves other data less significant.

Technical Overview:

Trend: Bearish / Sideways

Resistance levels : R1 1.0712, R2 1.0771, R3 1.0826, R4 1.0877

Support levels : S1 1.0632, S2 1.0589, S3 1.0532, S4 1.0478

Summary: Overall, the pair remains under pressure by strong U.S Index and market to consider EUR/USD bearish. But economic data this week will determine the trend further more. A penetration for S1 level will increase further selloffs and wash towards S2. A break below S2 level warns for additional intensive declines towards S3&S4. Any close below 1.07 is negative. Rallies that stay capped by 1.0800 should maintain bear forces. Closing above R3 level, traders to take it as sign for shifting trend course and above R4, uptrend is 100% confirmed. Be careful from setbacks as a first test on S&R levels due to high volatility.

For more in depth Research & Analysis please visit FxGrow.

Note: This analysis is intended to provide general information and does not constitute the provision of INVESTMENT ADVICE. Investors should, before acting on this information, consider the appropriateness of this information having regard to their personal objectives, financial situation or needs. We recommend investors obtain investment advice specific to their situation before making any financial investment decision.

FxGrow Fundamental Analysis – 05th April, 2017
By FxGrow Investment Research Desk

Crude Oil Surges Over Fears Of Supply Tightening, Eyes on U.S Inventories

Fundamentals:

Crude oil level rallied yesterday +$1.41, and added +$0.14 today clocking a high 51.47, with expectation of additional gains, ahead of U.S Crude Inventories today. Oil bullish forces accelerated yesterday over signs of a gradual tightening in global oil inventories and on concerns about a supply outage at a field in the United Kingdom’s North Sea that feeds into an international benchmark price.

Another contributor (Iraq), entered the field on Sunday pledging to a full compliance with oil cut deal as OPEC chief hinted. Iraq has assured OPEC that it will fully comply with an agreement to cut oil supply in order to curb crude prices and the deal as a whole is encouraging, OPEC Secretary General Mohammed Barkindo said on Sunday in Baghdad. Iraq’s compliance stands now at 98 percent, the nation’s oil minister Jabar al-Luaibi told reporters, after addressing a conference in the Iraqi capital, also attended by Barkindo. General compliance with supply cuts by the oil producers was 86 percent in January and 94 percent in February and the market is already balancing, he added.

On the other hand, the OPEC amd Non-OPEC deal for additional six months extension is cooked on a low steam and under the table which leaked optimism to the market as traders are anticipating it. Such deal, if struck, could accelerate rising price pace of crude oil despite U.S increased Shale drilling.

Conclusion: Currently OPEC with above fundamentals have the upper hand, and markets should expect oil prices to climb back to Feb 2017 average $53 bp.

Note: Look forward for U.S crude inventories today at 2:30 PM GMT which will give new perspectives for oil levels depending on the outcome.

Technical Overview:

Resistance levels: R1 51.65, R2 52.60, R3 53.52

Support levels : S1 50.86, S2 49.60, S3 48.41

Comment: The market has turned short-term bullish and calls for a larger bull wave up around R2&R3 levels. Stable action above 51.0 sustains bullish forces and boosts additional hikes. A slip below S1 cautions for near term correction, but only a close below S2 alerts for a trend reversal action and below S3, down-trend is confirmed. R1 level is sensitive as a psychological reminder of 2017 early rallies.

For more in depth Research & Analysis please visit FxGrow.

Note: This analysis is intended to provide general information and does not constitute the provision of INVESTMENT ADVICE. Investors should, before acting on this information, consider the appropriateness of this information having regard to their personal objectives, financial situation or needs. We recommend investors obtain investment advice specific to their situation before making any financial investment decision.

FxGrow Fundamental Analysis – 06th April, 2017
By FxGrow Investment Research Desk

Silver Technical Overview Ahead of U.S Data

Silver technical overview

Trend : Bullish

Resistance levels: R1 18.40 , R2 18.50, R3 18.73

Support levels: S1 18.19, S2 18.03, S3 17.74

Comment : The market is staying bullish with yesterday’s bounce calling for another push higher. However, trade is pressed up against the previous downturn levels at R1&R2. A close over 18.55 is needed for a larger bull drive to R3 level. Be careful for a stall a stall against R1 and possible back off into flagging congestion. A slip through S2 level cautions for near term selling. A close under S3 is a signal for short term reversing turnover. Keep an eye on U.S Data today and tomorrow which will impact silver levels instantly. Be careful from setbacks as a first test on S&R due to high volatility. Only long positions above or below S&R is a confirmation for levels failure.

For more in depth Research & Analysis please visit FxGrow.

Note: This analysis is intended to provide general information and does not constitute the provision of INVESTMENT ADVICE. Investors should, before acting on this information, consider the appropriateness of this information having regard to their personal objectives, financial situation or needs. We recommend investors obtain investment advice specific to their situation before making any financial investment decision.

FxGrow Fundamental Analysis – 06th April, 2017
By FxGrow Investment Research Desk

Gold Bull Forces Remain Under Pressure, U.S Data Will Decide

Gold has postponed breaking the 1260 level for the third consecutive session and for the 8th time in 2017, XAUUSD has built a higher wall being impossible to penetrate. Yesterday, the yellow metal plunged to 1243.75 dramatically over ADP Non-Farm Employment Change with an upbeat 263K while forecasts were 184K. Markets awaited FOMC meeting yesterday with expectations about a precise or clear figure about coming hikes with date, but details were left unspoken, as a result, market reacted negatively and U.S Index shed -$0.69 after peeking to 100.95 earlier. Currently gold trades 1245.30 intraday, with agitated volatility.

The same scenario has been repeated where gold reaches the climax of 1259, then fades aggressively as if the market is on an autopilot mood or Déjà vu. Today and tomorrow, U.S Data will decide once and for all, gold’s destination. A break above 1261 will fuel gold bullish candles with fury, whilst, a failure to break above, market could witness pressured selling and gold will plunge below 1245 as a reminder of recent scenarios.

On the other hand, other keys could provoke gold inclines including Trump’s political continuous tension with China and doubts about his leadership, North Korea declarations of launching nuclear missile as a test arousing uncertainties, French coming elections with Frexist as what happened on Brexit, markets might head to gold a safe haven substitute when doubts creap into the market.

Fundamentals:

1- USD - Unemployment Claims today at 12:30 PM GMT.

2- USD - Non-Farm Payrolls NFP tomorrow at 12:30 PM GMT.

Technical Overview:

Trend : Bullish Sideways

Resistance levels: R1 1260.05, R2 1267.40, R3 1280.30

Support levels: S1 1249.80, S2 1242.26, S3 1236.75

Comment: Gold levels will be determined depending on U.S Data outcome. As for technical, staying above 1250 rekindles bull forces. A break above R1 with long positions should fuel larger bull hikes towards R2&R3 level. Yesterday’s spike rebound has trade positioned for rallies as a restore of confidence. Any penetration for S1 level holds congestion with a reminder of aggressive selloffs towards S2 level. Closing below S2 is a signal for trend reversal and market to consider gold bearish. Expectations of high volatility during economic data release and traders to be careful from setbacks as recent behavior when gold tests support and resistance levels.

For more in depth Research & Analysis please visit FxGrow.

Note: This analysis is intended to provide general information and does not constitute the provision of INVESTMENT ADVICE. Investors should, before acting on this information, consider the appropriateness of this information having regard to their personal objectives, financial situation or needs. We recommend investors obtain investment advice specific to their situation before making any financial investment decision.

FxGrow Fundamental Analysis – 07th April, 2017
By FxGrow Investment Research Desk

Gold Rockets With Fury Over Trump’s Attack Decision

Gold inaugurated early trading at 1255.45 low and clocked a 1269.28 Dec-2016-Fresh highs with +$18.83 price action. Yesterday, Trump hinted that U.S military forces are considering the option of a possible attack on Syrian lands, but no one took his words seriously. Trump had to prove everyone wrong, and the prohibited occured, an attack on Al-Shayrat airfield on Syrian Territories with Tomhauk missiles, but this is not the end of the story.

There are confirmed details that Russian military forces were at Al-Shayrat airfield base which should create further tension between U.S and Russia, and the biggest beneficiary was gold where markets and traders will consider XAUUSD as a safe haven alternative.

This is not the end of gold bullish ride, and tails will extend further political tension supporting gold bullish forces. The first resistance failed at 1260, the second was tested successfully at 1267 with a minor correction, currently the yellow metal is trading 1263 intraday. Expectations that gold will dilate and extend further gains during the coming hours even though U.S Index is strong 100.68 high today. Gold tends to tweet comfortably despite U.S Dollar performance when economic and political uncertainties creeps into market. Gold next destination is 1275>1280 in case R2 level 1267 fails.

Remark: Although markets are awaiting U.S NFP data today at 12:30 PM GMT, NFP could have a minor affect on gold due to the above political fundamentals.

For more in depth Research & Analysis please visit FxGrow.

Note: This analysis is intended to provide general information and does not constitute the provision of INVESTMENT ADVICE. Investors should, before acting on this information, consider the appropriateness of this information having regard to their personal objectives, financial situation or needs. We recommend investors obtain investment advice specific to their situation before making any financial investment decision.

FxGrow Fundamental Analysis – 11th April, 2017
By FxGrow Investment Research Desk

GBP/USD Bullish Momentum Re-Tests Ahead of Local Data

Sterling showed a significant recovery on Monday with +63-pips price action. Today, GBP/USD was modest with +4 pips profit and the pair clocked 1.2432 high, then retreated 1.4221, at which the pair is currently trading intraday. GBP/USD still under pressure by recent strong U.S Dollar performance as the U.S Index clocked 101.24 April-2017-fresh-highs, although the index currently trades 100.93, is still a threat for the Sterling and promises for further declines for GBP/USD.

Mrs. Yellen, head of U.S Fed crossed wires yesterday with the following headlines and the coming hours will decide how the market will digest Yellen’s speech as traders awaited more positive hints for coming U.S Fed hikes.

“I think we have a healthy economy now”

“Whereas before we had our foot pressed down on the gas pedal trying to give the economy all the oomph we possibly could, now allowing the economy to kind of coast and remain on an even keel – to give it some gas but not so much that we are pressing down hard on the accelerator – that’s a better stance of monetary policy,” she said. “We want to be ahead of the curve and not behind it.”

Today, UK Data pocket is heavily loaded with Consumer Price Index CPI, Producer Price Index PPI, and Retail Price Index with CPI in focus. The UK CPI is expected to be weaker at 2.2% y/y in March versus a 2.3% reading booked last. On monthly basis, the consumer prices in the UK are expected to arrive at 0.3% versus 0.7% on previous sessions. GBP/USD low volatility is justified by markets being poised for economic data arrival today, but there will volatility after releasing data which will be eyed by BOE correlated with Inflation and coming interest rate decision.

Fundamentals:

1- GBP - CPI + PPI + RPI today at 8:30 AM GMT.

2- GBP - BOE Gov Carney Speech tomorrow at 8:00 AM GMT.

3- GBP - Average Earnings Index 3m/y tomorrow at 8:30 AM GMT.

Technical:

Trend: Bearish Sideways

Resistance levels : R1 1.2444, R2 1.2494, R2 1.2545, R4 1.2618

Support levels : S1 1.2375, S2 1.2321, S3 1.2267, S4 1.2195

Remark : UK Data today is crucial for GBP/USD trend coming hours with expectation of high volatility shortly after release. Although cable trend is currently bearish sideways, the data outcome could re-set GBP/USD Trend. U.S Index levels to be taken highly into consideration.

For more in depth Research & Analysis please visit FxGrow.

Note: This analysis is intended to provide general information and does not constitute the provision of INVESTMENT ADVICE. Investors should, before acting on this information, consider the appropriateness of this information having regard to their personal objectives, financial situation or needs. We recommend investors obtain investment advice specific to their situation before making any financial investment decision.

FxGrow Fundamental Analysis – 11th April, 2017
By FxGrow Investment Research Desk

EUR/USD Remains Under Pressure by Stronger U.S Dollar

EUR/USD extended the bearish trend for the 12th consecutive session and has been confined with 37-pips price action since yesterday. The pair clocked a 1.0620 high today and remains under pressure by recovering US Dollar as the Index peeked to 101.24 high yesterday. Today U.S Index retreated to 100.73 low, showing signs of weakness following Yellen speech yesterday as the market still not digesting the outcome. Yellen and Co. abandoned the support for U.S Dollar, and left the Index to trade based on U.S upcoming economic events, stressing that U.S economy is doing well overall.

Technical :

Trend : Bearish Sideways

Resistance levels: R1 1.0622, R2 1.0653, R3 1.0705

Support levels: S1 1.0570, S2 1.0537, S3 1.0486

Remark : The market is bearish and Friday’s drop out from sideways congestion around 1.07+/- alerts for fro another aggressive selling wave to reach S2. Any corrective congestion trapped within the lower half of Friday’s range will stay aligned for selloffs. A close above R3 level is needed to spark bullish forces and trend reversal.

For more in depth Research & Analysis please visit FxGrow.

Note: This analysis is intended to provide general information and does not constitute the provision of INVESTMENT ADVICE. Investors should, before acting on this information, consider the appropriateness of this information having regard to their personal objectives, financial situation or needs. We recommend investors obtain investment advice specific to their situation before making any financial investment decision.

FxGrow Fundamental Analysis – 12th April, 2017
By FxGrow Investment Research Desk

Crude Oil Rallies Over Geopolitical Tension, Awaiting U.S Inventories

Fundamentals:

Crude oil prices added +1.28 profit bp this week +2.44% with 53.58 April-2017-fresh-highs. On March 2017, oil prices fell to the lowest at 47.07 over concerns of market glut driven by intensive U.S shale drilling and overloaded storage. Last week, U.S attack on Al-Shaayrat airfield sparked fears in market with possible consequences that yet might come in coming days and this week, tension aroused further more as U.S battleships approaches North Korean offshore, and the Koreans responded with a sharper ascending tone, threatening to use Nuclear muscle power, in case they are provoked.

On the other hand, Saudi Arabia told OPEC cartel that they have the good intention of extending OPEC-deal that was constructed in Vienna, late 2016. Add to that, troubles with Libyan oil filed still continues. Last week, there were also concerns about a supply outage at a field in the United Kingdom’s North Sea that feeds into an international benchmark price.

According to OPEC’s sources quoted by Reuters, OPEC’s 11 states with oil output targets comply 104% with curbs in March. Also, OPEC oil output data from secondary sources may be revised before publication on Wednesday. On Tuesday, the American Petroleum Institute said U.S. crude oil inventories fell by 1.3 million barrels last week, following a 1.8 million drop seen in the previous report. The weekly inventory report from the Energy Information Administration due to be released today during the NA session now has the potential to record a drop as well.

Summary: Given the geopolitical tension in the middle eat and the ugly flirting between U.S and North Korea, crude levels has the potential to break higher. Add to that, Saudi Arabia message of six months extension desire which is a clear message for April 22th 2017 OPEC next-meeting, will support oil bullish forces more. We look forward for U.S Crude Inventories today at 2:30 PM GMT.

Technical Overview:

Trend: Bullish/sideways

Resistance levels: R1 54.11, R2 54.79, R3 55.63

Support levels: S1 52.52, S2 51.67, R3 50.71

Remark: The market has turned short term bullish. A close over 53.65 is needed to continue pressing advances. Be guard for a back off from 53.65 into a short term swing high. Corrections should fight to hold along 51.00. A close Below S3 level is an indication for shifting course trend to bearish.

For more in depth Research & Analysis please visit FxGrow.

Note: This analysis is intended to provide general information and does not constitute the provision of INVESTMENT ADVICE. Investors should, before acting on this information, consider the appropriateness of this information having regard to their personal objectives, financial situation or needs. We recommend investors obtain investment advice specific to their situation before making any financial investment decision.

FxGrow Fundamental Analysis – 12th April, 2017
By FxGrow Investment Research Desk

USD/CAD Extends Losses Ahead of BOC’s Rate Decision

USD/CAD extended the bearish momentum for the 5th consecutive session with a 1.3306 low today and stingy -33-pips price action. Loonie sharp tone was supported by collapsing U.S Dollar as the Index clocked 100.50 low today and crude oil bullish levels with 53.74 high today, considering Canada is a major oil producer. Canadian Dollar awaits today BOC interest rate decision and forecasts are highly bet to leave it at current 0.5% which could create a pessimistic wave for the Loonie, but the pair could receive a lift by Gov. Poloz depending on the speech tone.

Fundamentals:

1- CAD - BOC Interest Rate Decision today at 2:00 PM GMT.

2- CAD - BOC’s Gov. Poloz Speech at 3:15 PM GMT.

Technical overview:

Trend : Bullish Sideways

Resistance levels: R1 1.3376, R2 1.3432, R3 1.3515

Support levels : S1 1.3294, S2 1.3231, S3 1.3166

Remark : Market to consider the pair bullish despite weekly losses due to strong relatively strong USD. A break below S1 will increase selloffs and wash towards S2 level. Dips should fight S1 level. Closing under S2 level is a signal for trend reversal and market to consider the pair bearish. On the other hand, closing above R1 level will spark bullish forces towards R2 level. Expect high volatility with sideways destination shortly after BOC rate decision. Crude levels are vital for the Loonie.

For more in depth Research & Analysis please visit FxGrow.

Note: This analysis is intended to provide general information and does not constitute the provision of INVESTMENT ADVICE. Investors should, before acting on this information, consider the appropriateness of this information having regard to their personal objectives, financial situation or needs. We recommend investors obtain investment advice specific to their situation before making any financial investment decision.

FxGrow Fundamental Analysis – 13th April, 2017
By FxGrow Investment Research Desk

Gold Tweets Higher Over Collapsing U.S Dollar, Eyes on U.S Data

For the second week, Trump interfered, forbidding gold bullish forces to shift course and shoot lower. Last week, an attack on Syria with Tomahawk missiles, creating uncertainty and political tension in the middle eat. But Trump didn’t stop at this level, he amplified the compass and headed east towards North Korea, increasing further tension, and along with it, gold was the ultimate choice as sacred haven for market with 1279.96 high.

Yesterday, Trump broke his fasting silence with a hint that U.S Dollar is too strong causing U.S Index to shed $0.5 within 15 minutes, and today, U.S Index anchored at 99.91 low after clocking 101.24 on Monday. As a result, gold added $17 additional profits this week with a 1288.03 high, with expectation of bullish dilatation as tails yet to follow Trump’s tweets. April is the lucky month for the yellow metal with $49 profits and +34.8% gains. XAUUSD can officially consider Trump as a strong ally and can count on Trump when desperate measures fail.

Today, U.S Data has two major news with high impact, Producer Price Index PPI and Unemployment Rate, both scheduled for a release at 12:30 PM GMT, and market is anticipating the result and how Trump will tank U.S Dollar again.

Technical Overview:

Trend: Bullish

Resistance levels: R1 1290.55, R2 1302.05, R3 1312.05

Resistance levels: S1 1271.55, S2 1262.70, S3 1253.03

Comment: Market to consider gold bullish due to the above fundamentals, but U.S data today could tackle rising cable or contribute to gold’s bullish forces further. The pattern hints for a larger upswing if we see trade accelerate over 1285+, aiming at R2&R3 as a target. Any corrective dips should fight to hold over previous congestion at S1 level to keep strong bull forces. A penetration for S2 level in an alert for trend reversal, but only a close below 1249 is a 100% confirmation for bearish momentum.

For more in depth Research & Analysis please visit FxGrow.

Note: This analysis is intended to provide general information and does not constitute the provision of INVESTMENT ADVICE. Investors should, before acting on this information, consider the appropriateness of this information having regard to their personal objectives, financial situation or needs. We recommend investors obtain investment advice specific to their situation before making any financial investment decision.

FxGrow Fundamental Analysis – 13th April, 2017
By FxGrow Investment Research Desk

Japanese Yen Surges Over Tanked U.S Dollar, U.S Data Eyed

USD/JPY extended the bearish momentum with 108.76 18-Dec-2016-fresh-lows supported by crisp U.S Dollar performance and upbeat Chinese Trade Balance. Overall, political tension starting with attacks on Syria and U.S battleship approaching North Korean offshore added political and economical uncertainties, hence Japanese Yen is a sacred refuge. Add to that, Trump comment yesterday that U.S Dollar is relatively too strong, tackled the Index to 99.91 low today with expectations that negative tails will follow such surprising deceleration. Trump also mentioned that question marks are placed next to Yellen as nomination for next U.S Fed presidency. Along came with it. Chinese trade balance early this morning scored $23.93B surplus versus +$10B expectations, adding more weight to Asian currencies.

U.S Data today will give a better clue on how the pair will trade for the coming hours.

Fundamentals:

1 -USD - Producer Price Index today at 12:30 PM GMT.

2- USD - Unemployment Rate today at 12:30 PM GMT.

Technical overview:

Trend: Bearish Sideways

Resistance levels: R1 110.10, R2 111.04, R3 111.93

Support levels: S1 108.59, S2 107.75, S3 106.95

Comment: The market has turned bearish at the moment but keep an eyes on U.S Index levels. Trades below R1 will sustain bearish forces. A penetration for S1 level will increase selloffs and wash towards S2&S3 levels. On the other hand, a break above R1 level signs for larger bull waves R2 level at which, the pair will shift to bullish.

For more in depth Research & Analysis please visit FxGrow.

Note: This analysis is intended to provide general information and does not constitute the provision of INVESTMENT ADVICE. Investors should, before acting on this information, consider the appropriateness of this information having regard to their personal objectives, financial situation or needs. We recommend investors obtain investment advice specific to their situation before making any financial investment decision.

FxGrow Fundamental Analysis – 14th April, 2017
By FxGrow Investment Research Desk

EUR/USD Hovers With Tight Range, Eyes On U.S Data

EUR/USD traded flat with stingy 22-pips price action and clocked a high 1.0627, still below 50-SMA (D1) at 1.0663, with a cautious tone persisting across the financial markets against the back drop of the geopolitical tensions surrounding North Korea and today’s U.S Mother of all Bombs release on Afghanistan for the first time.

On other hand, French elections knocking on doors with the first round on April 23 2017 and bets are placed by markets between Macron and Le Pen (Anti EU), expectations of high volatility before and after results. Will the EU witness another departure after Brexit and now Frexit?

The pair awaits U.S Data today with Consumer Price Index and Retail Sales in focus. Forecasts for CPI is booked at 0% compared to 0.1% previously, whilst Retail sales scored 0.1% earlier and predictions are left untouched as previously. CPI and Retail sales will impact U.S Index highly, but these two data are vital for inflation and U.S Fed will be watching closely results which will either set the hawkish to dovish tone for next FOMC meeting.

Fundamentals:

1- USD - CPI and Retails sales today both scheduled at 12:30 PM GMT.

Technical overview:

Trend : Bearish

Resistance levels: R1 1.0648 R2 1.0699, R3 1.0723

Support levels : S1 1.0589, S2 1.0550, S3 1.0518

Comment: The market is still in bear trend and the back off on Thursday cautions for pressured action early this week to test last week’s basing levels at 1.0637. A close under 1.0637 indicates a further selloff towards S1 level. Trade may creep back higher, but a push over 1.0709 is needed to foster rallies to challenge 1.0738 for a short term bottoming upturn. U.S Data today will draw a better picture on how the cable shall perform.

For more in depth Research & Analysis please visit FxGrow.

Note: This analysis is intended to provide general information and does not constitute the provision of INVESTMENT ADVICE. Investors should, before acting on this information, consider the appropriateness of this information having regard to their personal objectives, financial situation or needs. We recommend investors obtain investment advice specific to their situation before making any financial investment decision.

FxGrow Fundamental Analysis – 19th April, 2017
By FxGrow Investment Research Desk

Sterling Hikes Over Optimism Driven By Snap Early Elections, Awaiting Parliament Approval

UK PM Theresa May stole the thunder yesterday despite current political tension hovering over the globe first by a sudden scheduling for media press, second by surprising call for UK’s early elections by 8th of June, although the lady had previously disapproved such move. As a result, Sterling was on a chaotic ride with an incline destination, surging +390-pips as daily market action and GBP/USD clocked 1.2905 4th-Oct-2017 fresh highs with a reminder of Brexit’s volatility before and after the referendum. U.S Dollar yesterday soared and has seen pale as the U.S Index plunged -$0.94 with April-fresh-lows at 99.34 facing sharp British Pound. Currently the pair trades 1.2826 intraday and has over passed 200 SMA at 1.2623.

PM May’s move called for UK citizens for once and all, open a new page, let the people decide, and put Brexit behind. The house of Commons will vote today for May’s proposal with signs of approval which should boost GBP/USD higher. On the other hand, any rejection could result of a collapsing Sterling and digesting yesterday’s gains.

Fundamentals:

1- GBP - UK House of Commons decision on PM May early election today.

2- USD - Unemployment Claims tomorrow at 12:30 PM GMT.

3- GBP - BOE’s Gov. Carney speech tomorrow at 3:30 PM and 4:30 PM GMT.

Technical Overview:

Trend: Bullish

Resistance levels: R1 1.2938, R2 1.3022, R3 1.3154

Support levels: S1 1.2767, S2 1.2683, S3 1.2595

Summary: The explosive rally signals a significant upside breakout from a coiling congestion pattern on a weekly chart, creating a target at R3. The strong close yesterday alerts for a dilation for bullish forces. Be careful from resistance at R2 +/-. Any congestion over 1.2721 will likely develop a bull flag or staging level for rallies. A close below S3 is needed for trend reversal. Be aware of setbacks as a test on S&R level due to high volatility for the cable. PM early election proposal is the main gear for GBP/USD movement.

For more in depth Research & Analysis please visit FxGrow.

Note: This analysis is intended to provide general information and does not constitute the provision of INVESTMENT ADVICE. Investors should, before acting on this information, consider the appropriateness of this information having regard to their personal objectives, financial situation or needs. We recommend investors obtain investment advice specific to their situation before making any financial investment decision.

FxGrow Fundamental Analysis – 19th April, 2017
By FxGrow Investment Research Desk

Crude oil Slips Over API Report, U.S Inventories in Focus

Crude Oil levels dipped -$0.76 yesterday with a 52.09 low, a minor downward correction after API report showed that U.S. crude stockpiles fell less than expected in the latest week while gasoline stockpiles grew unseasonably, but markets remained bloated. On Wednesday, oil showed stability with 52.61 high after OPEC Secretary-General Mohammad Barkindo mentioned that all oil producers taking part in a supply-cut treaty are committed to deliver global inventories down to the industry’s five year average and restoring stability to the market.

OPEC and non-OPEC producers agreed in December to cut supplies for six months, helping lift oil prices to about $55 a barrel after a two-year slump. OPEC will review policy for the second half of this year at a May 25 meeting.

Barkindo, crossed wires in the United Arab Emirates, saying that compliance data in March is showing better conformity by the oil producers with the agreement than in February.

OPEC with other producers like Russia, has agreed to curb output by almost 1.8 million barrels per day (bpd) during the first half of the year. Saudi crude exports dropped to 6.96M bpd during February, from 7.7 million bpd in January, according to (Jodi). Its production, however, rose to 10 million bpd in February, up from 9.75 million bpd in January, as domestic refiners processed more oil. (Reuters).

Trump recently waived that Iran’s nuclear treaty will be revised, but ever since sanctions were lifted against Tehran, crude oil exports has doubled and more which kept market oil supplies overloaded and contributed to oil bearish levels, at that, Trump has the time to consider any move towards Iran, since it’s of U.S interest to maintain lower oil levels.

Look forward for U.S Inventories today which will impact crude levels for the next coming days.

Technical overview:

Trend: Bullish sideways

Resistance levels: R1 52.67, R2 53.22, R3 54.05

Support levels : S1 52.08 , S2 51.48, S3 50.78

Comment: The market remains short term bullish with choppy trading. Closing above R1 will sustain bullish forces and projects for a larger hike towards R2&R3. A close below S1 alerts for futher selloffs with congestion and wash towards S2&S3. Below S3, market will shift bearish.

For more in depth Research & Analysis please visit FxGrow.

Note: This analysis is intended to provide general information and does not constitute the provision of INVESTMENT ADVICE. Investors should, before acting on this information, consider the appropriateness of this information having regard to their personal objectives, financial situation or needs. We recommend investors obtain investment advice specific to their situation before making any financial investment decision.

FxGrow Fundamental Analysis – 20th April, 2017
By FxGrow Investment Research Desk

Gold Retreats As Political Tension Fades Away, Eyes on U.S Data

Gold shed -$16.79 yesterday with a 1273.81 weekly fresh lows due to aggressive selling and abandoning buying positions, still above 200 D1 SMA at 1255. Last week and Monday’s rallies supported by geopolitical tension, lifted gold to 1295.27 2017-highs. Although political and economical uncertainties has temporary lulled, the coming days will witness arousing events. first from the French elections round this Sunday, to PM May’s call for early British elections which was approved yesterday and on May the 2nd, the Parliament will be dissolved. Add to that, Trump’s and his unpredictable tweets and propaganda media announcements are always on Stand-buy position, could provoke gold yet again as traders leans to the yellow metal as a sacred haven substitute.

Fundamentals:

1- USD - Unemployment Claims today at 12:30 PM GMT.

2- French Elections This Sunday.

Technical Overview:

Trend: Bullish Sideways

Resistance levels: R1 1284.02, R2 1295.80, R3 1310.81

Support levels : S1 1271.15, S2 1264.28, S3 1256.64

Comment: Gold remains bullish despite yesterday’s minor down correction. Staying above S1 sustains bullish forces and calls for additional rallies and a penetration for R2 level will dilate further gains towards R3. The other scenario, longing below S1 level will increase selloffs with congestion and wash towards S2&S3. A close below S3 calls for trend reversal and market to consider gold bearish. Keep an eye on U.S Index levels and French elections this Sunday with end results will have an impact on Gold.

For more in depth Research & Analysis please visit FxGrow.

Note: This analysis is intended to provide general information and does not constitute the provision of INVESTMENT ADVICE. Investors should, before acting on this information, consider the appropriateness of this information having regard to their personal objectives, financial situation or needs. We recommend investors obtain investment advice specific to their situation before making any financial investment decision.

FxGrow Fundamental Analysis – 21st April, 2017
By FxGrow Investment Research Desk

All You Need to Know About French Elections And Its Impact on EUR/USD Levels

French elections are knocking on doors and bets are already placed by markets on every candidate and their agendas. Now, whoever qualifies for the second round, will have a huge impact on market despite the outcome. the race is tight, and on Sunday, 23rd of April, French citizens will elect two candidates out of four who shall be eligible for the next round on May the 7th. Although this may seem irrelevant, but market should pay attention that UK parliament will be dissolved on May the 2nd, and if both dates ( May 2nd & May 7th), combined together, market will be chaotic taking into consideration UK and France, two nations representing top ten markets contributing to global economy.

This election comes within a year of the unexpected Brexit vote in the UK and the election of populist Donald Trump as president of the United States last November.

In France, the possibilities are no less dramatic with the steady advance of the far-right National Front’s Marine Le Pen taking advantage of recent threats and terror attacks on Europe.

Note: There are eleven French candidates running on April 23rd, but according to polls, it’s more likely that the four candidates; Le Pen, Macron, Mélenchon, and Fillon being triumphed or qualifying for second round on May 7th 2017. In case one of the four nominees managed to secure more than 50% of French voters, then the second round on May 7th will be discarded and a winner will be announced

First, let’s identify the four French candidates and their agenda, after that, the picture will purify and how the market will head especially for the EURO coming future.

1- What does Le Pen want:

[ul]
[li]Negotiation with Brussels on a new EU, followed by a referendum.
[/li][li]“Automatic” expulsion of illegal immigrants and legal immigration cut to 10,000 per year following an immediate total moratorium.
[/li][li]“Extremist” mosques closed and priority to French nationals in social housing.
[/li][li]Retirement age fixed at 60 and 35-hour week assured.
[/li][/ul]

2- What does Macron want:

[ul]
[li]€50bn (£43bn; $53bn) public investment plan to cover job-training, exit from coal and shift to renewable energy, infrastructure and modernisation.
[/li][li]Reimbursement of full cost of glasses, dentures and hearing aids.
[/li][li]Big cut in corporation tax and more leeway for companies to renegotiate 35-hour week.
[/li][li]Cut in jobless rate to 7% (now 9.7%).
[/li][li]Ban on mobile phone use in schools for under-15s and a €500 culture pass for 18 year olds.
[/li][/ul]

3- What does Mélenchon want:

[ul]
[li]Voting from age of 16 and a “Sixth Republic” to replace the existing presidential system.
[/li][li]Constituent assembly to acquire greater powers, voted in by proportional representation.
[/li][li]Zero homelessness and full reimbursement for prescribed health care.
[/li][li]Recognize burn-out as an occupational disease.
[/li][li]Sharp-tongued Mélenchon galvanizes left.
[/li][li]Abandon nuclear power
[/li][li]Renegotiate the terms of France’s EU membership
[/li][/ul]

4- What does Fillon want:

[ul]
[li]To scrap half a million public sector jobs and the 35-hour work week
[/li][li]Removing the wealth tax (ISF)
[/li][li] To strip jihadists returning from the wars in Iraq or Syria of French nationality
[/li][li] Requiring parents in receipt of social allowances to agree to a “parental responsibility contract”, to tackle children’s absenteeism or behaviour “disrespectful of the values of the [French] republic”
[/li][li]Lifting EU sanctions on Russia and helping Syrian President Bashar al-Assad defeat so-called Islamic State (IS).
[/li][/ul]

Who will win?

According to pollsters, 48-year-old Le Pen, an anti-EU candidate, is expected to qualify for the second round but ultimately lose to Emmanuel Macron, 39. A Le Pen victory would send shock waves every bit as seismic as events in the UK and US, likely spelling the end of the European Union in its current form. Her victory would also domestically test the country’s already strained relations with its sizable Muslim community.

What will happen to EURO?

Now we have established the above candidates and their agendas, the main concern for traders and EURO future levels are whether France will stay in EU or depart. Le Pen and Macron are more likely to qualify for the second round, but that’s not the problem. Le Pen ( Anti EU ) and Macron ( Pro EU ) will still commit to EURO bear and bull forces.

Scenario 1:

If Macron was on top and Le Pen second, optimism will arouse as France will still be part of EU cartel despite Le Pen qualifying for second round taking into consideration that Macron scored more votes which should boost and energize EURO facing U.S Dollar rival.

Scenario 2:

On the other hand, if Le Pen came first and Macron second, this indicates that Le Pen odds of heading the final round will more likely increase and the doubt about Frexit will start creeping into minds, which will result in EURO collapsing.

Scenario 3:

A qualification for Mélenchon will still support French EU membership although Mélenchon calls for a reformation between France and EU treaties, but has never called for a break from EU union.

Scenario 4:

Fillon (Pro EU) supports France being part of the EU and calls lifting sanctions on Russia which should ease the tension between Europe and Russian, and this could result in an economic growth for both countries as they both benefit and EURO could boost up on positive expectations.
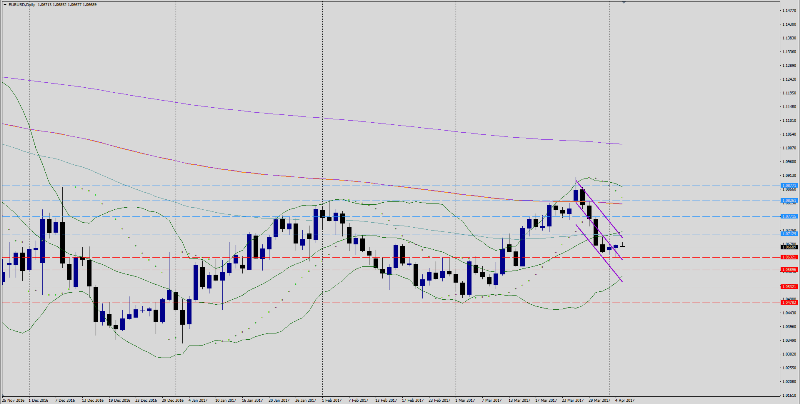
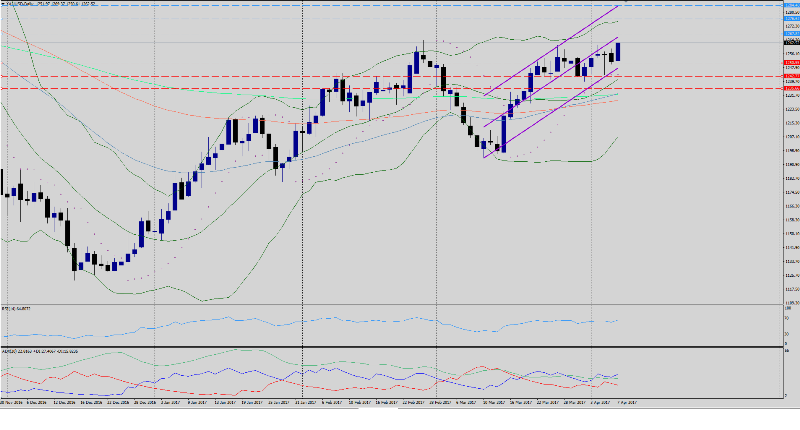
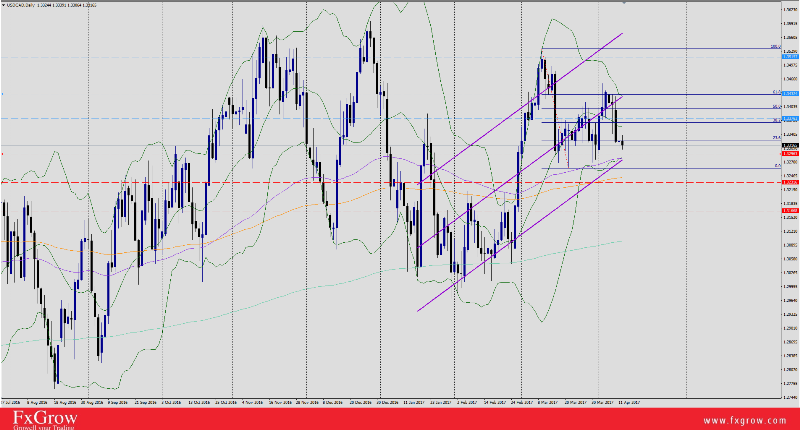
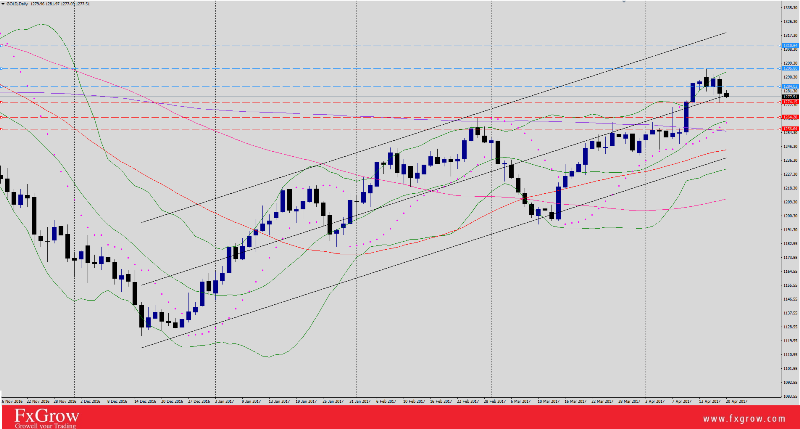
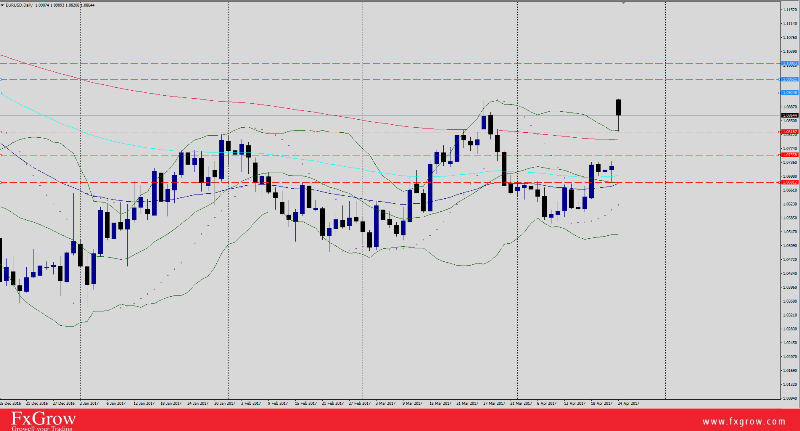
Technical overview:

Market will witness high volatility for EUR/USD levels especially on Monday opening trading sessions due to the French election end results. EUR/USD bullish forces could hike towards 1.100 resistance level as optimism arouses given that France will stay in the EU. On the other hand, in case EUR/USD collapses, expectations of bearish trend could bottom at 1.0450 support level. Resistance and support levels could take time to be reached depending on the consequences of the election.

For more in depth Research & Analysis please visit FxGrow.

Note: This analysis is intended to provide general information and does not constitute the provision of INVESTMENT ADVICE. Investors should, before acting on this information, consider the appropriateness of this information having regard to their personal objectives, financial situation or needs. We recommend investors obtain investment advice specific to their situation before making any financial investment decision

FxGrow Fundamental Analysis – 24th April, 2017
By FxGrow Investment Research Desk

EUR/USD Gaps Upward Over French Election Pollsters, Eyes on Local Data

EUR/USD inaugurated early trading sessions with a +190-pips upward gap, then added +2-pips and clocked 5 months a half high at 1.0918 driven by optimism aroused by yesterday’s French Election first round outcome given that Macron (Pro EU) headed first with 23.7% of French voters, Le Pen (Anti EU) second 21.7%. But what really boosted EUR/USD is that Fillon (Pro EU) came third with 19.9% and has requested his supporters to add their votes to Macron, hence an EU dissociation now falls into a thin scenario but still, a second round will be conducted on May the 7th where Macron and Le Pen face each others neck to neck, and Frexit will a greasy item on the menu which will create a high volatility of the pair trading coming days, depending on how French Polls play ahead.

The pair failed to guard the 1.09 level, retreated to 1.0820 low as minor down-trend correction, currently trading 1.0864 intraday. U.S Index also gaped -$0.78 with a 98.83, adding -$2.41 losses to April the 10th 101.24 high. Although EUR/USD currently bullish, market should expect a choppy bullish and bearish sideways trade for the pair in the coming hours. Trade could be poised with shy price action in the coming 2 hours ahead of German Ifo and Buba reports, but volatility should re-kick after the release.

Fundamentals:

1- EUR -German Ifo Business Climate today at 8:00 AM GMT.

2- EUR - German Buba Monthly Report today at 10:00 AM GMT.

Technical Overview:

Trend: Bullish Sideways

Resistance levels: R1 1.0924, R2 1.0962, R3 1.1005

Support levels : S1 1.0818, S2 1.0755, S3 1.0681

Comment: The market is bullish with expectations of intensive choppy sideways trade due to the above fundamentals. Dips should fight S1. Closing above 1.08 is positive. A penetration for R1 level projects additional hikes towards R2 level. A penetration for S1 level will increase selloffs and wash towards S2 level at which below, the cable will turn bearish. Keep an eye on U.S index levels.

For more in depth Research & Analysis please visit FxGrow.

Note: This analysis is intended to provide general information and does not constitute the provision of INVESTMENT ADVICE. Investors should, before acting on this information, consider the appropriateness of this information having regard to their personal objectives, financial situation or needs. We recommend investors obtain investment advice specific to their situation before making any financial investment decision

FxGrow Fundamental Analysis – 24th April, 2017
By FxGrow Investment Research Desk

Copper Slips Over Industrial Demand Decline

Copper extended the bearish momentum for the third consecutive weak and suffered losses amid a broad decline for industrial metals on Friday as worries over political instability and global demand prompted investors to cut bets on higher prices. Currently, copper is trading 255.65 intraday.

Investors have overestimated global growth and the impact of supply disruptions at major copper mines, said Norbert Rucker, head of commodity research at Julius Baer. Copper could slip to $5,200 a tonne in the next three months, he said.

  • COPPER SUPPLY: The global refined copper market had a 51,000 tonne surplus in January, up from a 44,000 tonne surplus in January last year, the International Copper Study Group (ICSG) said. But the strike at the Escondida mine in February-March meant “next month’s report should reflect a tighter market”, analysts at ING said.

  • FREEPORT EXPORTS: Freeport McMoran Inc’s Indonesia unit has been granted a permit to export 1.11 million wet metric tonnes of copper concentrate until February of next year, a trade ministry official said. (Reuters).

  • FREEPORT STRIKE: Freeport also warned that it would punish workers for absenteeism at its Indonesian operation, a day after one of its main unions announced plans for a one-month strike over employment conditions. (Reuters).
    Technical Overview:

Trend: Bearish

Resistance levels: R1 257.01, R2 259.36, R3 261.69

Support levels : S1 254.04, S2 249.35, S3 246.10

Comment: The market is triggering a downturn from congestion and targets a stretch down under 249.00. A close below 249.00 is bearish. Any correction should stay contained under 260.00 and use congestion to bear flag. A close above R3 level is needed for trend reversal and shift to higher prices.

For more in depth Research & Analysis please visit FxGrow.

Note: This analysis is intended to provide general information and does not constitute the provision of INVESTMENT ADVICE. Investors should, before acting on this information, consider the appropriateness of this information having regard to their personal objectives, financial situation or needs. We recommend investors obtain investment advice specific to their situation before making any financial investment decision

FxGrow Fundamental Analysis – 25th April, 2017
By FxGrow Investment Research Desk

Aussie Declines Despite Weaker U.S Dollar, Eyes On Local CPI

8 AM GMT, Australian dollar is showing weakness with 0.7530 weekly low with -41-pips price action, slightly (3-pips) below 200 SMA D1. Although U.S Dollar plunged today to 98.85 low, the Aussie failed to take advantage of current pale U.S Index. AUD/USD levels awaits local CPI tomorrow and on previous session, Australian CPI booked 0.5% and forecasts are expected to be 0.6%. U.S Consumer Confidence today also could add more pressure on the Aussie as U.S Dollar reacts on the outcome.

Latest inflation report released by Reserve Bank of Australia RBA indicates an inflation of 1.5% on Dec 2017. RBA Gov. Lowe will cross wires on Asian session this Thursday, and taking into consideration that CPI is highly positive as forecasts, and inflation less than 2%, expectations of a hawkish tone by Lowe is high where the Gov. could extend previous press conferences laying out a strong Australian economy which should re-boost the Aussie.

Fundamentals:

1- USD - Consumer Confidence today at 2:00 PM GMT.

2- AUD - Consumer Price Index tomorrow at 1:30 AM GMT.

3- AUD - RBA Gov. Lowe speech opening session on Thursday.

4- USD - Core Durable Goods Order and Unemployment Claims both at 12:30 PM GMT on Thursday.

Technical Overview:

Trend : Sideways

Resistance levels : R1 0.7605, R2 0.7672, R3 0.7745

Support levels : S1 0.7505, S2 0.7439 , S3 0.7355

Comment: Expectation of high volatility for AUD/USD due to the colorful economic events. Gov. Lowe speech will set the tone the Aussie, as for U.S Dollar, the U.S Data will determine how U.S Index will perform the next hours.

For more in depth Research & Analysis please visit FxGrow.

Note: This analysis is intended to provide general information and does not constitute the provision of INVESTMENT ADVICE. Investors should, before acting on this information, consider the appropriateness of this information having regard to their personal objectives, financial situation or needs. We recommend investors obtain investment advice specific to their situation before making any financial investment decision

Thanks for this analysis , i made more than 255$ of profits trading in the Aussie :slight_smile: