I’ve notice this often, yet I don’t recall seeing it taught anywhere much. Certain strong patterns end up looking like other strong patterns on different time frames. As above. Also like an H1 engulfing or piercing often looks like a pin bar on a H2. If you only use Metatrader, sometimes you won’t notice these due to it’s limited choice of time frames.
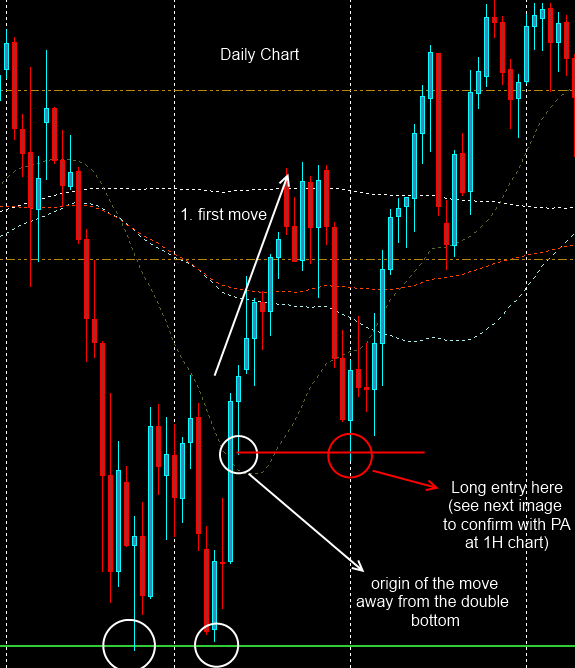
Although I am not the best guy to answer this I would say yes thats a double bottom. You have other confluences to support it to. You have the suspected double bottom on the 1 hr. Pin bars on the 8 hr with stoch in oversold. the 8hr also looks to be in OTE.
Yeah the stoch cross in oversold good confirmation too. What does OTE mean Bob?
BTW, I keep thinking your name says manic, although I’m sure you’re not
That link looks pretty nice, thanks for that.
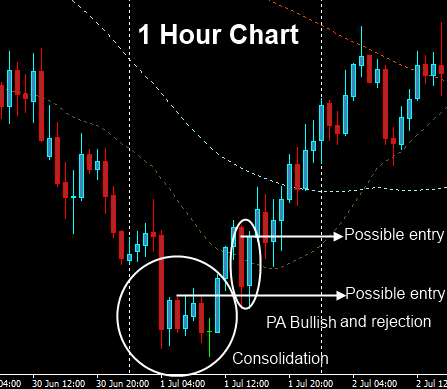
Metatrader really makes a jump from H4 to D1. I find it useful to have something in between, like H6, H8, H12. Often I find candlestick signals and other patterns on those time frames that I wouldn’t have seen otherwise. For example, the 3 pin bars on the H8 chart I posted above
H2 is pretty kick-ass too.
Actually, I really wish MT4 had more time frames. I recently found an indicator for that, which I haven’t tried yet.
It is my understanding that double bottoms are reversal signals. In order to be a true double bottom, it must be at the bottom of a downtrend.
Anyway, I do hear what you’re saying about trading with the trend, and haven’t had much success with reversals, as we can see here.
After the “confirmation” break out of the neckline, price returned back into the range. Since the signal is no longer valid, I’m thinking exit now in the middle of the range with a loss of about half the original risk, or wait and exit at the top of the range just below break even.
From a fundamental point of view, I will suggest to wait for the Great Britain"s 2Q GDP number and Germany IFO business climate survey then make your move onto GBP. Despite the decline, there is still downside room for more stop due to poor data coming out of Europe, resulting in a steep drop in a very short time.
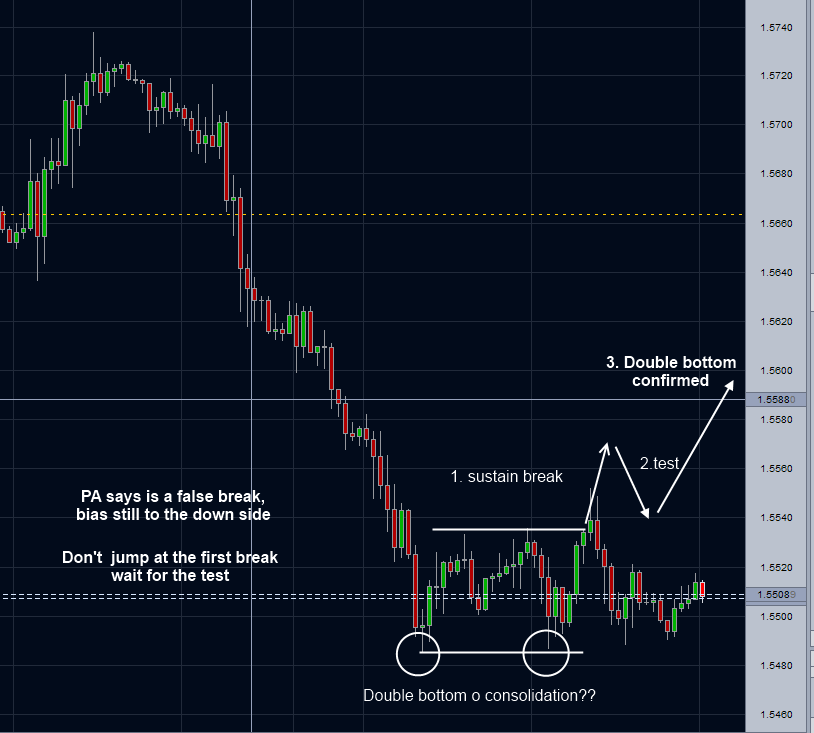
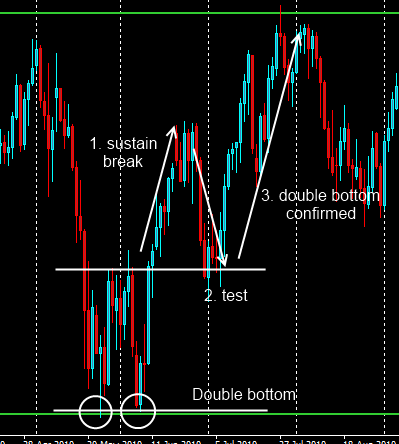
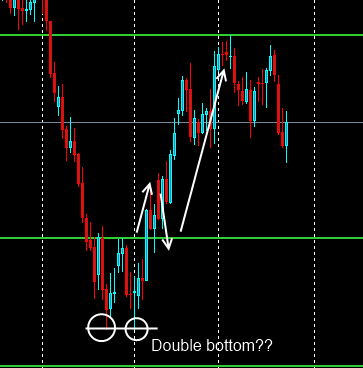
Ok, take a look at this image, they are not ‘perfect’ double bottoms, but that don’t matter, it illustrates my point.
See, double bottoms and it just keeps falling, you only see examples of double bottoms at the end of the trend on videos and stuff by amateurs trying to sell their wares, where they show you how brilliant spotting double tops and bottoms is, but they only ever show you this in hindsight when the trend has reversed, what you want to be looking out for is the next double bottom with higher lows, when you know the trend has a higher chance that it has changed, and you can continue upwards.
The thing is the truth isn’t quite as ‘sexy’ and appealing, since as an amateur you keep thinking, well i want it from the bottom becasue from the next higher low, my stop will be larger, or I’ve missed a big part of my trade or something.
EDIT: Oh and notice at the peaks, that there is minimal price action, so this downtrend we are in will just continue, guaranteed 100%
I think the images in my last post weren’t showing up. They should be there now.
In regards to the definition of double bottoms, even the School of Pipsology says double bottoms are in downtrends, and supposedly a reliable signal. That said, do agree with what Purple and Leon are saying about trading against the trend.
Waiting for a retrace, as Yunny said is a good idea, even if it means missing out when on valid double bottoms which don’t retrace.
Also, confirmation with fundamentals, as Chern mentioned, would increase chances of success, and give more reason for a reversal to happen or not happen. Fundamental analysis does my head in, but that’s not a good reason to avoid it.
I don’t like trading against the trend. It hasn’t worked well for me so far. I’m considering not trading reversals and ranges for a while, and just focus on improving what has been working for me so far, which is trend trading. Shorting the EUR/AUD has been a piece of cake lately (below). It’s been heading straight down for about 2 months.