I know, that’s why I paid close attention to crosses today.
“Vi veri universum vivus vici.”
I know, that’s why I paid close attention to crosses today.
“Vi veri universum vivus vici.”
Maybe it will come back to test 0.822 or the channel support. We’ll see. Either one is another buying opportunity unless there are reversal signs.
…no, this was not a good idea this time :34:
we have a breakout few hours ago. Still wait for a pullback, but without doing a short this time :8:
Ya…one of those ideas that just go wrong :31:
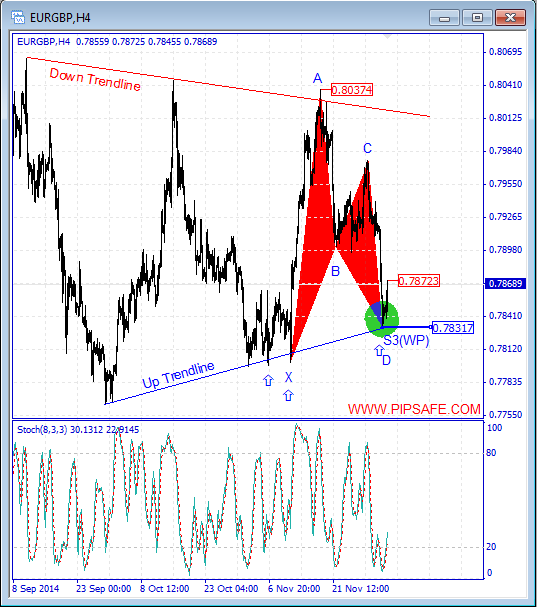
EUR/GBP during the recent days was in a strong and consistent Downtrend that sellers were successful in achieving the lowest price of 0.78317.Right now price in long time frames such as monthly and weekly is above 5-day moving average and warns about price increase in long period of time.As it is obvious in the picture below, price during the descending has touched the Up Trendline (made of 4 bottom prices) and also the S3(WP) level of 0.78317, stoped of more downtrend and on the whole there is possibility of formation of a bottom price and changing price direction.
As it is obvious in the picture below, there is a harmonic Gartley pattern between the bottom price of 0.78317 and the top price of 0.80374 that there is a potential for changing price direction from D point of this pattern.Stoch indicator is in saturation sell area that confirms the current bottom price and warns about ascending of price during the next candles.Generally until the mentioned bottom price on the Up Trendline is preserved, the price has the potential for reformation and ascending in this currency pair.
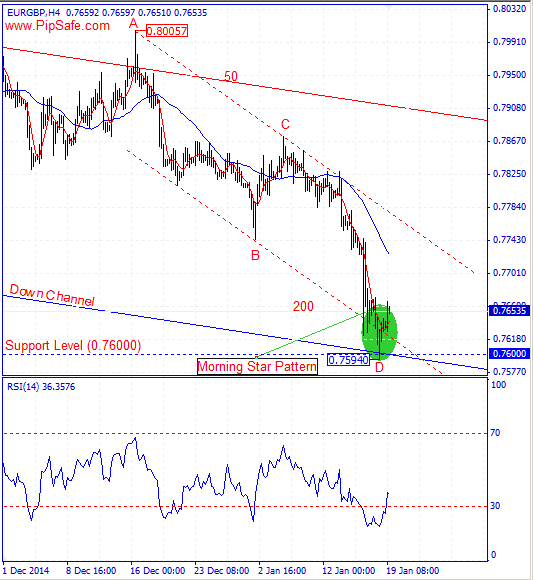
Technical Analysis of EUR/GBP dated 2015.01.19
EUR/GBP was in a strong and consistent Downtrend during the recent weeks that Sellers were successful in achieving the lowest price of 0.75940.Right now in daily , weekly and monthly time frames, the price is under 5-day moving average that shows the strong descending trend and warns about more descending.There is a Morning Star candlestick pattern( with 5 starts) in bottom price of 0.75940 that warns the potential for formation of a successful bottom price and Vulnerability of descending trend for sellers. With closing of the next bullish candle, this signal is fixed.
As it is obvious in the picture below, there is AB=CD harmonic pattern with ratios of 50 and 200 between top price of 0.80057 and the bottom price of 0.75940 that warns about changing price direction from the D point of this pattern.RSI indicator in h4 time frame is in saturation sell area and warns about descending of price according to the next cycle during the next candles.Generally according to the technical signs in the price chart until the mentioned supportive levels are preserved, the price has the potential to increase and ascend.
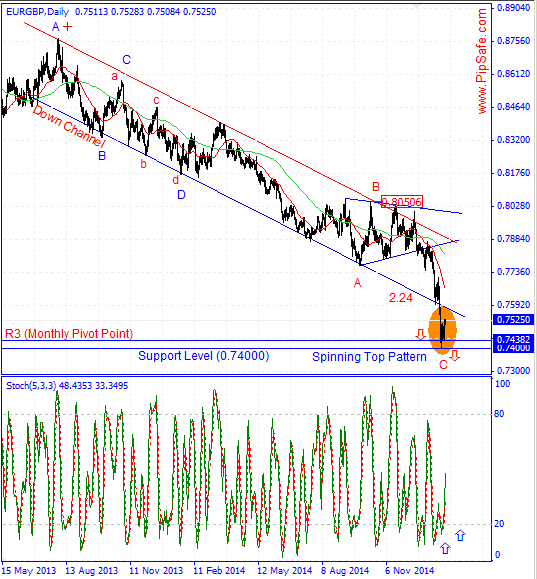
EUR/GBP was in a strong and consistent downtrend during the recent days that Sellers were successful in obtaining the lowest price of 0.74000.price with reaching to the supportive level 3 is shown in the picture below ( Monthly pivot point) and the important round level of 0.74000 has stopped from more descend( sellers used this level to exit their trades) and with formation of a bottom price in daily time frame has prepared a field for ascending of price.
As it is obvious in the picture below, between the top price of 1.80506 and bottom price of 0.74000 there is ABC harmonic pattern with ratio of 2.24 that warns the potential of ascending from the D point of this pattern.Stoch indicator is in saturation sell area in daily time frame and in divergence mode with the price chart that warns about changing price direction during the next days.Generally according to the current situation, until the bottom price of 0.74000 is preserved, there is the potential for ascending of price and reformation of descending trend.
EURGBP - Intraday - We look to Sell at 0.7430 (stop at 0.7455) A bullish hammer has been posted on the daily chart. Trades at the lowest level in 85 months. Posted mild net daily losses but all trading confined to the previous day’s range, an indecisive Inside Day. There is no clear indication that the downward move is coming to an end. Further downside is expected although we prefer to set shorts at our bespoke resistance levels at 0.7432, resulting in improved risk/reward. Our profit targets will be 0.7400 and 0.7375 Resistance: 0.7432 / 0.7450 / 0.7500 Support: 0.7400 / 0.7375 / 0.7342 –
Disclaimer: It is not a recommendation to buy or sell, nor does it constitute advice and you should not act upon this information.
EURGBP - Intraday - We look to Buy a break of 0.7405 (stop at 0.7385) Trades at the most negative level since 02/2008. We have a 61.8% Fibonacci pullback level of 0.7256 from 0.5682 to 0.9803. The selloff has posted a correction count on the daily chart. Although the anticipated move higher is corrective, it does offer ample risk/reward today. Our profit targets will be 0.7436 and 0.7453 Resistance: 0.7399 / 0.7422 / 0.7436 Support: 0.7370 / 0.7350 / 0.7256 –
Disclaimer: It is not a recommendation to buy or sell, nor does it constitute advice and you should not act upon this information
Please note that this daily bite is only one potential trade we picked from many. The total P&L shows our overall trading on clients account.
Yesterday: +0.13%
Februar P&L: +1.68%
Daily Bite:
EURGBP - Intraday - We look to Buy at 0.7413 (stop at 0.7392) Posted a Double Bottom formation. Bullish Outside Day posted, a pattern that often indicates the end of a bearish run and the start of a new upward bias. Yesterday’s Marabuzo is located at 0.7408. Trades within an intraday channel formation - high 0.7429 low 0.7409. Bespoke support is located at 0.7413. Price action is forming a bullish flag which has a bias to break to the upside. Our profit targets will be 0.7438 and 0.7467 Resistance: 0.7429 / 0.7438 / 0.7467 Support: 0.7409 / 0.7380 / 0.7350 -
Please note that this daily bite is only one potential trade we picked from many. The total P&L shows our overall trading on clients account.
Yesterday’s p/l: +0.85% (some profit taking after FOMC)
Total for February : +2,53%
Daily Bite:
GBPUSD - Intraday - We look to Buy at 1.5405 (stop at 1.5375) Trades at the
highest level in 7 weeks. Trading inside the Daily Ichimoku Cloud. Bespoke
resistance is located at 1.5469. The rally has posted an exhaustion count on
the intraday chart. There is no clear indication that the upward move is
coming to an end. Yesterday’s Marabuzo is located at 1.5393. The reaction
lower is negative, however, we view this as an opportunity to set longs in
line with the overall bullish move higher. Our profit targets will be 1.5450
and 1.5470 Resistance: 1.5470 / 1.5500 / 1.5702 Support: 1.5436 / 1.5390 /
1.5369 -
Please note that this daily bite is only one potential trade we picked from many. The total P&L shows our overall trading on clients account.
Yesterday’s P/L: +0,35%
Febraury Total: +3,20%
EURGBP - Intraday - We look to Sell at 0.7370 (stop at 0.7390) Price action has posted a bearish Engulfing Candle and is negative for short-term sentiment. Trades at the most negative level since 12/2007. Price action has continued to trend strongly lower and has stalled at the previous support near 0.7310. Due to an Ending Wedge formation, we continue to treat extended losses with caution. Preferred trade is to sell into rallies. Our profit targets will be 0.7330 and 0.7310 Resistance: 0.7387 / 0.7454 / 0.7500 Support: 0.7310 / 0.7250 / 0.7200
Where is ur EP … There is still a RL above it … Wait till it fails
i’m thinking that eurgbp have to grow up because of the eurusd (on that pair i’m waiting for growing). Will sell from 0.74380 =)
I can see an excellent entrance to the eur/gbp market after reaching the 0.7440 level. The price will go down.
"I can’t see a favorable opening for a deal right now. Therefore, I’ll wait to see which of the variants is the right one. "
I think that the eurgbp asset would renew its minimum.