[B]DAILY EUR/USD TECHNICAL OUTLOOK[/B]
Last Update At [B]07 Oct 2014[/B] [I]00:30GMT[/I]
[B]Trend Daily Chart[/B]
Down
[B]Daily Indicators[/B]
Turning up
[B]21 HR EMA [/B]
1.2601
[B]55 HR EMA[/B]
1.2591
[B]Trend Hourly Chart[/B]
Near term up
[B]Hourly Indicators[/B]
Easing fm o/bot
[B]13 HR RSI [/B]
72
[B]14 HR DMI[/B]
+ve
[B]Daily Analysis[/B]
Marginal rise b4 strg retreat
[B]
Resistance[/B]
1.2748 - 50% r of 1.2995-1.2500
1.2699 - Last Thur’s high
1.2675 - Y’day’s high
[B]Support[/B]
1.2608 - 38.2% r of 1.2500-1.2675
1.2571 - Last Tue’s low
1.2542 - Y’day’s NY low
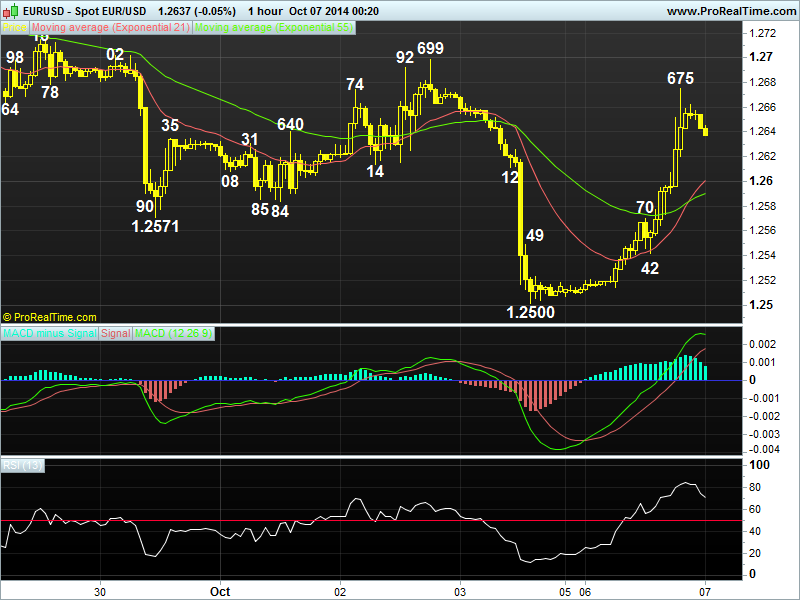
. [B] EUR/USD[/B] - 1.2635 … Although the euro remained under pressure in Asia on Mon after last Fri’s selloff to a fresh 2-year low at 1.2500, price ratcheted higher in Europe n then jumped in U.S. session on active short-covering. Price rallied to as high as 1.2675 near New York close b4 easing at Asian open today.
. Looking at the hourly n daily charts, y’day’s rally to 1.2675 strongly suggests MT downtrend fm May’s 2-1/2 year peak at 1.3995 has formed a temporary bottom there n as long as 1.2570/71 (y’day’s NY res, now sup n prev. low) holds, upside bias remains for further gain to 1.2699 res (post-ECB rate meeting high unchanged last Thur), break wud bring stronger retracement of MT intermediate decline fm 1.2995 to 1.2748 (50% r) n possibly twds 1.2765 res, however, reckon 1.2806 (61.8% r) shud cap upside this week n yield retreat later.
. In view of near term bullish scenario, buying euro on dips in anticipapation of further gain is favoured. However, as hourly indicators’ readings wud be in o/bot territory on next rise, selling euro on upmove for a strg retreat is also appropriate. On the downside, a daily close below 1.2571 wud signal correct tion fm 1.2500 has possibly ended n yield weakness twd 1.2500 later this week.
DAILY EUR/USD TECHNICAL OUTLOOK
Last Update At 15 Oct 2014 00:38GMT
Trend Daily Chart
Down
Daily Indicators
Turning up
21 HR EMA
1.2664
55 HR EMA
1.2674
Trend Hourly Chart
Near term down
Hourly Indicators
Falling
13 HR RSI
39
14 HR DMI
-ve
Daily Analysis
Consolidation with downside bias
Resistance
1.2791 - Last Thur’s high
1.2769 - Y’day’s high in Australia
1.2700 - Mon’s hourly res
Support
1.2605 - Last Fri’s low
1.2584 - Last Tue’s low
1.2500 - Oct’s fresh 2-year low
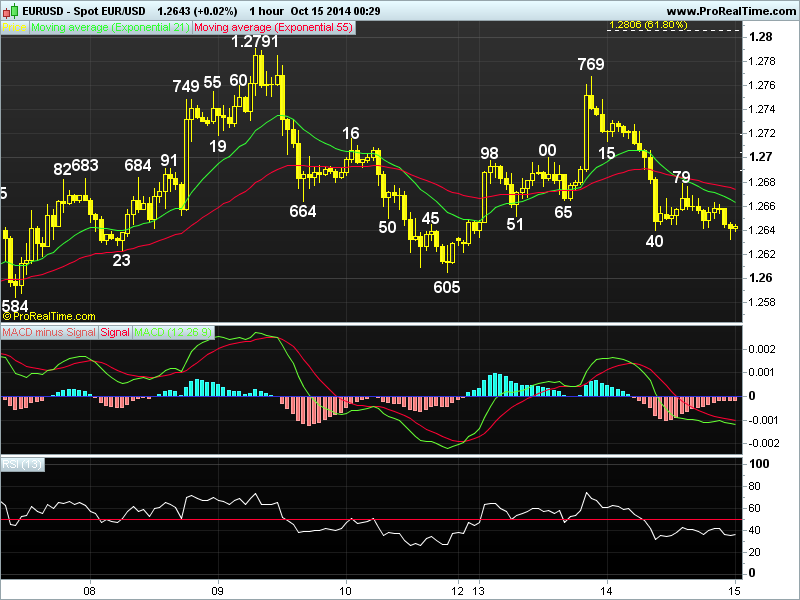
. EUR/USD - 1.2643 … Despite euro’s brief jump to 1.2769 in Aust. y’day on short covering, the pair ratcheted lower in Asia n then dropped sharply to 1.2640 in Europe after a surprise sharp fall in German ZEW economic sentiment. Euro staged a minor recovery to 1.2679 in New York morning b4 falling again.
. Looking at the hourly chart, y’day’s selloff strongly suggests correction fm Oct’s 2-year trough at 1.2500 has possibly ended at 1.2791 n further ‘choppy’ consolidation with downside bias wud be seen, a daily close below 1.2605 (last Fri’s low) wud add credence to this view n yield re-test of 1.2500 later next week, break wud bring resumption of MT fall fm May’s 2-1/2 year peak at 1.3995 to projected downside target at 1.2412 (2.618 times of 1.3995-1.3505 fm 1.3700). On the upside, only abv 1.2791 res brings stronger retracement of MT rise twd 1.2860 (prev. low, now res).
. In view of abv analysis, selling euro on recovery in anticipation of further weakness is favoured. A rise abv 1.2700 wud prolong near term gyration inside 1.2605-1.2791 broad range n another rebound to 1.2769 may be seen, break wud bring another corrective rise to 1.2791.
DAILY EUR/USD TECHNICAL OUTLOOK
Last Update At 22 Oct 2014 00:33GMT
Trend Daily Chart
Sideways
Daily Indicators
Turning up
21 HR EMA
1.2741
55 HR EMA
1.2761
Trend Hourly Chart
Near term down
Hourly Indicators
Falling
13 HR RSI
32
14 HR DMI
-ve
Daily Analysis
Consolidation with downside bias
Resistance
1.2888 - Last Wed’s 3-week high
1.2840 - Y’day’s high n last Thur’s NY high
1.2784 - Y’day’s hourly res
Support
1.2706 - Last Thur’s low
1.2669 - Last Tue’s European morning high
1.2625 - Last Wed’s low
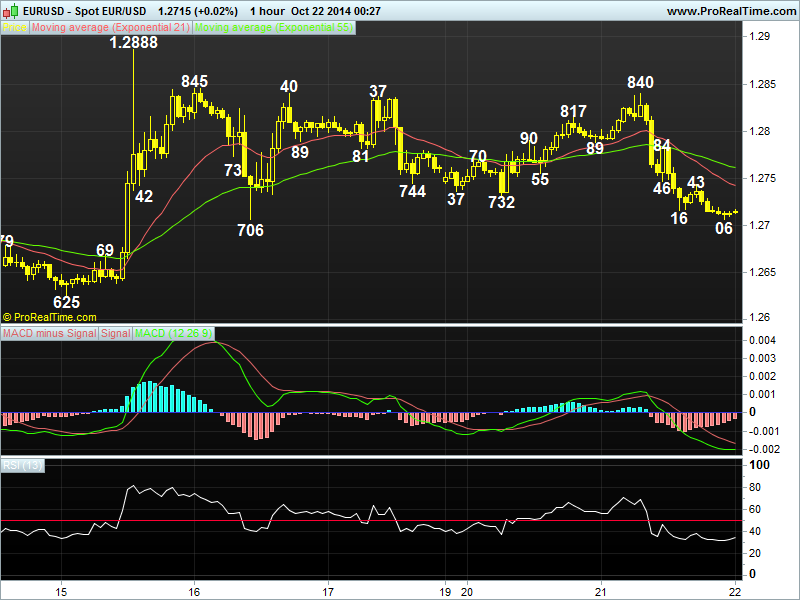
. EUR/USD - 1.2715… Despite euro’s initial brief rise to 1.2840 in Europe on Tue, the single currency n then tumbled after Reuters reported the ECB was planning on corporate bond purchase as early as Dec. The pair weakened to as low as 1.2715 near NY close n then marginally lower to 1.2706 in Australia today.
. Although last week’s rally to 1.2888 (Wed) signals the MT downtrend fm 2014 2-1/2 year peak at 1.3995 (May) has formed a temporary bottom at Oct’s 2-year low at 1.2500, y’day’s selloff suggests 1st leg of said corrective upmove has ended there n as long as hourly chart res at 1.2784 holds, consolidation with downside bias remains, a firm breach of 1.2706 sup (reaction low fm last Wed’s 1.2888 high) wud add credence to the abv view n bring further weakness twd ‘dynamic’ sup at 1.2648 (this is 61.8% r of 1.2500-1.2888) but reckon pivotal sup at 1.2605 wud remain intact. On the upside, only a rise abv 1.2888 res wud bring a stronger correction to 1.2958, this a ‘minimum’ 38.2% r of MT intermediate fall fm 1.3700 (Jul high).
. Today, we’re holding a short position in anticipation of further weakness n wud take profit on next decline as 1.2648 shud remain intact.
WEEKLY EUR/USD TECHNICAL OUTLOOK
Last Update At 09 Nov 2014 23:57GMT
Trend Daily Chart
Down
Daily Indicators
Bullish convergences
21 HR EMA
1.2432
55 HR EMA
1.2441
Trend Hourly Chart
Sideways
Hourly Indicators
Rising
13 HR RSI
62
14 HR DMI
+ve
Daily Analysis
Initial rise b4 retreat
Resistance
1.2577 - Last Tue’s high
1.2533 - Last Thur’s high
1.2495 - Last Thur’s European morning low
Support
1.2408 - Lst Fri’s Euroepan morning high
1.2357 - Last Fri’s 26-month low
1.2311 - 61.8% proj. of 1.3433-1.2500 fm 1.2888
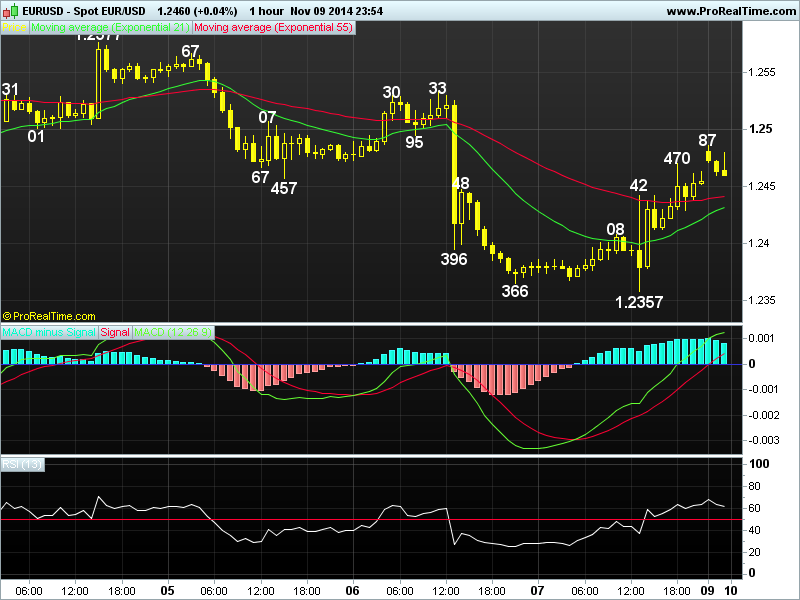
. EUR/USD - 1.2460 … The single currency continued its recent downtrend n hit a 2-year low at 1.2439 at the start of last week, despite staging a short-covering rebound to 1.2577 Tue, renewed selling emerged n knocked price to 1.2374 after ECB Draghi’s dovish comments Thur, then 1.2357 on Fri b4 rebounding.
. Looking at bigger picture 1st, despite euro’s resumption of the MT fall fm May’s 2-1/2 year peak at 1.3995 to a fresh 2-year bottom at 1.2357,as aforesaid low was also accompanied by prominent bullish convergences on the hourly & daily oscillators n subsequent bounce to 1.2470 had pushed the hourly macd abv the zero line, suggesting consolidation with initial upside bias wud be seen. However, a daily close abv 1.2577 is needed to ‘violate’ recent series of lower highs n lower lows n yield stronger retracement twd next upside obj. at 1.2771 later this month. On the downside, below 1.2357 wud yield weakness to 1.2311 (61.8% proj. of 1.3433-1.2500 measured fm 1.2888) but 1.2146 shud hold fm here.
. Today, euro’s gain to 1.2487 in NZ suggests 1-2 days of choppy sideways trading is in store, in view of abv analysis, one can trade the pair on both sides of the market as only below 1.2378 wud bring re-test of 1.2357.
DAILY EUR/USD TECHNICAL OUTLOOK
Last Update At 21 Nov 2014 00:18GMT
Trend Daily Chart
Down
Daily Indicators
Bullish convergences
21 HR EMA
1.2541
55 HR EMA
1.2533
Trend Hourly Chart
Sideways
Hourly Indicators
Neutral
13 HR RSI
55
14 HR DMI
+ve
Daily Analysis
Chopy sideways trading to continue
Resistance
1.2685 - 61.8% r fm 1.2788-1.2357
1.2602 - Wed’s NY high
1.2575 - Y’day’s high
Support
1.2505 - Y’day’s low
1.2480 - 50% r of 1.2357-1.2602
1.2444 - Tue’s low
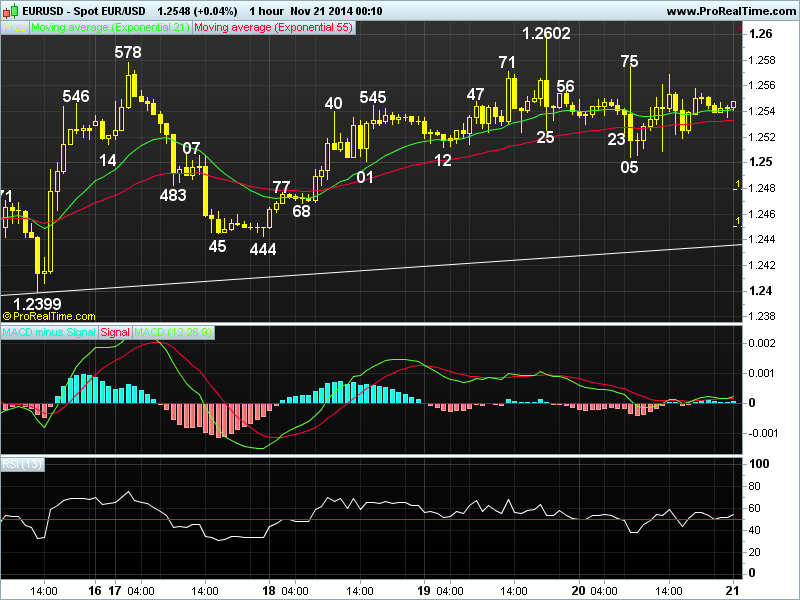
. EUR/USD - 1.2547… The single currency continued to whip around in intra-day trade on Thur. Despite staging a brief bounce fm 1.2524 to 1.2575, euro briefly dived to 1.2505 after release of downbeat German & EZ PMIs, however, the pair rebounded again to 1.2769 in New York morning b4 moving sideways.
. Looking at the hourly chart n daily charts, despite Wed’s brief breach of Mon’s high of 1.2578 to 1.2602, subsequent retreat to 1.2505 suggests the early 3-legged corrective upmove fm Nov’s 26-month trough at 1.2357 has ‘possibly’ formed a temporary top there n few days of choppy consolidation is in store, how ever, below 1.2501/05 sup (Tue’s NY low n y’day’s low respectively) is needed to confirm n yield stronger pullback to 1.2444/51 (being Tue’s low n 61.8% r of 1.2357-1.2602). Looking ahead, only breach of pivotal sup at 1.2399 wud indicate MT decline fm May’s 2-1/2 year peak at 1.3995 has once again resumed n bring retest of 1.2357 low next week. Abv 1.2602 wud send euro to 1.2622 n later 1.2685, being 50% n 61.8% r respectively of intermediate fall fm 1.2888-1.2357.
. Today, we are standing ahead initially n may give a buy recommendation if price holds abv 1.2505 for a move to 1.2622.
DAILY EUR/USD TECHNICAL OUTLOOK
Last Update At 28 Nov 2014 00:14GMT
Trend Daily Chart
Down
Daily Indicators
Bullish convergences
21 HR EMA
1.2475
55 HR EMA
1.2477
Trend Hourly Chart
Sideways
Hourly Indicators
Falling
13 HR RSI
33
14 HR DMI
-ve
Daily Analysis
Consolidation with downside bias
Resistance
1.2575 - Last Fri’s high
1.2532 - Wed’s high
1.2499 - Y’day’s N. American high
Support
1.2444 - Wed’s low
1.2402 - Tue’s low
1.2357 - Nov 07 26-month low
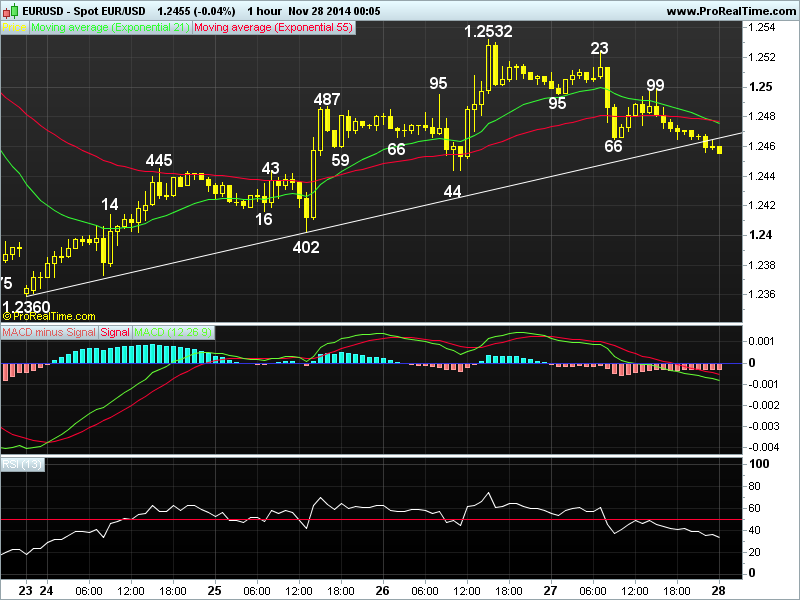
. EUR/USD - 1.2456 … Despite euro’s brief bounce to 1.2524 in European morning on Thur, offers below Wed’s 1.2532 checked intra-day gain n traders sold euro broadly after weak Spanish inflation data. Euro later ratcheted higher back to 1.2499 in quiet N. American session on short covering b4 coming off.
. Looking at the hourly n daily charts, although Wed’s brief rally to 1.2532 suggests the decline fm last Wed’s high at 1.2602 has indeed formed a low at 1.2360 on Mon n further ‘choppy’ consolidation abv Nov’s 26-month trough at 1.2357 wud continue, y’day’s retreat suggests downside bias remains, below 1.2444 sup wud bring subsequent decline twd 1.2402, a daily close below this pivotal sup is needed to confirm the recovery is over n yield resumption of MT downtrend for re-test 1.2357/60, then 1.2311 next week. On the upside, only abv 1.2532 wud extend aforesaid rise twd 1.2568/75 res area, however, as broad outlook remains ‘consolidative’, daily res at 1.2602 shud cap upside n yield decline later.
. Today, euro’s intra-day break of y’day’s 1.2466 low suggests the single currency shud remain under pressure n decline to our daily downside target at 1.2415 (our daily position is holding short at 1.2490).
DAILY EUR/USD TECHNICAL OUTLOOK
Last Update At 05 Dec 2014 00:14GMT
Trend Daily Chart
1.2364
Daily Indicators
Bullish convergences
21 HR EMA
Down
55 HR EMA
1.2364
Trend Hourly Chart
58
Hourly Indicators
Rising
13 HR RSI
Sideways
14 HR DMI
+ve
Daily Analysis
Choppy consoldiation iwth a neutral bias
Resistance
1.2532 - Last Wed’s high
1.2507 - Mon’s high
1.2457 - Y’day’s high
Support
1.2340 - Hourly chart
1.2280 - Y’day fresh 27-month low
1.2242 - 2012 Aug 10 low
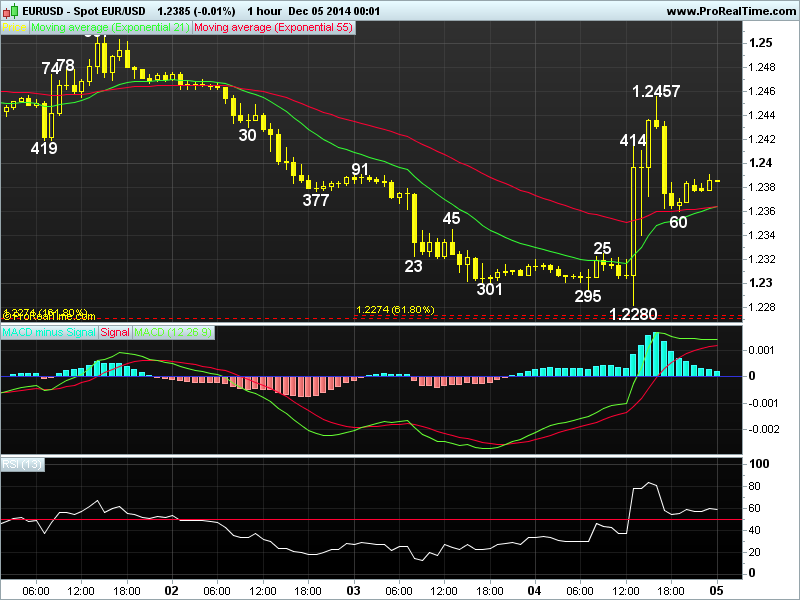
. EUR/USD - 1.23845… Euro rallied sharply against the usd on Thur as ECB refrained fm adding stimulus measures. Although price briefly fell to a fresh 27-month low at 1.2280 at the start of ECB’s press conference, euro jumped to 1.2414 n then rose to 1.2457 on short-covering b4 retreating to 1.2360.
. Looking at the hourly n daily charts, y’day’s rally fm a fresh 27-month trough to as high as 1.2457 in choppy NY session suggests MT downtrend fm May’s 2-1/2 year peak at 1.3995 has formed a temporary low there n despite subsequent retreat, as long as 1.2325 (Thur’s European morning high, now sup) holds, consolidation with upside bias remains, a daily close abv 1.2457 wud add credence to this view, then euro bring another leg of correction twd 1.2525/32(50% r of 1.2771-1.2280 n Nov 26 high respectively), however, as hourly technical indicators’ readings wud be in o/bot territory on such move, a strg retreat is likely to take place next week.
. Today, in view of abv analysis, we’re trading euro on both sides of the market initially as choppy sideways move is expected ahead of the key monthly U.S. jobs data. Only below 1.2280 wud risk one more fall to 1.2245/55.
DAILY EUR/USD TECHNICAL OUTLOOK
Last Update At 11 Dec 2014 00:10GMT
Trend Daily Chart
Down
Daily Indicators
Bullish convergences
21 HR EMA
1.2425
55 HR EMA
1.2388
Trend Hourly Chart
Near term up
Hourly Indicators
O/bot
13 HR RSI
83
14 HR DMI
+ve
Daily Analysis
Choppy consolidation with upside bias
Resistance
1.2602 - Nov 19
1.2532 - Nov 26
1.2507 - Last Mon’s high
Support
1.2425 - Intra-day low (Aust.)
1.2361 - Y’day’s low
1.2344 - Mon’s NY high, now sup
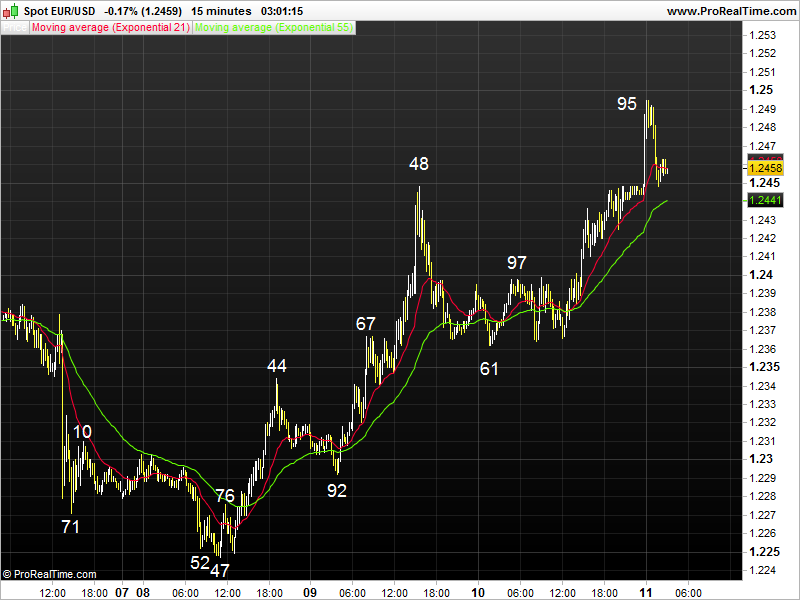
. EUR/USD - 1.2487… Euro strengthened versus the usd on Wed as renewed intra-day weakness in dlr/yen triggered another round of broad-based selling in the greenback. The single currency rebounded fm Asian low at 1.2361 to 1.2397 ahead of European open n rallied to 1.2448 in NY, then 1.2489 at Asian open Thu.
. Looking at the hourly n daily charts, as mentioned previously, euro’s bound fm Mon’s fresh 2014 trough at 1.2247 to 1.2448 Tue confirms MT downtrend fm May’s 2-1/2 year peak at 1.3995 has formed a temporary low there n several days of choppy trading abv this sup with upside bias wud be seen n intra-day break of 1.2448/57 (y’day’s high n last Thur’s high) adds credence to this view , further gain to 1.2507, then 1.2532 (Dec 1 high n Nov 26 high respectively), wud follow. However, as hourly technical indicators’ readings are in o/bot territory on such move, reckon price shud falter well below res at 1.2602 (Nov high) n may bring strg retreat later this month.
. Today, we have just taken profit at 1.2470 fm y’day’s long position n may buy again on pullback as 1.2425 (intra-day low in Aust.) may hold n only below 1.2395/99 (prev. res area, now sup) signals temp. top is made, 1.2361/65.
DAILY EUR/USD TECHNICAL OUTLOOK
Last Update At 22 Dec 2014 23:49GMT
Trend Daily Chart
Sideways
Daily Indicators
Bullish convergences
21 HR EMA
1.2242
55 HR EMA
1.2286
Trend Hourly Chart
Down
Hourly Indicators
Bullish convergences
13 HR RSI
45
14 HR DMI
-ve
Daily Analysis
Consolidation b4 MT decline resumes
Resistance
1.2347 - 50% r of 1.2474-1.2220
1.2302 - Last Fri’s high
1.2272 - Y’day’s high
Support
1.2216 - 61.8% proj. of 1.2474-1.2277 fm 1.2358
1.2174 - 61.8% proj. of 1.2888-1.2247 fm 1.2570
1.2146 - 61.8% proj. of 1.3700-1.2500 fm 1.2888
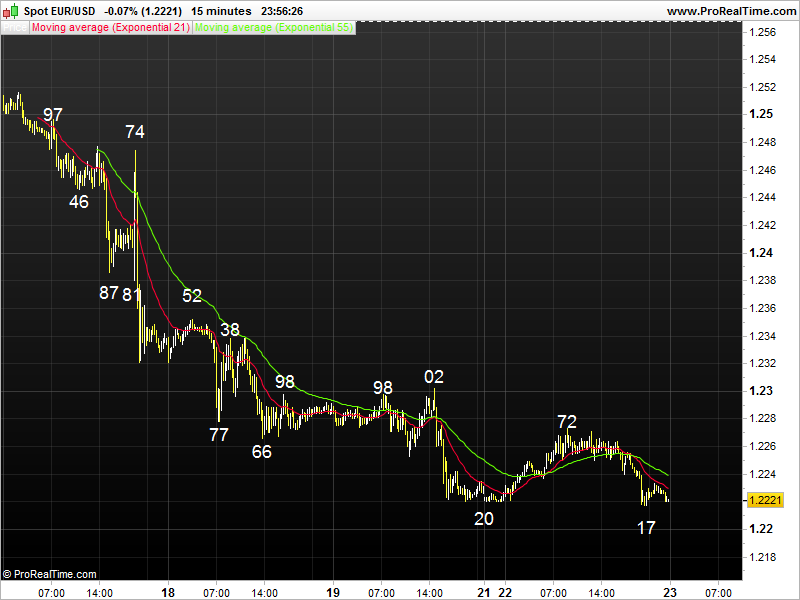
. EUR/USD - 1.2223… Euro gained a respite on Mon after failure to breach last Fri’s fresh 27-mth trough at 1.2220. Price ratcheted higher fm NZ’s low at 1.2220 in Asia n then climbed to 1.2272 in European morning. Later, euro briefly fell to 1.2250 in NY morning n fell to a session low at 1.2217 near NY close.
. Looking at the daily chart, as previously mentioned, euro’s resumption of MT downtrend fm 2014 high at 1.3995 (May) to 1.2220 last Fri suggests initial downside bias remains for further weakness to 1.2146, this is 61.8% proj. of intermediate downtrend fm 1.3700 to 1.2500 measured fm 1.2888. Having said that, as daily technical indicators’ readings wud display prominent bullish convergences on such a move, reckon ‘psychological’ sup at 1.2000 wud remain intact this month n early Jan 2015 n risk has increased for a much-needed correction to take place later. On the upside, only a daily close abv 1.2386 (prev. hourly sup, now res) wud signal a low is in place, then risk a correction twd 1.2570.
. Today, as long as 1.2272 res holds, downside bias remains for MT down-trend to extend to 1.2200 n 1.2174 (61.8% proj. of 1.2888-1.2247 fm 1.2570) but loss of momentum wud limit fall to 1.2146.
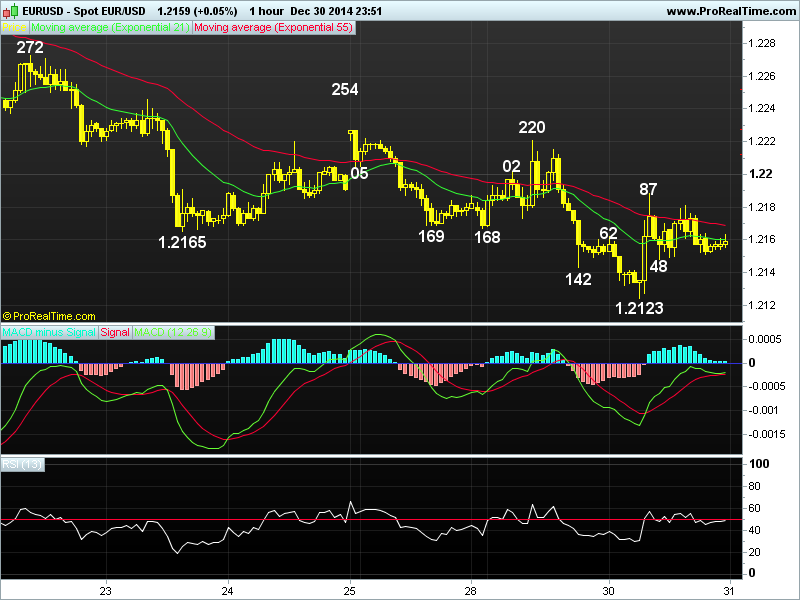
[B]DAILY EUR/USD TECHNICAL OUTLOOK[/B]
Last Update At [B]31 Dec 2014[/B] [I]00:02GMT[/I]
[B]Trend Daily Chart[/B]
Down
[B]Daily Indicators[/B]
Bullish convergences
[B]21 HR EMA[/B]
1.2160
[B]55 HR EMA[/B]
1.2169
[B]Trend Hourly Chart [/B]
Sideways
[B]Hourly Indicators [/B]
Neutral
[B]13 HR RSI[/B]
49
[B]14 HR DMI[/B]
+ve
[B]Daily Analysis[/B]
Consolidation with upside bias
[B]Resistance [/B]
1.2254 - Last Thur’s high
1.2220 - Mon’s high
1.2187 - Y’day’s high
[B]Support[/B]
1.2123 - Y’day’s fresh 29-month low
1.2100 - 50% proj. of 1.2474-1.2165 fm 1.2254
1.2063 - 61.8% proj. of 1.2474-1.2165 fm 1.2254
. [B]EUR/USD[/B] - 1.2159… Although euro continued its recent losing streak on Tue n easily penetrated Mon’s 1.2142 low to a fresh 29-month trough of 1.2123 in Asia, intra-day sharp selloff in dlr/yen triggered a brief short covering rally to 1.2187 in Europe. Euro later moved narrowly in subdued NY session.
. Looking at the bigger picture, despite Tue’s resumption of MT downtrend fm 2014 high at 1.3995 (May) to 1.2123, as this low was accompanied by ‘bullish convergences’ in the hourly indicators, subsequent rebound suggests a temporary low has possibly been made a choppy consolidation with mild upside bias is envisaged. A minimum 38.2% r of the intermediate fall fm 1.2474 wud push price to 1.2257, however, reckon 1.2298 (50% r) wud cap present rise n yield another leg of decline next week. Therefore, while trading euro fm long side in anticipation of further gain to indicated targets is recommended, position player can sell on such rise for subsequent weakness to 1.2042 (2012 trough).
. Today, euro’s narrow 1.2151-1.2181 range in NY suggests sideways move wud continue in subdued Asian trading, we’re holding a long position in anticipation of a retrace. to 1.2240 n only below 1.2123 risks one more fall to 1.2100.
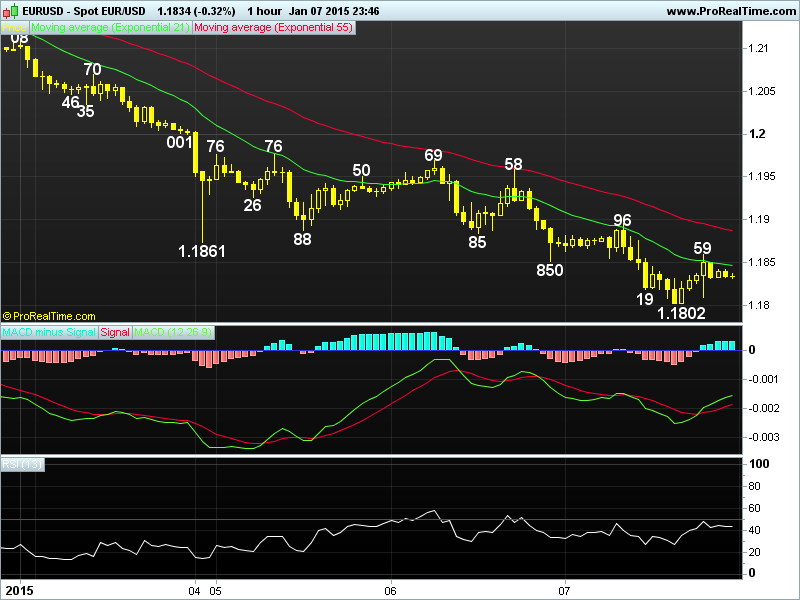
DAILY EUR/USD TECHNICAL OUTLOOK
Last Update At 07 Jan 2015 23:49GMT
Trend Daily Chart
Down
Daily Indicators
Falling
21 HR EMA
1.1847
55 HR EMA
1.1887
Trend Hourly Chart
Down
Hourly Indicators
Bullish convergences
13 HR RSI
43
14 HR DMI
-ve
Daily Analysis
Initial recovery b4 one more fall
Resistance
1.1969 - Tue’s high
1.1958 - Tue’s NY high
1.1896 - Y’day’s high
Support
1.1802 - Y’day’s fresh near 9-year low
1.1775 - 61.8% proj. of 1.2187-1.1861 fm 1.1976
1.1740 - 1.23 times extn of 1.1976-1.1850 fm 1.1896
. EUR/USD - 1.1835… Euro continued its recent losing streak on Wed after weak EU inflation data. Despite recovering fm Aust.'s 1.1850 low, renewed selling interest at 1.1896 capped intra-day gain in early Europe n euro later tanked to a 9-year trough of 1.1802 in NY morning b4 recovering after FOMC minutes.
. Looking at the bigger picture, euro’s early break of major sup at 1.1876 (this was the reaction low made in 2010 fm euro’s decline fm its record high of 1.6040 - post-Lehman top made in Jul 2008) confirms aforesaid LT downtrend fm 1.6040 to retrace the entire rise fm 0.8228 record low made in 2000 has resumed n price is en route twd 1.1212 in Q1, being the ‘dynamic’ 61.8% r of this move. On the upside, only abv 1.2123 (Dec 30 low, now res) wud signal a temporary low is made, then risk is seen for a correction twd 1.2254 (Dec 25 high on Reuters).
. Today, as y’day’s 1.1802 low was accompanied by ‘bullish convergences’ on the hourly indicators, reckon 1.1775 (61.8% projection of 1.2187-1.1861 fm 1.1976) wud contain downside n yield minor correction. Therefore, we are buying on marginal fall in anticipation of a subsequent rebound to 1.1880. Abv 1.1896 (y’day’s European high) signals temporary low is made n yield 1.1940/50.
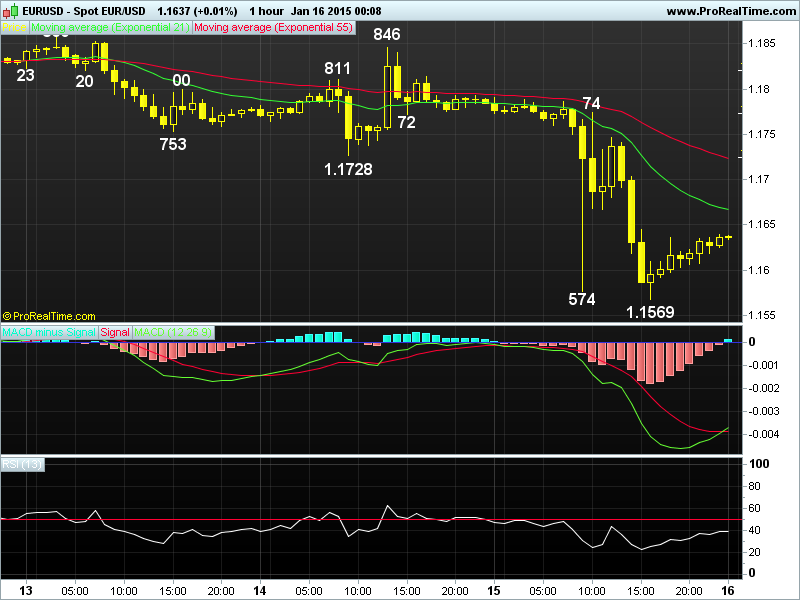
DAILY EUR/USD TECHNICAL OUTLOOK
Last Update At 16 Jan 2015 00:03GMT
Trend Daily Chart
Down
Daily Indicators
Falling
21 HR EMA
1.1667
55 HR EMA
1.1724
Trend Hourly Chart
Down
Hourly Indicators
Rising fm o/s
13 HR RSI
39
14 HR DMI
-ve
Daily Analysis
Consolidation b4 one more fall
Resistance
1.1846 - Wed’s high
1.1774 - Hourly chart
1.1667 - Prev. hourly chart sup, now res
Support
1.1569 - Y’day’s fresh 11-year low
1.1534 - 1.618 times extn of 1.2887-1.2247 fm 1.2570
1.1500 - Psychological sup
. EUR/USD - 1.1636… Despite euro’s brief bounce to 1.1786 in Asia after intra-day retreat fm 1.1793 (AUS) to 1.1760, price nose-dived to a fresh 11-year low at 1.1574 in Europe due to free fall in eur/chf after SNB abandoned franc peg. Later, euro rebounded to 1.1774 but only to fall to 1.1569 in NY.
. Looking at the hourly n daily charts, y’day’s firm breach n close below Wed’s low at 1.1728 (now res) signals LT downtrend fm 1.6040 (2008 record high) to retrace the entire uptrend fm 0.8228 record low made in 2000 has once again resumed n downside bias remains for further weakness to 1.1534 n then 1.1500, being 1.618 times extension of intermediate fall of 1.2887-1.2247 measured fm 1.2570 n psychological lvl respectively, after consolidation. Looking ahead, price is en route twd 1.1212 in Q1, being the ‘dynamic’ 61.8% r of this move.
. Today, as price is currently trading below both 21-hr n 55-hr emas, suggesting selling euro on recovery for one more decline is recommended, however, as ‘bullish convergences’ wud display on hourly oscillators on next fall, reckon 1.1500 wud hold n yield minor correction early next week. Abv 1.1774 wud be 1st signal a temporary low is in place n risks retracement twd 1.1830/40.
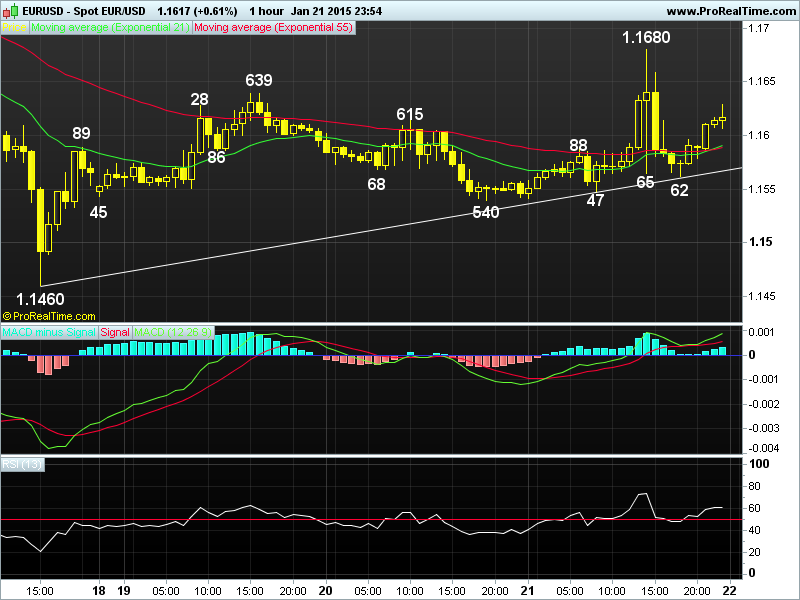
DAILY EUR/USD TECHNICAL OUTLOOK
Last Update At 21 Jan 2015 23:56GMT
Trend Daily Chart
Down
Daily Indicators
Falling
21 HR EMA
1.1590
55 HR EMA
1.1588
Trend Hourly Chart
Sideways
Hourly Indicators
Rising
13 HR RSI
60
14 HR DMI
+ve
Daily Analysis
Choppy trading to continue
Resistance
1.1774 - Last Thur’s European high
1.1728 - Last Wed’s low
1.1680 - Y’day’s high
Support
1.1540 - Tue’s low
1.1489 - Minor hourly sup
1.1460 - Last Fri’s 11-year low
. EUR/USD - 1.1615… Euro swung wildly y’day ahead of Thur’s ECB meeting. Price ratcheted higher fm 1.1542 at Asian open n climbed to 1.1641 in NY morning b4 falling briefly to 1.1565 after the news of ECB’s bond purchase plan b4 rallying briefly again to 1.1680, however, renewed selling knocked price to 1.1562.
. Looking at the bigger picture, last week’s breach of key sup at 1.1640 (2005 low) signals LT downtrend fm 1.6040 (2008 record high) to retrace the entire uptrend fm 0.8228 record low made in 2000 wud extend weakness twd 1.1212 in Q1, being the ‘dynamic’ 61.8% r of this move. On the upside, only a daily close abv 1.1728 signals temporary low is made n risks stronger retracement twd 1.1871 but price shud falter below 1.1976 (Jan 5 high) n yield another decline.
. Today, euro’s retreat after y’day’s brief rally to 1.1680 suggests correction fm said fresh 11-year low at 1.1640 has possibly ended there, break of 1.1540 (Tue’s low) wud add credence to this view n bring re-test of this sup. Looking ahead, price is en route to 1.1403, being equality projection of 1.3995-1.2500 measured fm 1.2888 later this month. On the upside, abv 1.1680 wud risk stronger gain to 1.1728, then 1.1763 (being 38.2% r of 1.2254 to 1.1460).
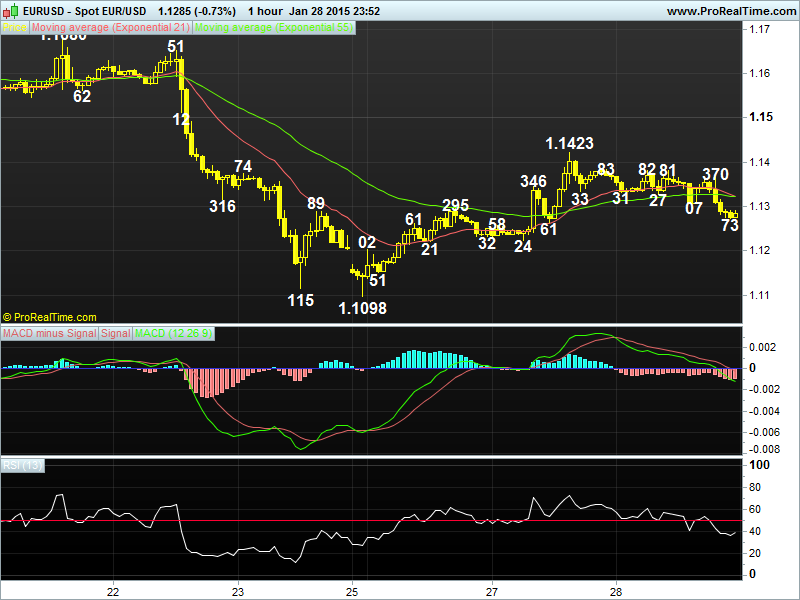
DAILY EUR/USD TECHNICAL OUTLOOK
Last Update At 28 Jan 2015 23:58GMT
Trend Daily Chart
Down
Daily Indicators
Falling
21 HR EMA
1.1222
55 HR EMA
1.1222
Trend Hourly Chart
Sideways
Hourly Indicators
Falling
13 HR RSI
39
14 HR DMI
-ve
Daily Analysis
Consolidation with downside bias
Resistance
1.1540 - Last Tue’s low, now res
1.1460 - Jan 16 low, now res
1.1423 - Wed’s high
Support
1.1295 - Mon’s high, now sup
1.1261 - Hourly chart
1.1224 - Tue’s low
. EUR/USD - 1.1283… Although euro rebounded fm 1.1331 to 1.1383 in Asia Wed due partly to cross-buying in euro, renewed selling interest capped intra-day gain n price fell to 1.1307 in NY morning. Later, euro ratcheted higher to to 1.1370 after unchanged Fed rate decision b4 tumbling to 1.1273 near NY close.
. Looking at the hourly n daily charts, although euro’s rally fm Mon’s fresh 11-year trough at 1.1098 to 1.1423 Wed signals the LT downtrend fm 1.6040 (2008 record high) has formed a temporary low there, y’day’s decline to 1.1273 signals 1st leg of correction has ended there n consolidation with near term downside bias remains for weakness to 1.1261, reckon the ‘dynamic’ 61.8% r of 1.1098-1.1423 wud contain weakness n bring rebound. Looking ahead, abv 1.1423 wud yield another leg of correction to 1.1460 (Jan 16 low) n then twd 1.1500 but as hourly oscillators wud display ‘bearish diverging signals’ on such a move, 1.1540 (38.2% r of 1.2254-1.1098) shud cap upside n yield strg retreat later.
. Today, in view of abv analysis, selling euro on recovery in anticipation of further weakness twd 1.1221/24 sup is favoured n one may even buy on such move later in the day. Abv 1.1327/33 signals low is possibly made, 1.1381/83.
DAILY EUR/USD TECHNICAL OUTLOOK
Last Update At 12 Feb 2015 00:16GMT
Trend Daily Chart
Down
Daily Indicators
Turning up
21 HR EMA
1.1312
55 HR EMA
1.1312
Trend Hourly Chart
Sideways
Hourly Indicators
Neutral
13 HR RSI
51
14 HR DMI
+ve
Daily Analysis
Choppy trading b4 one more fall
Resistance
1.1431 - Last Fri’s European morning low (now res)
1.1392 - Last Thur’s NY low (now res)
1.1360 - Mon’s high
Support
1.1270 - Mon’s low
1.1262 - Jan 29 low
1.1224 - Jan 27 low
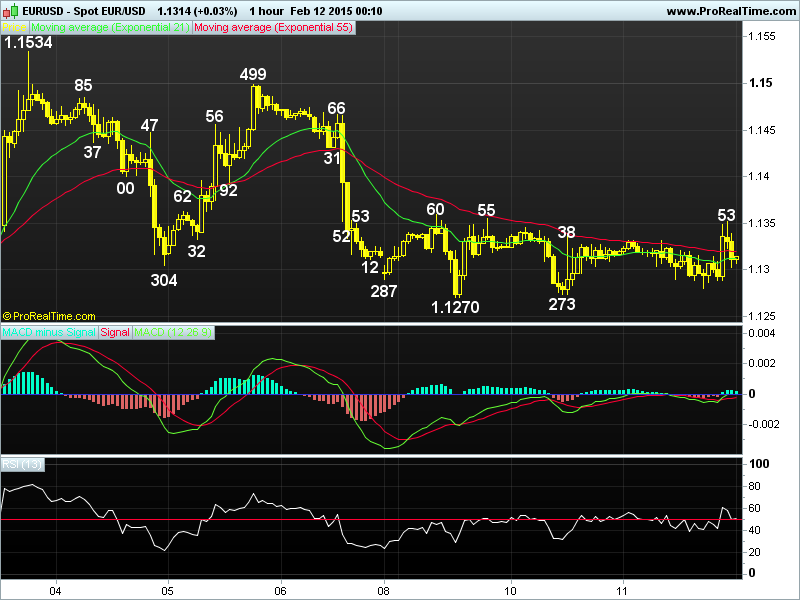
. EUR/USD - 1.1321… Euro spent another lackluster day on Wed n gyrated inside Mon’s range n with a soft bias. Price retreated after a brief bounce to 1.1331 in Asia n later, euro edged lower in NY 1.1280 b4 jumping to 1.1353 in Australia but only to fall after ‘no deal’ was reached on Greece talk.
. On the bigger picture, euro’s early decline fm last Tue’s high of 1.1534 signals at least the 1st leg of correction fm Jan’s 11-year trough at 1.1098 has ended there n volatile consolidation with downside bias is in store. Price is expected to head to 1.1262/65, this is chart sup n ‘dynamic’ 61.8% r of 1.1098-1.1534 respectively n then twd 1.1221/24 sup after consolidation, however, only a daily close below 1.1202 (prev. res, now sup) wud suggest aforesaid correction has ended, euro wud be en route to re-test 1.1098, then ‘psychological’ 1.1000 later this week. On the upside, only abv 1.1499 wud prolong choppy trading abv 1.1098 n risk another rise twd 1.1534, break there wud risk stronger correction of the MT intermediate fall fm 1.2254-1.1098 twd 1.1676 (50% r).
. Today, we’re holding a short position for one more fall to 1.1245/55 n only firm rise abv 1.1355/60 res may risk stronger retrace. to 1.1390/00 later.
DAILY EUR/USD TECHNICAL OUTLOOK
Last Update At 11 Mar 2015 01:01GMT
Trend Daily Chart
Down
Daily Indicators
Bullish convergences
21 HR EMA
1.0733
55 HR EMA
1.0803
Trend Hourly Chart
Down
Hourly Indicators
Bullish convergences
13 HR RSI
36
14 HR DMI
-ve
Daily Analysis
Consolidation b4 one more fall
Resistance
1.0823 - Y’day’s low (now res)
1.0793 - Y’day’s NY res
1.0723 - Y’day’s European morning low (now res)
Support
1.0669 - Intra-day’s near 12-year trough (AUS)
1.0624 - 61.8% proj. of 1.2570-1.1098 fm 1.1534
1.0608 - 2.618 ext. of 1.1388-1.1155 fm 1.1218
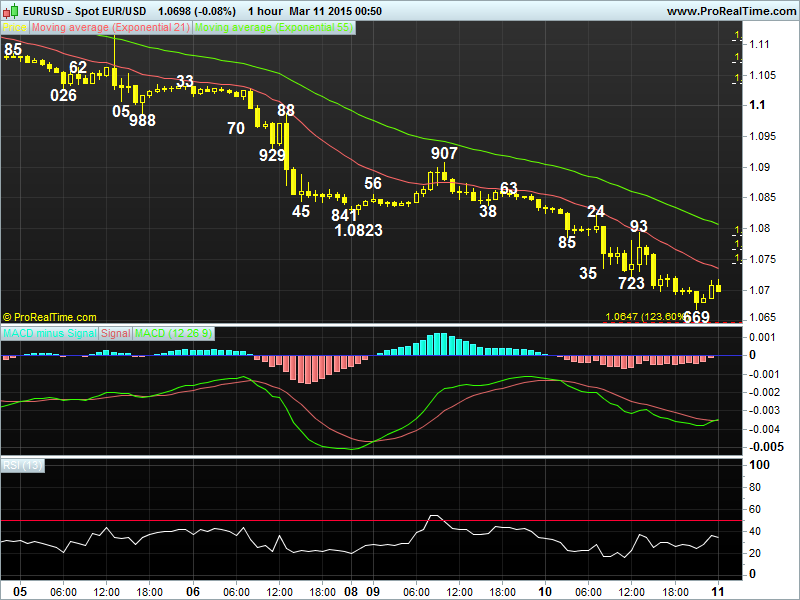
. EUR/USD - 1.0698… The single currency remained under pressure in Asia on Tue n continue to ratchet lower in Asia n Europe. Price fell to 1.0723 at NY open on cross-selling in eur/gbp together with dlr’s broad-based strength, despite a brief bounce to 1.0793, euro fell to 1.0693, then 1.0669 in Australia.
. Let’s look at the bigger picture 1st, y’day’s resumption of LT downtrend fm 2008 record high at 1.6040 to a fresh near 12-year trough at 1.0669 suggests downside bias remains for marginal weakness twd 1.0624 after consolidation, this is 61.8% projection of intermediate fall fm 1.2570-1.1098 measured fm 1.1534. Having said that, as hourly indicators wud display prominent ‘bullish convergences’ on such decline, steep fall below there is unlikely to be seen n reckon 1.0590/00 shud hold n yield a much-needed correction later. On the upside, only abv 1.0823 (prev. sup, now res) wud indicate a temporary low has been made n risk stronger retracement twd 1.0863.
. Today, expect initial consolidation b4 prospect of one more fall, so selling on intra-day recovery is favoured n only a break of NY high at 1.0793
wud be 1st signal temporary low is made, risks retracement twd 1.0823.
WEEKLY EUR/USD TECHNICAL OUTLOOK
Last Update At 15 Mar 2015 23:25GMT
Trend Daily Chart
Down
Daily Indicators
Falling
21 HR EMA
1.0528
55 HR EMA
1.0578
Trend Hourly Chart
Down
Hourly Indicators
Bullish convergences
13 HR RSI
35
14 HR DMI
-ve
Daily Analysis
Resumption of downtrend
Resistance
1.0684 - Last Thur’s high
1.0635 - Last Fri’s high
1.0565 - Last Fri’s Asian low (now res)
Support
1.0457 - Intra-day fresh 12-year low (NZ)
1.0436 - 1.618 ext. of 1.1114-1.0823 fm 1.0907
1.0350 - 80.9% proj. of 1.0907-1.0494 fm 1.0684
. EUR/USD - 1.0491 … The single currency continued its recent losing streak after a brief recovery to 1.0907 last Mon, decline accelerated on market woes over Greek debt n upbeat U.S. data, price weakened to 1.0494 Thur n staged a ferocious rally to 1.0684 on short-covering but only to fall to 1.0462 Fri.
. Looking at the bigger picture, falling technical indicators on the daily chart suggest the euro’s LT downtrend fm 2008 record high at 1.6040 wud pressure price to next downside target at 1.0436 (this is 1.618 times extension of intermediate fall fm 1.1114-1.0823 measured fm 1.0907), then twd 1.0335 (being 2003 bottom in Jan). Having said that, as daily oscillators’ readings wud be in over-sold territory, reckon ‘psychological’ level at 1.0000 wud remain intact n risk has increased for a much-needed 4-5 cent major correction to take place later this month. Therefore, selling euro on corrective rebound is the way to go, profit shud be taken on decline. Only abv 1.0684 confirms a temp. low is made.
. Today, euro fell briefly below Fri’s 1.0462 low to a fresh 12-year trough of 1.0457 in NZ, however, price has rebounded on no follow-through selling, suggesting consolidation wud be seen b4 decline resumes later today.
DAILY EUR/USD TECHNICAL OUTLOOK
Last Update At 09 Jun 2015 23:59GMT
Trend Daily Chart
Sideways
Daily Indicators
Neutral
21 HR EMA
1.1272
55 HR EMA
1.1243
Trend Hourly Chart
Near term up
Hourly Indicators
Neutral
13 HR RSI
59
14 HR DMI
+ve
Daily Analysis
Consolidation with upside bias
Resistance
1.1467 - May’s high (15th)
1.1380 - Jun 4 high
1.1345 - Y’day’s high
Support
1.1214 - Y’day’s low
1.1180 - Last Fri’s low in Aust. (now sup)
1.1115 - Hourly chart
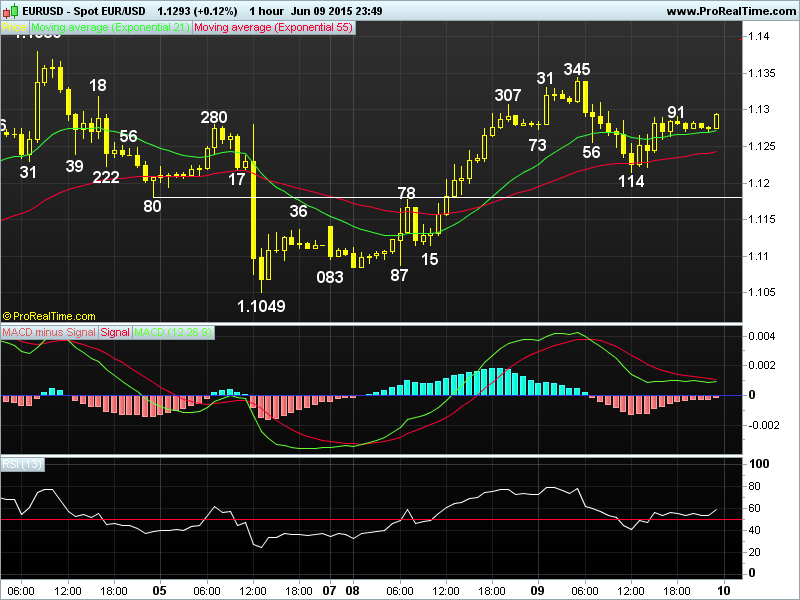
. EUR/USD - 1.1295… Trading euro on Tue was tricky as price swung wildly. Despite climbing to session high of 1.1345 near European open, broad-based selling in euro knocked price sharply lower to 1.1214, however, continued rise in German Bunds yields prompted a short-covering rebound to 1.1291 in NY afternoon.
. Looking at the daily picture, despite euro’s strg retreat fm last week’s high at 1.1380 to 1.1049 Fri, y’day’s gain to 1.1345 suggests said pullback has possibly ended n despite a brief but strg retreat to 1.1214, subsequent rebound suggests consoildation with upside bias remains n as long as y’day’s 1.1214 low holds, upside bias remains for another rise to 1.1345, abv wud encourage for a re-test 1.1380 res where a break there wud confirm correction fm May’s 3-month peak at 1.1467 has ended earlier at 1.0819 (May’s low), then further gain twd said key res at 1.1467 wud be seen later this month. On the downside, below 1.1214 wud risk weakness to 1.1178/80 where a break there wud suggest price wud continue to gyrate inside recent established broad range of 1.1467-1.0819.
. Today, intra-day firmness ahead of Asian open suggests upside bias remains for a re-test of 1.1345, then twd 1.1380, so buying on dips is favoured.
[B]Intra-day Market Moving News and Views
16 Jun 2015[/B] [I]07:39GMT[/I]
[B]EUR/USD[/B] - ..... Although euro moved sideways below Monday's high of 1.1295 in Asia and then briefly dipped to 1.1260 at European open after reports showed German inflation for May were in line with expectations.
Renewed cross-buying in the single currency quickly emerged there and lifted price above 1.1300 to a fresh session high of 1.1330 before retreating due to profit-taking.
Investors are now awaiting the release of German ZEW reports, and euro zone employment change at 09:00GMT.
DAILY EUR/USD TECHNICAL OUTLOOK
Last Update At 16 Jul 2015 00:17GMT
Trend Daily Chart
Sideways
Daily Indicators
Falling
21 HR EMA
1.0967
55 HR EMA
1.0998
Trend Hourly Chart
Down
Hourly Indicators
Bullish convergences
13 HR RSI
32
14 HR DMI
-ve
Daily Analysis
Resumption of recent decline
Resistance
1.1120 - 61.8% r of 1.1216-1.0966
1.1083 - Tue’s high
1.1034 - Y’day’s high
Support
1.0930 - Y’day’s low
1.0916 - Last Mon’s low
1.0819 - May’s low (May 27)
. EUR/USD - 1.0942… Despite staging a brief rebound fm 1.0987 to 1.1034 in European morning on Wed, euro ratcheted lower n then tumbled shortly after NY open on Fed Chair Yellen’s hawkish comments, price fell to 1.0930 b4 recovering.
. Looking at the daily chart, as euro has fallen this week after staging a strg rebound fm 1.0916 to 1.1216 this month, suggesting choppy trading below May’s 3-month peak at 1.1467 wud continue with downside bias. A daily close below 1.0916 wud dampen previous ‘triangle’ scenario n shift risk to the downside for weakness twd key sup at 1.0819 (reaction low fm 1.1467) where a break there wud confirm MT rise fm Apr’s 12-year bottom at 1.0521 has ended, then price wud be en route to next minor chart obj. at 1.0660 later this month/Aug. On the upside, if euro manages to hold abv 1.0916 sup (triangle c-leg trough) n then climbs back abv 1.1083, the abv triangle view wud be preserved n yield another rise twd 1.1216.
. Today, as euro has remained under pressure, below 1.0916 wud extend this week’s erratic fall to 1.0880/90 but ‘bullish convergences’ on hourly indicators shud keep price well abv May’s trough at 1.0819.