I was out of station for a couple of weeks. I’m back, going through all the strategies posted on this thread now! Let’s see what we can brew together.
Hi.
I’ve been in forex 4 months now. I figured out a strategy too, but really need advices to improve it. And of course, I come here in order to be helped by your programming skill.
First thing to say, I got a scalping EA that use “kertner channel” (an indicator that similar with Bollinger bands but different a little bit), it’s strategy kinda like, when the price break out of the band, then set an order. Then trailing stop, and when the price is long enough outside the band, it will come back, and it’s time to set an pending order which is in the opposite direction.
(Ex: When the price breakout the lower band, set sell order. And if this trade won - the price hit trailing stop and still outside the lower band and long enough, set and buy stop order. And vice versa)
But when I demo test that strategy, it was loss.
So I modified the code a bit. I change the code to trade opposite way. For ex, when the price breakout the lower band, trade buy. Yes it was loss too. And then I use the orriginal code and the edited code at the same pair. So that I have a hedging strategy that set buy and sell at the same time. With TP = 1 pip and no SL, I have an EA that is profitable - but ONLY when the market is sideway.
When breakout, the EA become a nightmare. Simple because no SL, the loss go on and on.
Hope you understand. I have no self confident in my strategy and my English as well 
So what I wanna say is, my strategy has just 1 problem remains: Breakout, and have to close all the lossy orders (if the price go down strongly then close all the buy orders, for ex.)
An idea of mine to do that, is if I set SL of all the orders a bit outside the band, I mean all the buy orders have SLs at the same line - about 1 pip or something. And vice versa.
That is my conclusion about 2 weeks stuck around the strategy. I don’t know coding. So really need your help. If you wanna write code for that, please try with the bollinger bands.
Thank you.
Hi
I am new to baby pips and would like to get an ea coded. I have got an bollinger band ea but does not work the way I want to opens in opposite direction ( when it should buy it sells ) .I do not know what details you would require. I would appreciate your help if you could email me Thanks,
cheers
I’ve asked for this in a few places and no one has done it for me yet so hopefully you can be my saviour…
All I would like is an indicator for MT4 that will signal a crossover of the 5 EMA and 10 EMA pretty please. I need it to send MT4 on android a push notification from MT4 on my laptop. The chart I need it for is the 15M Chart and that’s with the EURUSD Pair if any of that matters.
I really hope you can do this. Please let me know even if you can’t. Thank you
Peace :64:
Majorero, try this: fxDreema EA Builder (hit .mq4 or .ex4 button to export a file) This is the result: Screenshot by Lightshot
This is the simplest example and I decided to put some arrows to visually print the signals. And there is only one signal per bar. Because I decided to work with the already closed candle (not the current one, but the previous) the arrows are like this - up, down, up, down. Otherwise if we work on the current candle the picture is quite different. The word “crossover” means different things 
To receive notifications you must configure your MetaTrader.
Thank you so much pal. I’m in work right now but I’ll check it out later once I’m at home. I have MT4 set up with my mobile so I receive push notifications when I enter a trade, modify trades and get stopped out with TP & SL. Will this notify me of a cross too?
Lazy trader!!!
can you or anyone reading this tell me if you can get a ea to determine when a price has formed a level of support or resistance and also if price is in a range on that timeframe. average indicators are lagging and useless It needs to be dynamic.
Cheers
Darth
Hello,
That is great. I’m sure your website will be very interesting and useful.
Here are some suggestions I’ve been trying to test, but it’s hard to get them on smaller time frames without being in front of the charts all the time.
Will be very interesting to see the return in the different time frames
[I][B][U]SMAChanel +RSI Setup[/U][/B] (M5, M15, H1, H4, D1)[/I]
SMA 21 High
SMA 20 Low
RSI (8) Close 35/65
EMA 3 Close
[B]Entry SELL when:[/B]
Candle opens in between SMA21 and SMA20, and closes below SMA20
Price is below level 35 on RSI
Stop loss at the high of the candle
Open 2 orders 1% each
First close when reach 1:1
Second close when candle closes above EMA3
[B]Entry BUY when:[/B]
Candle opens in between SMA21 and SMA20, and closes above SMA21
Price is below level 65 on RSI
Stop Loss at the low of the candle
Open 2 orders 1% each
First close when reach 1:1
Second close when candle closes below EMA3
[I][B][U]Simple Cross SMA150[/U][/B] (H4, D1)
[/I]
SMA 150
[B]Entry SELL when:[/B]
Candle closes below the SMA150
Trailing Stop 50 pips
SL 50 pips
[B]Entry BUY when:[/B]
Candle closes above the SMA150
Trailing Stop 50 pips
SL 50 pips
Let me know what you think!! Cheers!
Yes, but you need rules that the EA should be looking for, such as when you consider it to be an S&R and when you consider a range to be a range. Each trader has its own opinion about that.
Could you please code it and test it for performance ? Much appreciated.
Entry
Step 1: Plot the 20 Exponential moving average (ema), the 50 ema and the stochastic oscillator.
Step 2: Wait for the 20 ema to cross over or below the 50 ema. Now any moving average system tells you when (the 20 crosses above 50 goes long. when 20 crosses below 50 go short.) THIS IS WRONG! The 20 ema crossing above the 50 ema indicates a very strong upward move that is about to correct soon.
The 20 ema crossing below the 50 ema indicats a strong bearish move that is about to retrace. So how do we know when does the retracement end and when will it continue? This is where the stochastic kicks in.
Step 3: If the 20 ema crossed above the 50, the stochastic will be OVERBOUGHT (indicating that a fall in price is near. If 20 ema crosses below the 50 ema, the stochastic will be oversold. This is the pattern I’m sharing with you; stochastic will be overbought with an upward cross over and vice versa on all trading instruments on all higher timeframes.
Step 4: Keep a close eye on stochastic, wait for it to go all the way to the other extreme. Place your entry when stochastic crosses over in the other direction.
ex: 20 ema crosses above 50 ema. Stochastic will be overbought (80+). Wait for stochastic to become oversold. when stochastic crosses up at oversold, by the next candle open.
It may sound confusing, but bear with me and things will become clearer in the example. All we did is traded the picture I shared in the first post. Price went from a low point to a high point (so 20 ema crossed above 50 ema.) price then retraced (stochastic went from overbought to oversold.) We entered when stochastic crossed over from oversold because we anticipate that price will go on to make a higher now. This is the most profitable trading pattern you will encounter.
Exit
I use trailing stops. Once we enter. I draw a fibonacci extension from the low point to the high point if its a buy signal or from the high to the low if its a sell signal. I use the following levels: 1, 1.272, 1.618, 2, 2.618, 3, 3.618, 4, 4.618, 5… and so on.
When price closes above 1, I move stops to break even. When it closes above 1.272, my stop becomes a close below 1. Then when it closes above 1.618, my stop is a close below 1.272. A close above 2, sees me moving my stop to a close below 1.618 and so on.
Hey Strategies Hunt,
I have an algorithm that needs coding below.
Risk Limits
1% of account equity per trade
50 pip stop
50 pip limit
Chart 5 Minute
Buy Set up
50 EMA Crosses Above 200 EMA
Buy Trigger
Stochastic Slow 5:3:3 Oversold at 20 back to upside
Close Position
When Stochastic is overbought at 80 back to downside
Sell set up
50 EMA crosses below 200 EMA
Sell Trigger
Stochastic Slow at 533 overbought at 80 back to downside
Close Position
When Stochastic is oversold at 20 back to upside
Hi hunt,
I posted this below in another thread not long ago but got no replies. Hopefully you can help!
[I]"I’ve been looking around for a free version of something similar to Robopips SMA Crossover Pullback, but I can only find basic Stochastic EAs with no Risk management and crossover settings.
If you guys aren’t aware of what it does, the basic rules, as I understand them are:
100 = Fast MA
200 = Slow MA
14,3,3 Stochastic
Stop Loss
Trailing stop
Take profit
1hr time frame
Toggle for specific trading times (optional)
Toggle for close on Stochastic opposite (optional)
Buy = price is above both MAs + after the fast MA crosses up over the slow MA + Stochastic has gone below 20 and has come back out, going up.
Close buy order by trail stop, take profit or stop loss.
Sell = price is below the MAs + after the fast MA crosses down over the slow MA + Stochastic has gone above 80 and has come back out, going down.
Close sell order by trail stop, take profit or stop loss."[/I]
I just HAD to quote this sentence. It is just SO cute!!!
If only life was always so simple!
Hello, I’m coffee-and-danish and this is the first time I have ever thought about posting a strategy or trying to have it coded. I may make some mistakes, but bear with me as I explain what I actually do.
- I realise that if I trade against the first price rejection, the probability of success is very high
- So if a candlestick at the start of a new time interval shows an upper price rejection the very first time, regardless of the presence of the body or if its a bull or bear: I go short. I look for the smallest hint of an upper wick, and ignore every wick that comes after/ when the time interval is up, the candle becomes bearish
- Similarly, a lower price rejection or lower wick is a red flag for me and I do not trade. I don’t trade longs ever.
- My time frame has been 5 minutes all along, but now I have started using 1 minute bc I cannot afford to wait that long
- Because I have to hyperfocus on the first few seconds of every new timeframe., I can only do one chart at a time
FINAL) I think it would be an amazing tool to have the computer tell me which way the wick went in more than one chart.
I havent picked out the kinks, I don’t know if it something that can work. I dont need previous data labelled, it makes no difference in my view. So is there a way to know only the first wick of the current candle, in more than one chart?
Hope that was clear, cheers
Could you also code a script like opening all EA’s in my Expert folder when MT4 opens? The Timeframe and asset/pair is in the name of the EA. Can this be done or can someone point me in a direction so I can code this myself?
The strategy looks good, and could work for some time before it begins to work against you.
Most of these indicators are lagging and are unreliable.
Hi,
Is it possible to code this pullback indicator?
The required pullback MT4 indicator must comply with the following two conditions, and must have email alert as well: -
Condition one:
-
It identifies Daily & Weekly trend based on the followings:
For uptrend: -Price is above 50MA, and 50MA is above 200MA,
-Not violating the formation of higher high & Higher low concept.
For downtrend: -Price is below 50MA, and 50MA is below 200MA,
-Not violating the formation of lower high & lower low concept. -
To show pullback (in direction of the trend as above) on either of the following
conditions or combined together (as customized settings on indicator):
- Off minor (most recent) or major Support/Resistance level/zone.
- Off Trendline (as on third touch or higher). TL must not cut through candle bodies.
- Off MA (either 50 or 200).
- Off 61.8 or 50% Fibonacci levels (as an additional option).
(The followings must apply to “Condition One” of this indicator:
a) D & W timeframes must agree, and can be customized to any other
consecutive two timeframes such as 4H & Daily; Daily & Weekly; Weekly &
Monthly.
b) Both Moving Averages 50 & 200 can be customized to SMA or EMA).

Condition Two:
To show price pullback off neckline in following chart patterns:
-
Head & Shoulder neckline,
-
Double Top neckline,
-
Double Bottom neckline,
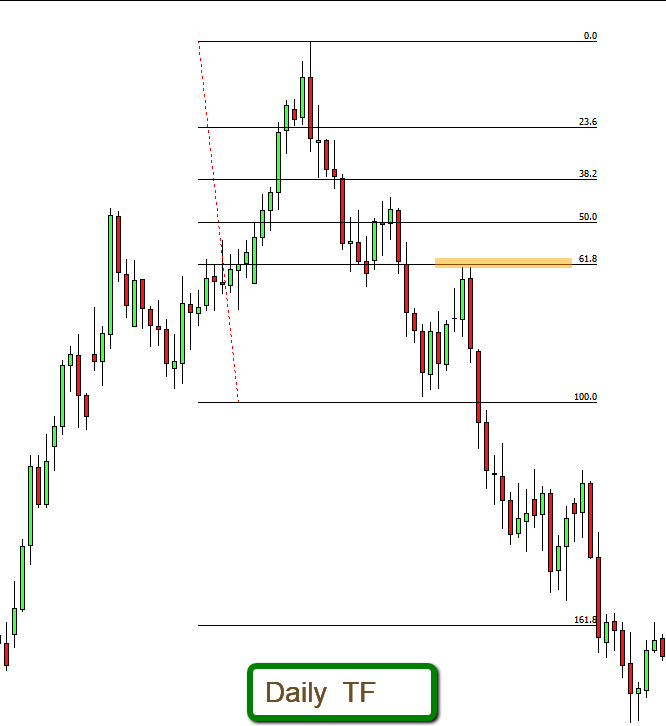
These are the effective conditions that make A+ trade setups. Simplicity is essential to get the clear picture. I really look forward to get it done and join efforts from other interested traders as well to test it and improve it for the benefit of all.

1 Like
Are you still available for coding an EA?