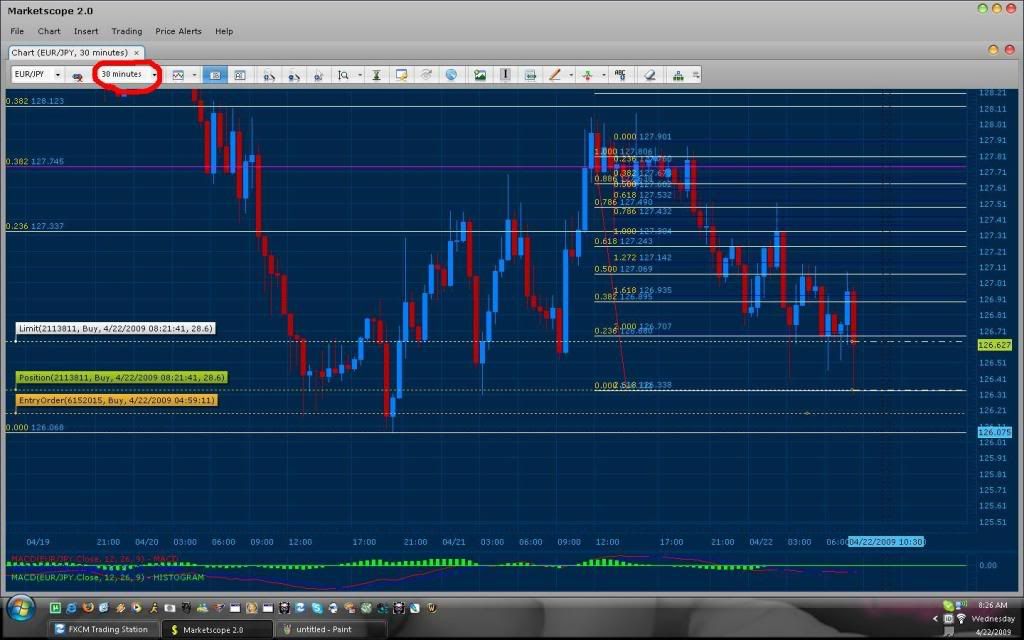
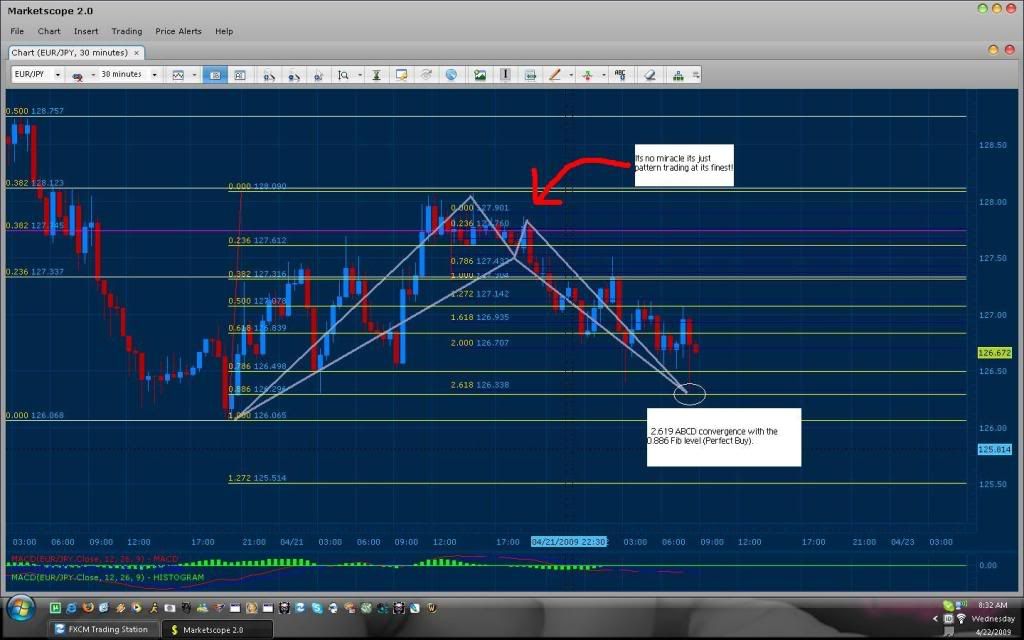
Every day I will post my success and losses on this post and will be only making 30 pip trades during the London and New York sessions. I will trade a single pair and only enter trades until my goal is reached for the day (normally takes 1 trade). My strategy is pattern trading. As a result the only tools I will need are Fibonacci, Trend Lines, Mac D, and Patience (This actually should be you #1 tool).
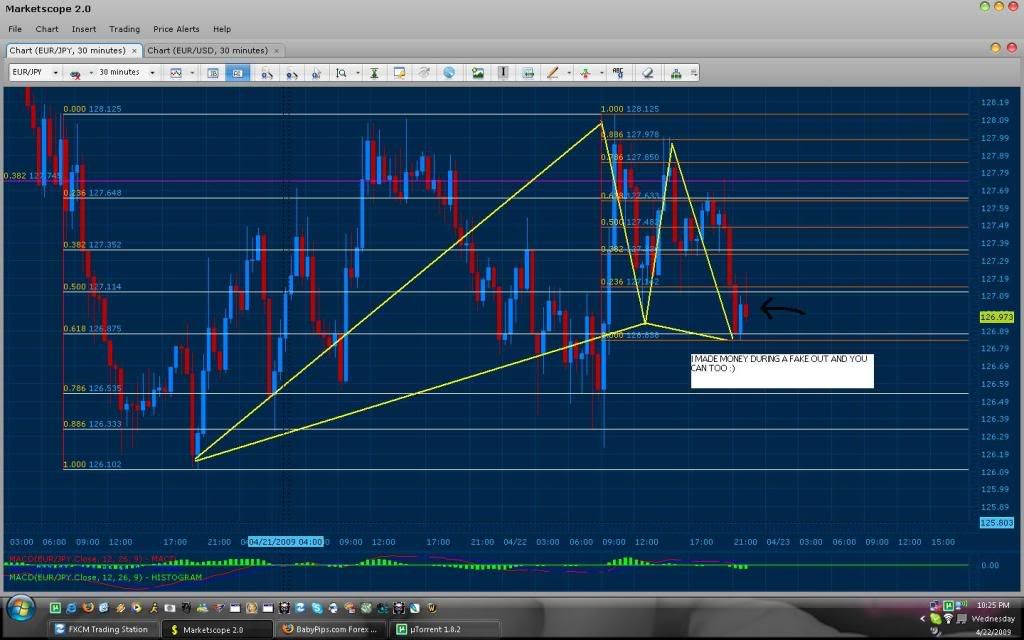
Tell me… Who makes money like this off a wick in a Obviously Bearish market with a Buy. You are all free to e-mail me for advice at any time.
-Trade Like a Pro-
I am 23 years old and I am a Forex trader
*Note I have been strictly testing my new strategy for this past month, modifying all the mistakes I have made throughout the Year and even though I am able to predict price movements of 100-200 pip moves daily with my patterns I can say that this new conservative method has doubled my account within 2 weeks only using 5-10% of my margin.
That’s exactly what I’m using and trying to do… same daily pip goal, the same broker, same pair, same timeframes, and basically same tools, except my timezone puts me in the asian session.
So what patterns do you look for mostly? and how do you use the tools together with patterns? What kind of stoploss do you use…don’t see one on your chart…? How do you manage the spikes in fxcm spreads which often trigger ones entry orders by a pip or two, then flies off the other way…lol
Hi again,
After doing some more internet research and chart checking, I believe I understand better what you’re doing. Basically fibonacci chart patterns which consist of the ABCD’s, butterflies, gartleys and possibly the 3-drive.
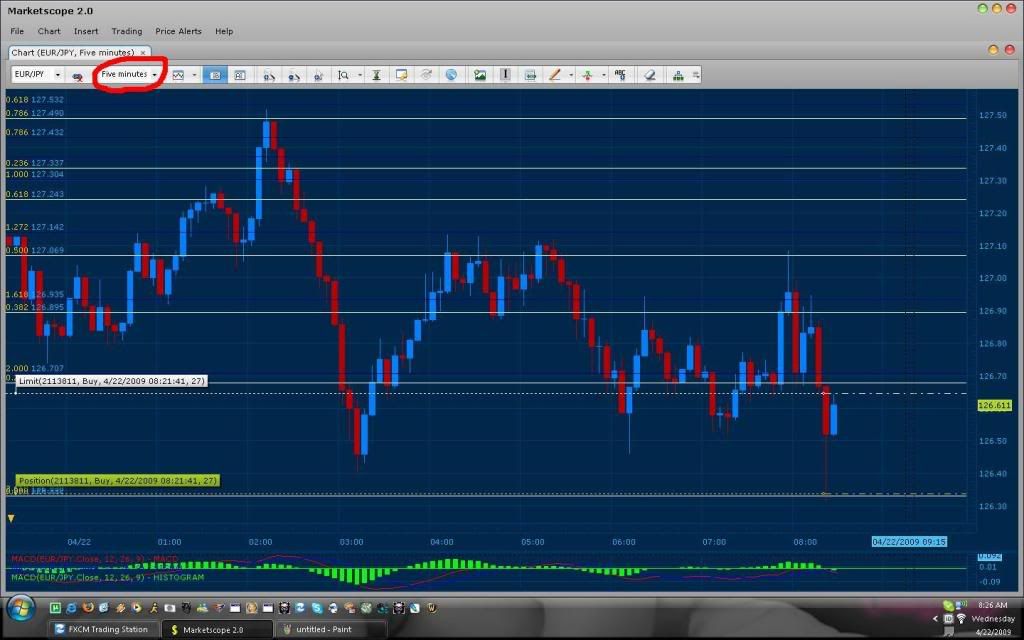
The first chart shows about just over an hour ago, on the eurjpy 5M, that I saw what could be identified as a bearish butterfly pattern starting from the X point. Maybe not perfect symestry…what do you think? At the top of the swing labeled D, I went short at 127.85 where it just broke down thru a consecutive series of higher lows. Stop went above the high at 128.00 for a 15 pip stop loss, and a profit target of roughly point C or 127.15ish for 70 pips.
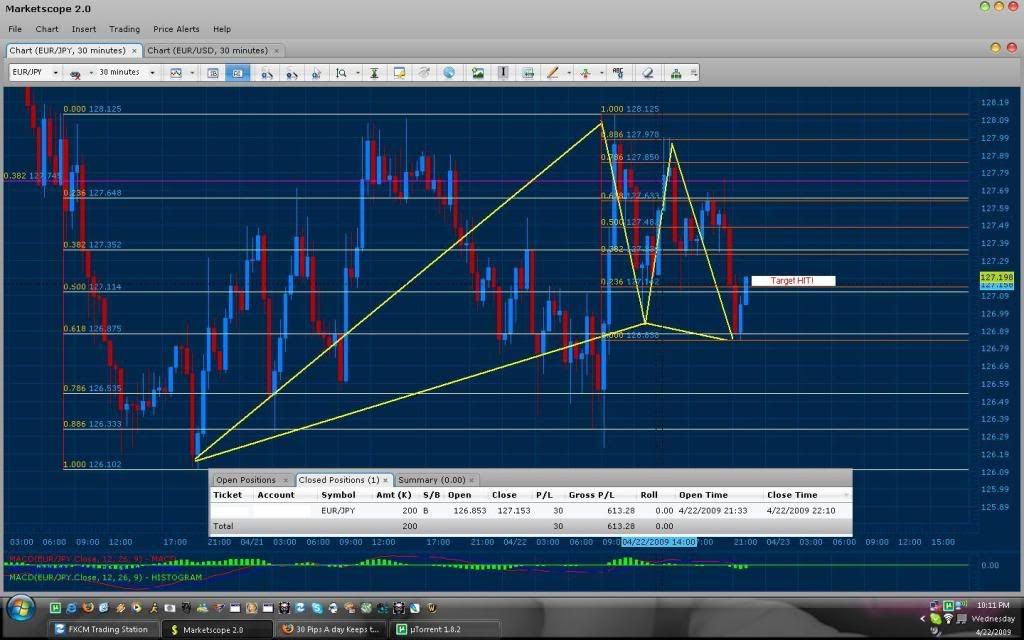
2nd chart shows it almost hit the stop, and depending on your broker and spread, it very well could have. If it did, there was a second chance to enter on that same bar that took out your stop at around the 127.80 mark. Also, it worked out and hit the profit target
I’ll have to keep a lookout for these patterns as before I thought they were too complicated, but now I guess I “see” them and they’re not so bad…lol, and the good 'ol Zig Zag indicator can help spot the swings from which to draw the fibs.
First of all since you are trading the Asian session I highly recommend that you Initiate your trades between 6pm-8:30pm est. This is because during this time the majority of the D’s for the pair are developing. Also I discourage trading between 9pm-12am est. The reason being that during this time I have personally experienced many “fake outs”. Although 9pm-12am is an excellent time to look for up coming patterns that will form around the London session.
Pattern wise, I strictly trade Butterfly and Gartley 222 patterns and I scan for just about every other pattern that is taught here on baby pips for an indication of price direction. One of the most useful patterns though to learn are the candle stick patterns. Learning these patterns will allow you to easily “read” how the market is behaving at any given time and eventually allow you to develop a “feel” for the market".
As for the stop loss… yes heh, you do not see a physical stop placed because I use a visual stop. Pleas note that the “D” I use for any given pattern must land on or near (5 pip range) a fibonacci point. If price closes above or bellow the fibonacci line then I will close my trade. I use the 30, 15, or 5 min time frame to determine the close depending on which time frame I found the pattern. If I am trading the 60-30 min I will normally wait for a 30 min close. If I am trading the 15-5 min I will wait for a 5 minute close.
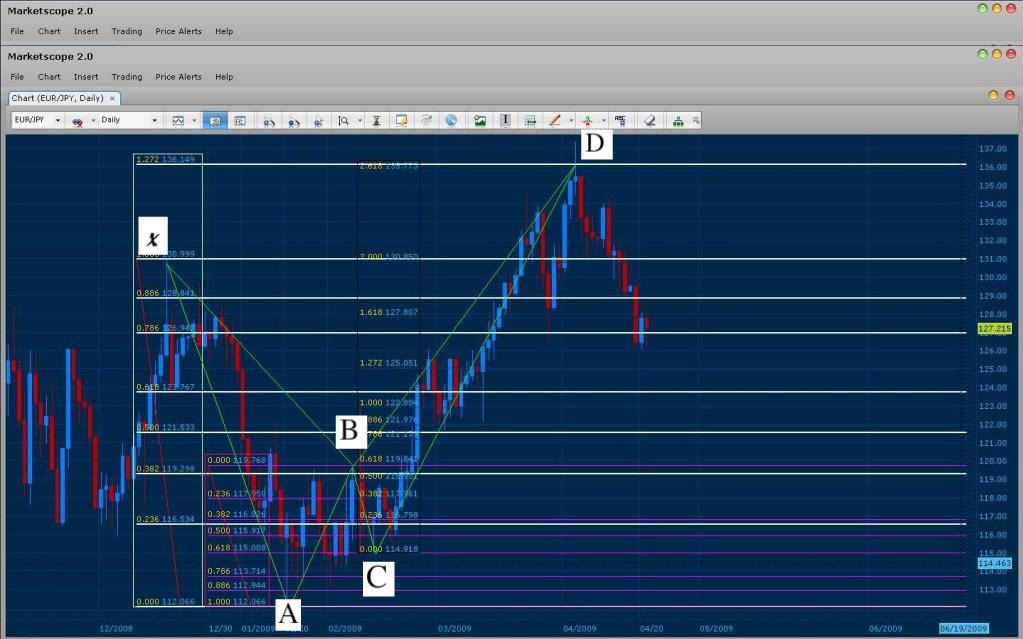
Bellow I will illustrate how I use my fibonacci tool to Identify and execute a pattern. Also, please note that the pattern bellow is of the current EUR/JPY Daily and should show you why the market is behaving the way it has been for the past month.
The white column represents X-A Fibonacci levels. These fibs will show the where possible D’s may form. X is always found at an extreme point in price. In this case we are drawing the fibs from the highest swing to the lowest swing left to right (This is done vice versa when looking for a bullish trade).
The pink column represents a possible A B leg. The fibs here are used to determine where the C point is. In this case, my B-C leg lands on a .618 level. This usually indicates that when the C-D leg is forming, D will find support or resistance when it is symmetrical to A-B. This tends to be true in the majority of Gartley 222 patterns you find.
The Black column illustrates the relationship between the AB and CD legs. I use fibonacci in this point for percentage purposes only. In other words, I draw my fibs from the tip of A to the tip of B and move the fib tool to the tip of C. This will then illustrate what is drawn in the image above and show a 0-2.618% relationship between the AB and CD legs.
Initiating a trade:
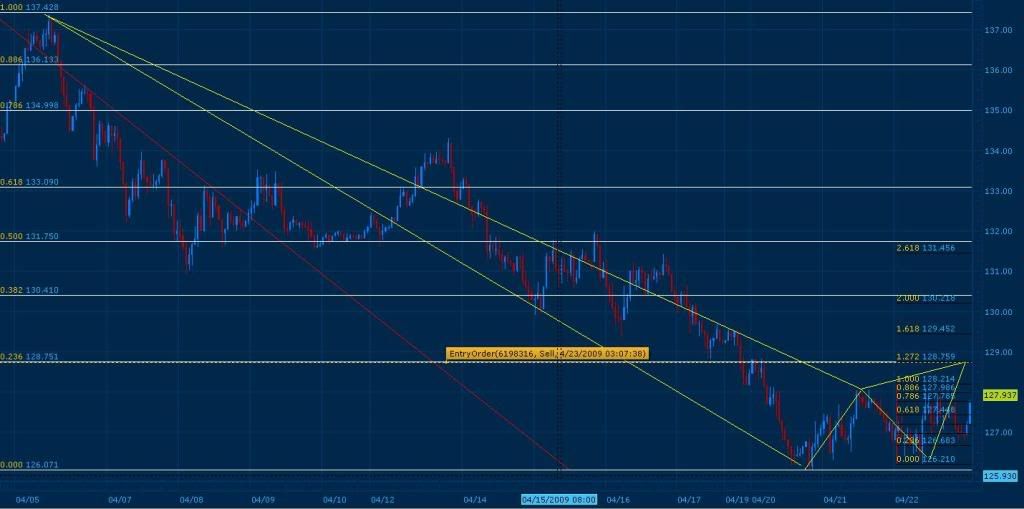
Once the chart is fully dissected, I search for convergence in the chart. Convergence is shown when The XA Fibbonacci points merge or are in close proximity to x percentage of the CD leg. In this example, the XA leg converges precisely on the 1.272 Fib of XA and the 2.618 extreme of the CD leg. As a result if you opened this chart in the beginning of April and saw this pattern forming you would have had a sell entry waiting for you right on the 1.272.
This pair usually begins to retrace when it reaches the .500 fib level. Because of this, you should keep an I on this pair when it reaches that point because their will be most likely a major “D” at that point. In addition the pattern shows the reason why the pair has been “tanking” down for the past 3 weeks giving you those beautiful bearish trades (Sorry for all of you stuck on the opposite end).
Please note that the following analysis was done on the Daily chart of the EUR/JPY. This means that you should be careful when making a bullish trade until this pattern completes. Be mindful though that these types of patterns develop in every time frame and are counter trend trades. Which is the reason why you can see that I made profit on a bullish trade in the 30 min time frame.
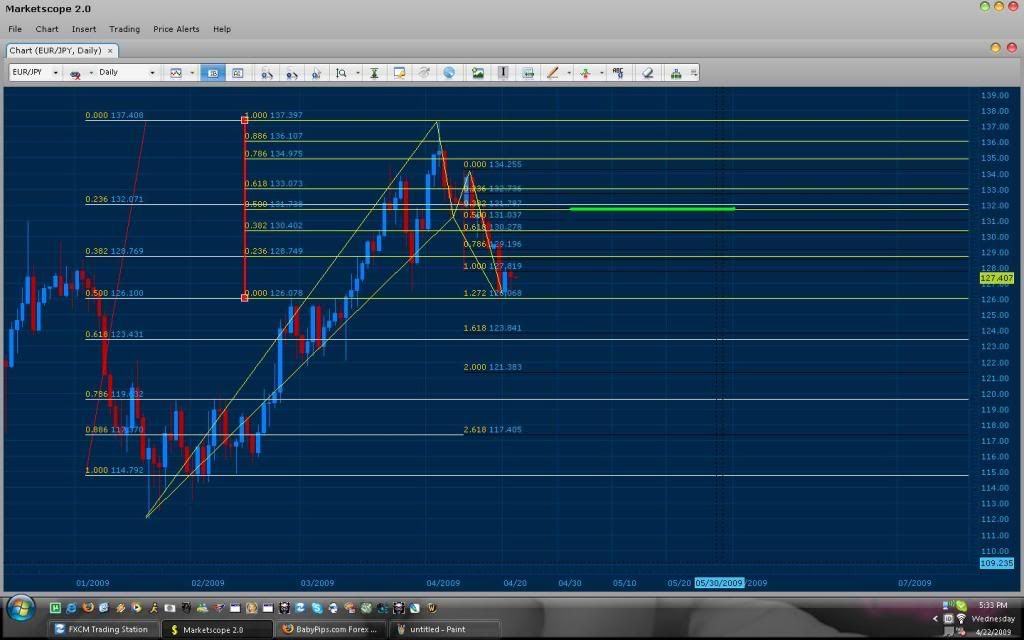
The image bellow Illustrates a current pattern on the Daily chart. The pattern bellow is a Gartely 222. In this case, the XA leg was drawn from Base to Wick and shows convergence in the 1.272% of CD. The pattern has not failed and is still valid and should reach the Green line drawn on the chart (131.738 of price). This is the reason behind why price behaved so violently in the area where I had originally purchased this morning (as shown on first post on the 30 min frame).
To any one that is Confused with the ABCD and the whole Gartley/Butterfly patterns I highly recommend reading the book “Trade what you See” by Larry Pesavento.
Note as you can see from the posts above, I can deffinately predict moves that can range from 100-500+ pip gains the reason why I have narrowed my profit down to 30 pips a day and simply increasing margin for higher proffit, is because of the fact that it eliminates the feel of greediness and gambling for me. Which is something that I believe is the downfall to any trader. When you remove emotions from your trading style you become a better trader. This is why I also recommend reading the book: “The Disciplined Trader” by Mark Douglas.
Crap…lol…6pm-8:30pm est is 3 - 5:30pm pst for me…while I’m still at work, so that’s out.
However, 9pm-12am est (which is 6-9pm pst for me) is when I have to make dinner, help kids with their homework, and have other household chores & distractions. So instead, just watching during that time will work out better with my schedule, so later when I can relax and focus, I’ll be ready for the D’s…and the family should be happy too…perfect
Heh glad that helps :). Keeping the family happy is always good for trading since it will keep your stress level lower. Also 12-2am est are nice trade times. that lead to the major trades at 3am-4am est (London Open). Also note that although I do not trade these any more… you can always do trend line breaks and use the pattern to give you a sense of direction.
Yes it sounds like a plan anyways…so thanks for that…and time will tell.
Hard part is sitting here seeing these patterns when I can’t trade…like now… then seeing nothing when I can…arrgh!
Seems to be a gartley pattern. That website I listed also has an online charting program with an ABCD drawing tool, so I just draw the ABC portion and it will calculate where D should be…handy…lol
Although the D leg didn’t quite reach the recommended 127.68 projection, it did reach the 61.8% fib of XA at 127.62…close enough? I drew in the other lines to see the shape better and it looks good…lol… so if one took a chance and shorted there at 127.62, it did drop.
If one put a target in at C, it didn’t quite make either, but it did make it to 127.31…a 31 pip less spread profit which is nice to see. And considering a stop at 127.68 for 8 pips was a nice risk/reward ratio indeed.
126.846 place an entry a few pips above it or right on that target for a Buy its 100% of an abcd Gartley I will post pic ASAP. It should be comming up soon
Edit:
Bellow is the Image of an upcoming Gartley Pattern (.618) Fib level
Hi,
Good call on that…I took it at 126.91 cause that’s when I got home…so far up 25 pips :)…target at 127.21 for 30 pips…
No, that last chart I posted was done from work :o…and unfortunately this one I only took on demo cause I’m just a little cautious when trying out something new. I still have some practising to do cause I wouldn’t have known to draw the fibs and abcd at the places you did :eek:
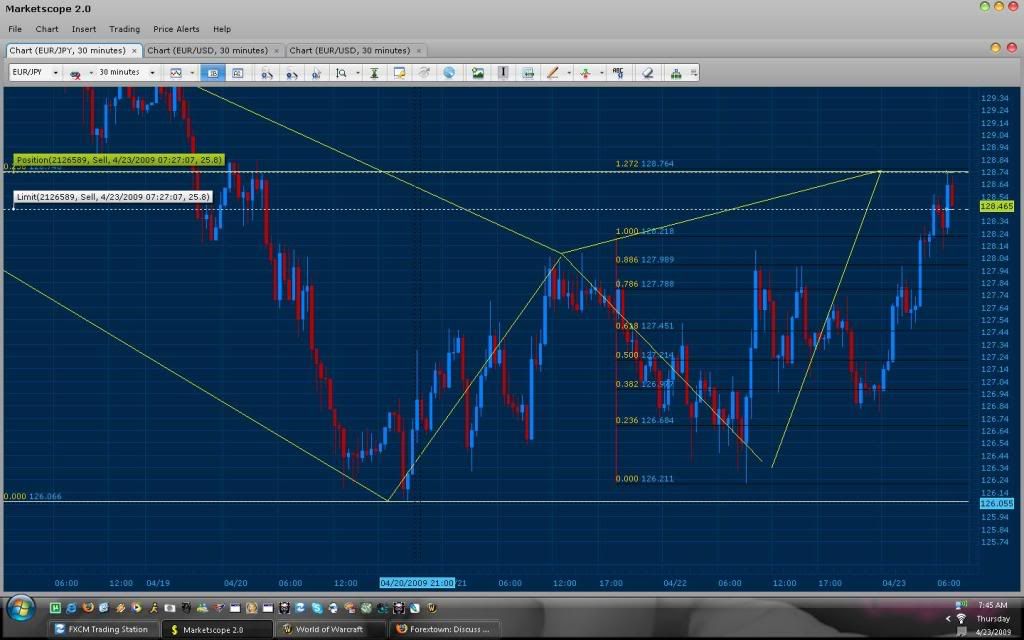
Another Success. Normally I am not scheduled to trade the Tokyo session but while taking a look at the market I could not miss this perfect 100% ABCD Gartley 222. Thank you Sweet Pip for replying at that time heh
Nice way to end the day… 30 pips in the morning, 30 pips at night 2x lots per trade thats 1200 dollars. Oh and The Heat are winning the game Good night! See you all during London and NY session.
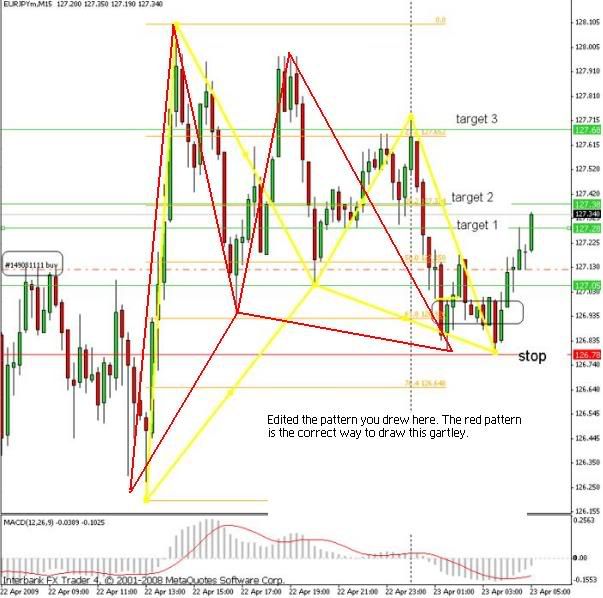
Here’s a long e/j on the m15…a bullish gartley. I missed the optimal entry area (circled) due to “distractions”…lol but took it anyway…still on demo.
I marked my original stop loss with the red line. then the entry is obvious, and a some green profit target line. IF I had entered optimally, my first target (that was reached) would have been 30 pips, but thus was only 15ish. So seeing that the macd was curving upwards, I waited it out, and not too long it hit my 2nd target for the full 30, and I see it’s still going up…
That pattern you show has been happening very frequently. To clarify, Price has been faking out the initial 100% retracement (even though you can steel 30 pips from the market) testing the bounce a second time (creating a double bottom… simply confirming the support) and give you the true retracement active time. Remember how I said this pair will fake you out around 9pm-11:30est and notice how at 11:30pm est it began to move and complete the pattern.
Also note that in the charts bellow I have shown you a daily pattern responsible for the movement upward. This is also the reason for the support in the area where you have purchased.
Identifying a Gartley and avoiding a failed pattern:
The number one rule to this is that the BC leg of the pattern must have atleast a .500 fib retracement in order for it to develop a true Gartley. This means that the BC can retrace from the .500, .618, .786, .886, 100.0 fib levels and still be considered a gartley. You will know when the true gartley is formed because of the fact that an avg of 80% of the time it will bounce (find support or resistance) when it reaches symetry with AB. As a result you will see that the 100% of CD will converge with x fib point. You see this in the last trade I made. The BC leg bounced of the .886 and its 100% completed in the proximity of the .618 of XA.
A butterfly pattern is the result of a failed Gartley. This is why a number of traders would sell a pair if it closes bellow the 100.0 fib and have an entry waiting for them at the 1.272 for a buy or vice versa. In addition, 80% of the time if BC leg reaches the .382 and retraces (without ever touching the .500), the Gartley will fail an reach the 127%. This doesn’t mean that it always has to reach the 1.272 of XA it simply states that the CD leg will retrace when cd = 127% of AD and still be considered a gartley if it hasnt passed the 1.000. Personally, these trades that do not hit the 1.272 of the XA are less symmetrical and should not be traded until you have more experience pattern trading.
Times when most D’s develop on any given pair (EST time):
6pm-8pm, 12am-3am, 5am-6am, 10am-11:30pm
Times when D’s tend to “Fake out”
9pm-11:00pm, 7am-9:30am, 2pm-4:30pm
(These times can be traded, simply note that it typically fail towards a more profound D).
This is why I normally begin to analyze the market from 2-4am and initiate my trade at 5-6am (I typically set my entry around 3am or 4am using the 30 min time frame).
-Fib levels-
The following Fib levels should be added to your Fibonacci tool:
.236 and .382
If you are using visual stops and wish to trade these pattern conservatively, I recommend that you draw your fib points from the Base price of your high low swing to the wick of the low or high swing and place a physical stop once price reaches the .236 fib level. Your limit should be a the .382 as price usually tends to test this zone before it continues towards the target or before it fails to become a bigger pattern.
.500, .618, .786, .886, 1.000
These are your major ratracement zones and are typically the “D” area of a gartley pattern. Please note that these fibs depend on the pair that you are trading. For example, the EURO/JPY, AUD/USD and the GBP/USD for the most part have major resistance at the .500. and typically if price does not respect this area for these pairs it will continue towards the extreme levels (1.272, 1.618, etc). The EURO/USD, USD/CHF, and the NZD/USD Typically retrace from the .618 (the .500 will normally allow price to “breathe” before reaching this fib). In addition, the EUR/GBP finds support or resistance at the .786 (you can draw your fibs from high to low swings in history and you will see that 9 out of 10 times it will bounce from this point or reach its vicinity before doing a true retracement).
1.272, 1.618, 2.000, 2.618
These are your extreme levels and where your butterfly patterns will form. The 1.272 will be your major retracement level. If price for example closes bellow the 1.272 (bullish trade) the pattern typically fails and retraces from the 1.618. If I want to be risky, I can trade price towards the next “target”. The close should always be the time frame where you found the pattern. The 2.000 and 2.618 are basically the most extreme zone and if price does not respect these it will typically continue the trend and not give you a retracement.
Please note that the 100-2.618% levels of CD should always be used to finding convergence with XA. You can see this on the example bellow where the 1.272% of CD finds convergence with the .500 fib level of price on the EURO/YEN. In effect indicating a D in that zone (You use convergence to identify where possible D’s will develop).
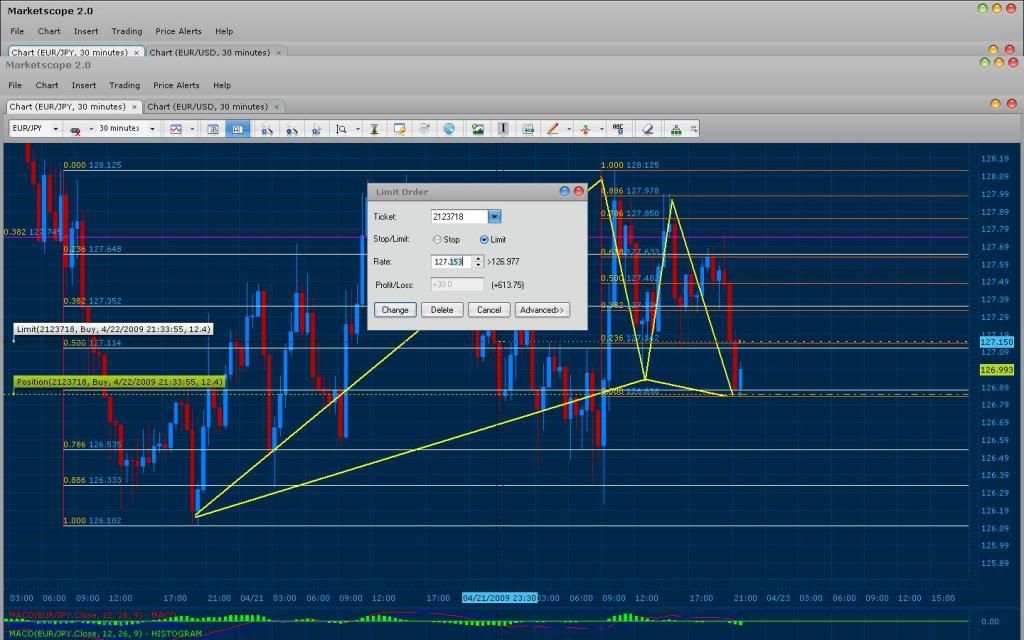
Bellow I have corrected the pattern you previously posted. Always try to take the first swing after you XA as your AB. Your AB was invalid and would have not been considered a pattern according to Gartley 222 and Butterfly rules.
Good thing I moved the entry a little bit lower heh. The entry caught the wick exactly (I moved it down because I had noticed there where about 3 other patterns “landing” at that price area).
*Remember I am only taking 30 pips from the market with all of my trades. This pattern still has the potential of reaching its .500 fib (Price = 127.404) retracement goal or atleast the .382 fib (Price = 127.720)
The triangles you see are simply an outline I draw representing a pattern that is found through the zig zags in price. These patterns are called Butterfly and Gartley 222 patterns (I draw them with trend lines ). I guess you can say its similar to the outlines of constellations in the sky.
The patterns form in every type of market since the princible behind it is that the “fear” in the market behaves in a pattern and when a butterfly or a gartley develops a turn around in the market occurs.
If you are completely new to Forex I recommend learning what is taught right here on this website thoroughly before diving into this context. If you feel that your ready to learn these powerful patterns I suggest to visit the link posted on the quote bellow:
Also pick up the Book “Trade What You See” this will drastically increase your trading and allow you to efficiently predict market movement and not simply hope that it will go in your favor.
I hope you do learn this strategy though heh… I personally have no need for indicators and the only tools I use are Fibonacci, Trend Lines, and Pattern Recognition (this includes all types of patterns). I highly stress to familiarize your self with Candle stick patterns, learning this will allow you to literally read a chart and remove the need of indicators (they are helpful though to begin with).
Also please note that these patterns are an extension of the ABCD pattern (the base of this form of trading).


 Good night! See you all during London and NY session.
 ). I guess you can say its similar to the outlines of constellations in the sky.