If you take closer look at the image with the bullish gartley, you will notice that I have a trend line crossing with 261% CD before hitting the .382. Because of this, I placed the order exactly on the 261% CD instead of in between the convergence or on top of the .382 itself as I would normally do. In addition If you where to use the curve of the MVA for X which lands at 117.940 instead of at the wick of price, you will note that the .382 converges exactly with the 261% CD.
I’m done trading for today… 55 pips is enough  I’m leaving to eat some sushi heh, please feel free to post any questions and I will respond when I return.
Well done TMB. Rookie Mistake… If i had have looked at your chart without having tunnel vision (in excitement to draw the pattern and trade it) i’d have noticed not only your convergence with the 20 MVA, but also your entry order!!! Silly me!
As for trend lines, I cant recall them being mentioned before, care to share? or point me to somewhere in the 700 odd pages i can find it for myself?
Thanks again!
PS. When i master this technique and travel europe again, I owe you drinks, lots of drinks!!!
First of all thank you TMoneyBags for a great thread. Thank you very much that you take your time to share your knowledge with us.
This is the kind of trading i want to adopt and use in my future trading. I bought the book “Trade what you see” that you recommended and i’m 75% through it. I’m working my way through this thread but still have many posts left to read. I just have two quick question. If you look at my screenshot above i’ve drawn the pattern from the same points as you. But i have a hard time to see any convergence between the 261% CD and 0.382 XA since the distance between them is 15 pips. Am i doing something wrong or is it because i use MetaTrader? My broker is markets.com btw.
In the book the author says that B has to be at least a 0.382 retracement of XA to be a valid gartley. Is that correct?
Sorry if these questions allready have been asked earlier. If they are answered earlier in this thread just tell me, i’ll read all posts and not ask anymore until i’ve read them all. 
Edit: Ah, there i got the answer, right in front of me.
“In addition If you where to use the curve of the MVA for X which lands at 117.940 instead of at the wick of price, you will note that the .382 converges exactly with the 261% CD.”
How often do you use the MA instead of the wick of price?
@TMB
first of, what is the purple dotted line on your chart?
secondly, your approach to harmonics is quite different, from what i’ve seen on other forums and read in books.
do you have any sources which explains this in details or is it self-taught?
and if you see any patterns setting up, please post it, my self and many others would appreciate it greatly.
thanks.
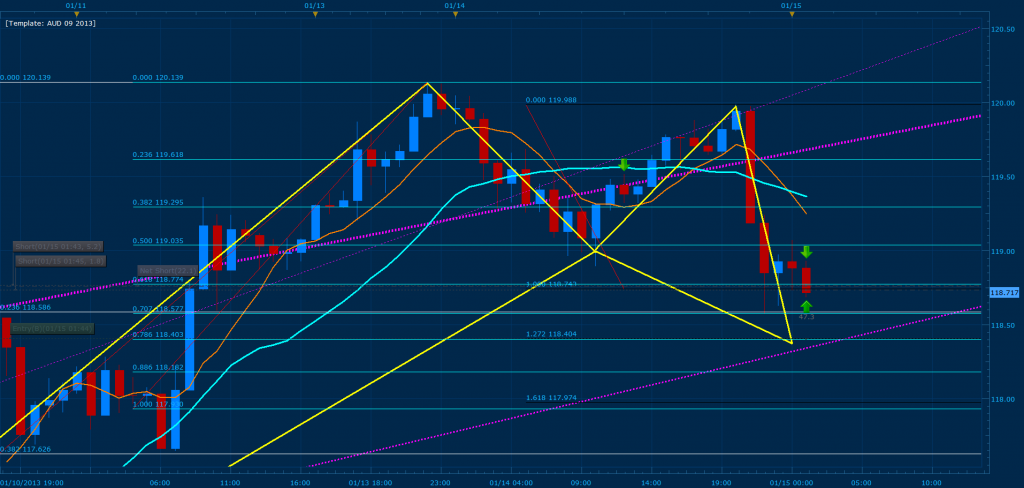
I love the phrase a picture is worth a thousand words… but without clarification all those words simply become questions. As a result, I will illustrate and elaborate on what that purple trend line in today’s trade was and why I applied it to our harmonics technique.
First of all there are two very basic tools in trading that are generally overlooked but are extremely powerful when combined with other tools… TREND LINES & CANDLE STICK PATTERNS
*** The purple trendline from today’s trade is now YELLOW***
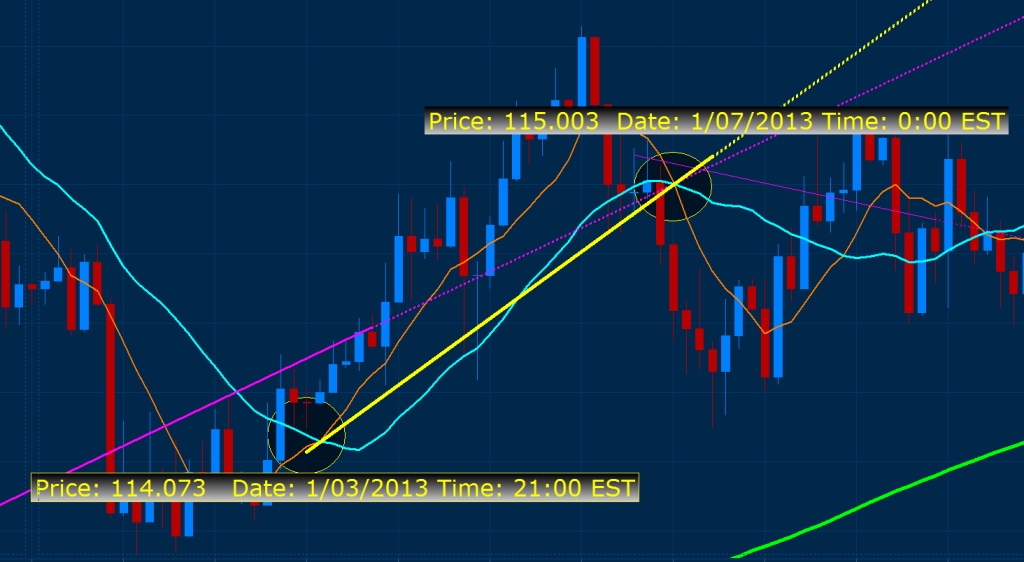
Here you will note that the trend line comes from plotting the crosses of the MVA on the 1 hour chart (EUR/JPY); the text in the image are instructions for drawing the line in your own chart. In effect instead of drawing from low to low or high to high, I’m drawing my trend line from the lowest cross to the highest cross of the MVA’s which now gives me an “average” of that legs movement (similar to placing a horizontal line on the base of price).
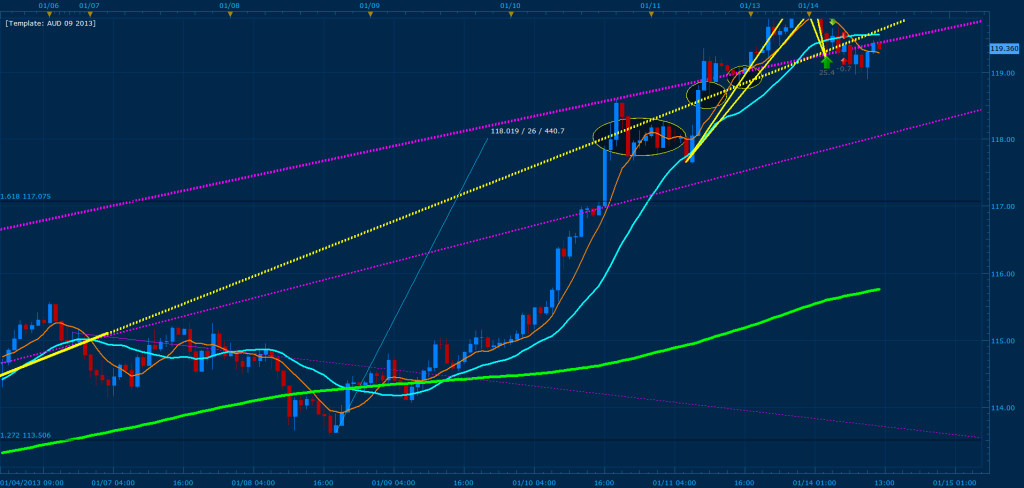
After a 440+ pip uptrend, price begins to finally consolidate and slow down after hitting the trend line.
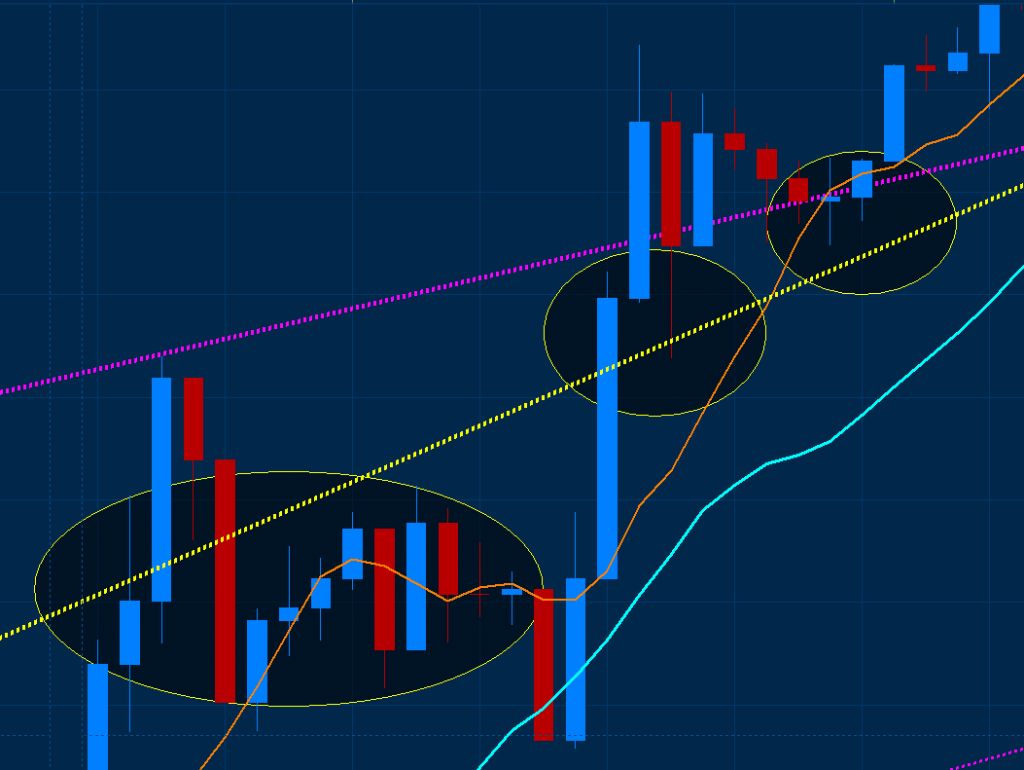
The yellow ellipses illustrate how price respects the trend line even after breaking it. This tells me that it has strength and that any major candle stick pattern that develops on it or harmonic pattern which lands on it should be noted. The price action in the two small ellipses are proof of this since price then moved 130+ pips up after giving bullish signals.
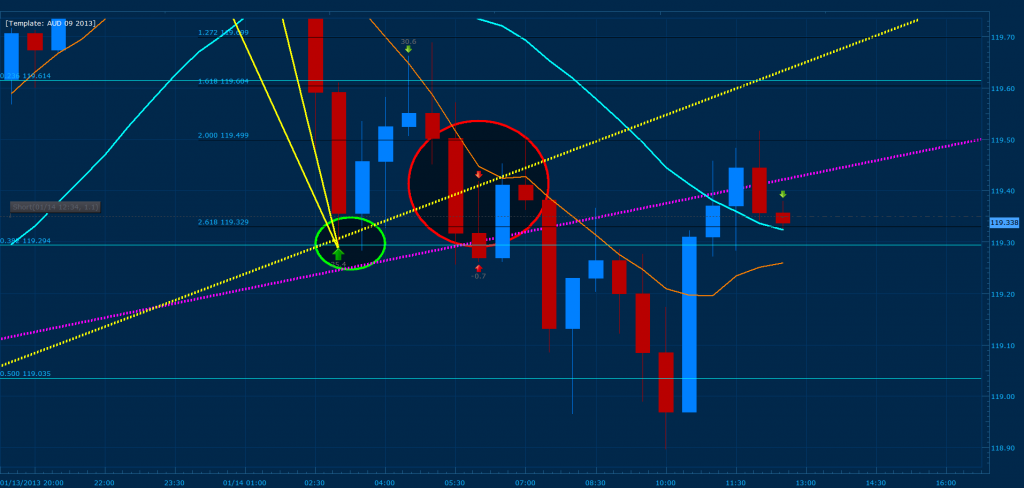
This is where the bullish gartley develops on the extreme of 261%CD converging with the .382 of XA. The green ellipse shows you where the trend line crosses with the convergence and why I decided to leave my entry exactly on that point. As I have stated many times in previous posts, when a trend line crosses with a fib point (especially a convergence point with CD) price will move significantly from that point and it is the best way to “pin point” the correct convergence point for your trades. The red ellipse illustrates the break of the trend line and “disrespect” of the bearish gartley which has now caused the market to push towards the bearish side.
*Please not that the purple line on these images comes from an 8 hour MVA cross using the same concept and which is why you may note that price respects that line better then the one we have just analyzed.
Q). jeppe:
…your approach to harmonics is quite different, from what i’ve seen on other forums and read in books. do you have any sources which explains this in details or is it self-taught?..
A). Larry Pesavento is my mentors mentor lol… and the majority of my knowledge in trading has come from him drilling in my head the courses in the baby pips school, Larry’s “Trade What You See” book, “The Disciplined Trader” - Mark Douglas, and EXPERIENCE from trading real accounts and competing with other traders while in the learning process. In addition, I am the type of person that always wants to know the reason behind things and if I can make them better… which is why certain techniques that I use you will seldom, if at all see anywhere else.
Q). Diablo 1505:
How often do you use the MA instead of the wick of price?
A). In the early threads I’ve stated that you should check if the market you are trading respects fibs best from wick to wick or from base price to wick; while experimenting with the MVA’s I’ve noticed that the extreme curve of the 8 MVA turns out to be the base price of the candles on higher time frames.
Q). DJHenry 1981:
As for trend lines, I cant recall them being mentioned before, care to share? or point me to somewhere in the 700 odd pages i can find it for myself
?
A). If you would like to learn more apart from what I have stated above or simply review my previous posts on the subjects with ease (there should be many of them) simply use the advance search on this thread and look for all the posts created by me. Then press ctrl+f and search through the page for trendline or trend line.
Thank you for the detailed answer. Now it all makes perfectly sense.
Very interesting. In all the material i’ve studied i haven’t seen anyone using trend in combination with MA crossings like you do. I like it and will explore it more, thanks once again.
To clarify. If i understand you right you use 8 MA and 20 MA?! Simple or exponential MA’s?
Looking forward to see your next trade setup! :35:

Thanks TMB, your post clears things up a bit.
Found a trade (I think)… thoughts, criticism, death threats?
Well the trade worked, sort of. It crashed at 100% of CD rather than the 1.272% level where i set the trade and i missed out.
If I moved X to the 8 MVA, i’d have picked the correct convergence… doh!
I hope you took that trade lol… I left mine running for the night and booked 50 pips just now (you can see the entry on the fourth photo from yesterdays QA) and the true entry as you have shown it 100% CD worked out perfectly.
Missed it  See above

No point crying over missed opportunities…
Think i’ve found another. WHen i move X to the MVA it gives the same convergence…
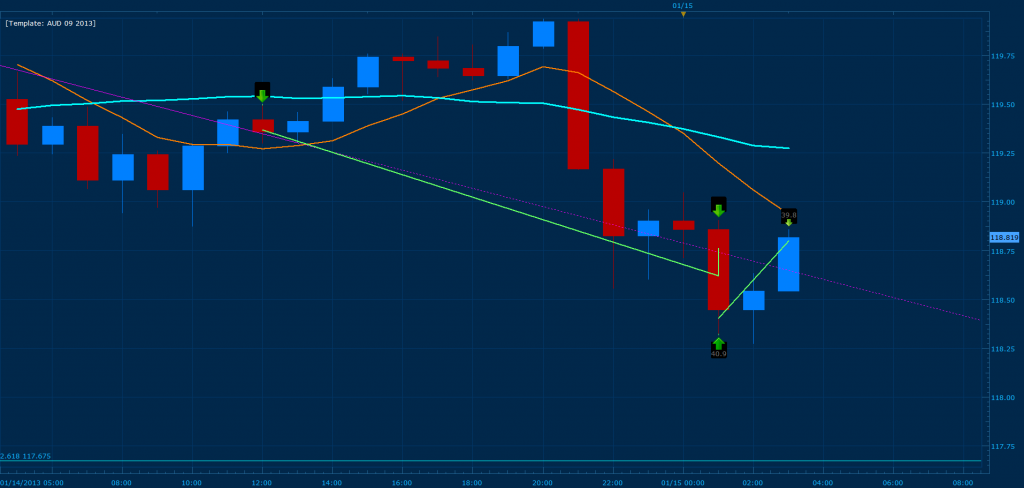
The flag for the bearish continuation has broken on the EUR/JPY after violating the 100% CD on the 5 minute chart. AS a result, I am selling C to D towards 118.404 where I have my bullish entry waiting for the gartley where the 127% CD converges with the .786 of the most recent XA. If this current convergence zone where to break, I see price free falling towards the 261% of CD at 116.729.
I see my error, using Wick to Wick, i didnt see the convergence at that line, only the one below, when i used MVA for X the convergence appears.
If i’m not mistaken that was another 30 pips to TMB. I am in awe of your knack for these patterns, well done! I got 25 pips, i got in a little late and moved SL to BE when it should have been a few points lower as per your assumed entry, thus i reentered. The two bullish pins were a great sign!
Thank you
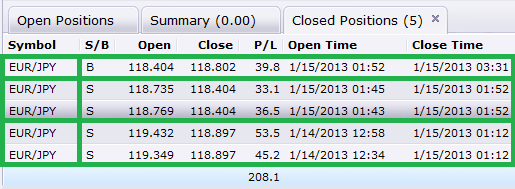
The three rows represent three trades I took from yesterdays market close until now (in pip value). From top to bottom the first row is profit from the bullish gartley, second row was trading C to D and the third row was the overnight trade.
Happy trading 
PS.: Please keep in mind that the marabuzo that developed on the four hour yesterday at 21:00 EST is a sign of Yen strength and should be monitored closely. To clarify, this development after a huge uptrend is the first signs that the market is looking to “correct” the bullish move and test the major levels its broken. As a result, expect price to either consolidate in the current area or continue to pull back 50-80% of the previous bearish bar to prepare for the bearish continuation. Again as I stated before, if price breaks 118.404 then we should expect it to reach 116.729. In other words if you are going to continue trading this pair today, be mindful that we are now in a 159 pip range (consider the marabuzo and the current hammer developing on the four hour as the length of the range) and you should keep your entries at the tops/bottoms of it for secure profits and exits.
Yeah, congratulations for another good trade!
I have to agree with djhenry. Your understanding of these patterns and price movement is really impressive! You’re really close to getting a forex-/gartley-guru if you’re not allready there of course! 
I seem to have some difficulties seeing the same as you though. I’m drawing them exactly as shown in your post but i get different results (hard to spot any convergence of fib levels) even if i try to draw from base of price, MA or wick to wick. I need to figure out why. Maybe it is because of the MT4 platform not able to switch between BID and ASK price.
I would like to show you some examples of what i mean by posting screenshots. Am at work atm though so i have to do it later.
open a demo account with fxcm so you can use market scope 2.0 and execute your orders on mt4.
Ok, thanks Tmoney. Looks like i need to buy a pc after all since i only have a mac at home running mt4 on a crossover program. Well well, a good investment into my future business i guess.