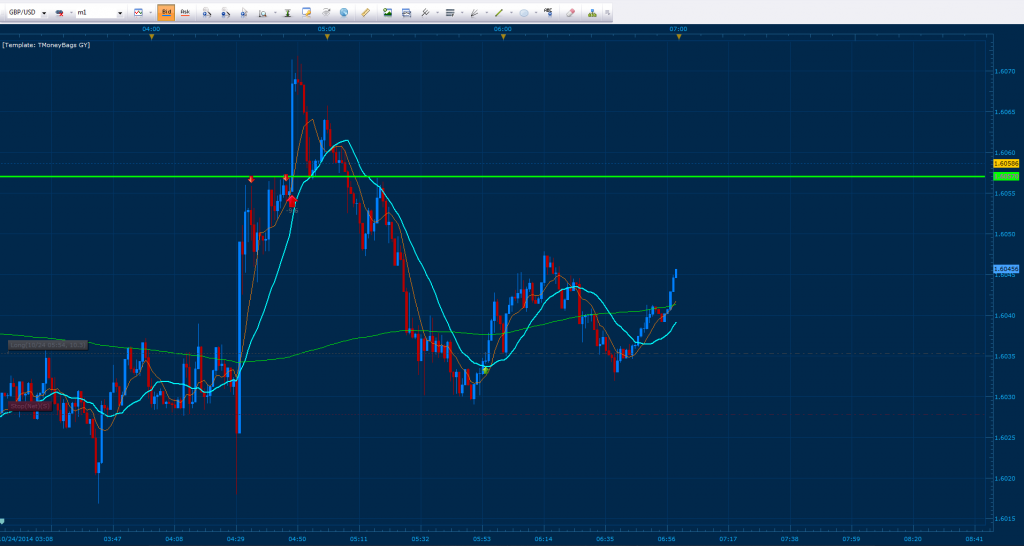
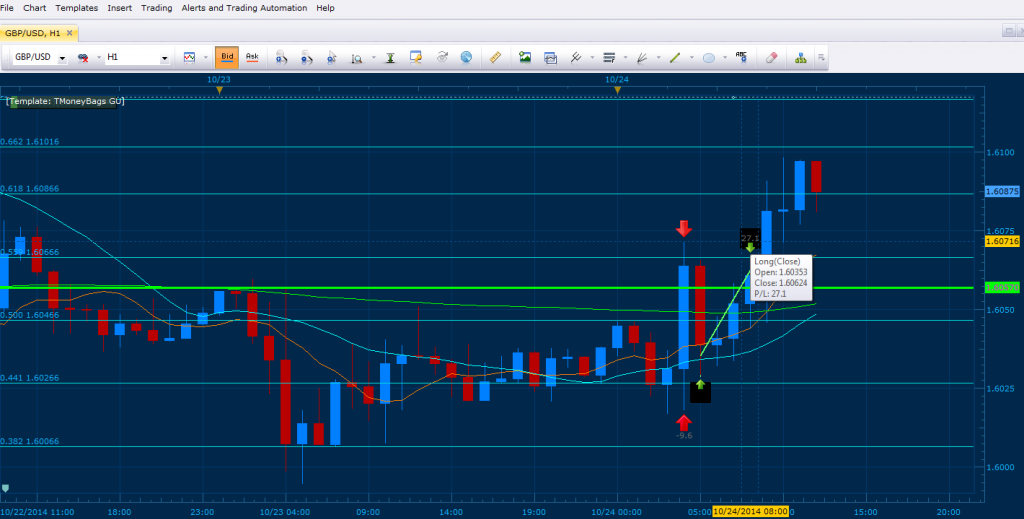
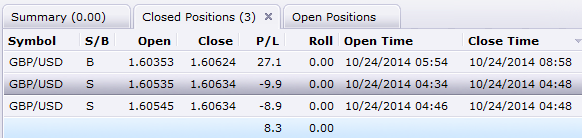
Here we have an active trade on the GBP/USD based on price action within the lower time frames and a reaction of an MSRT on the hourly chart. Notice how initially we where in for the short towards this area and where stopped out for 9.6 pips (giving us a clear signal for GBP strength towards our new projection).
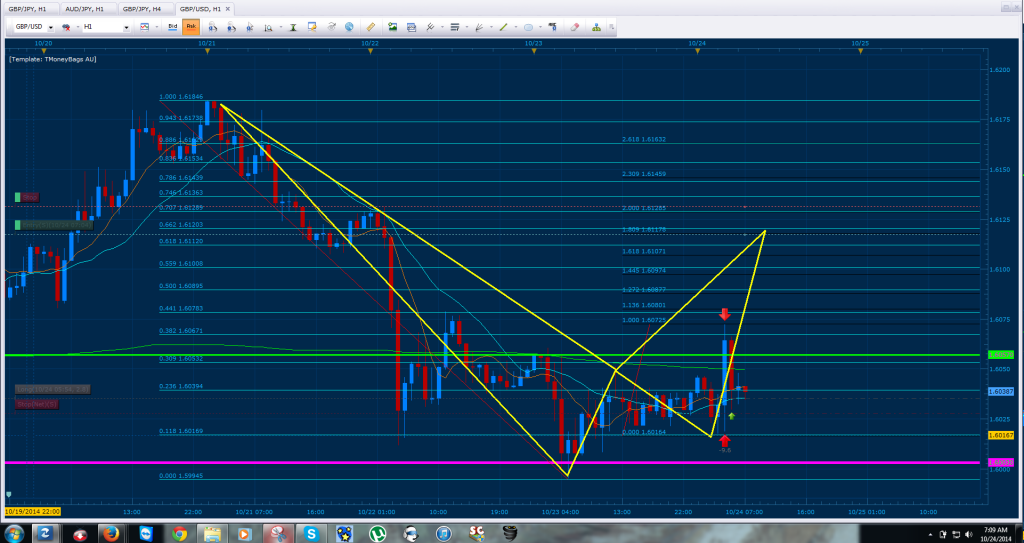
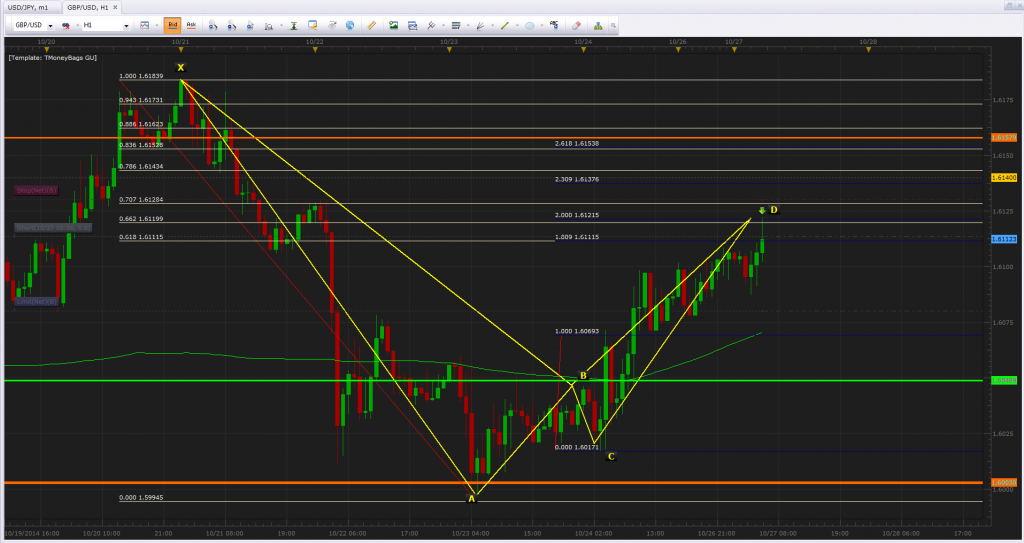
Bellow is the Gartley pattern that is developing for the GBP/USD on the 1 hour chart, where 180.9% CD converges with the .662 of XA. As a result, we will be taking our active trade towards this point since it is also the break of a flag formed after completing a bullish D point (pink horizontal line).
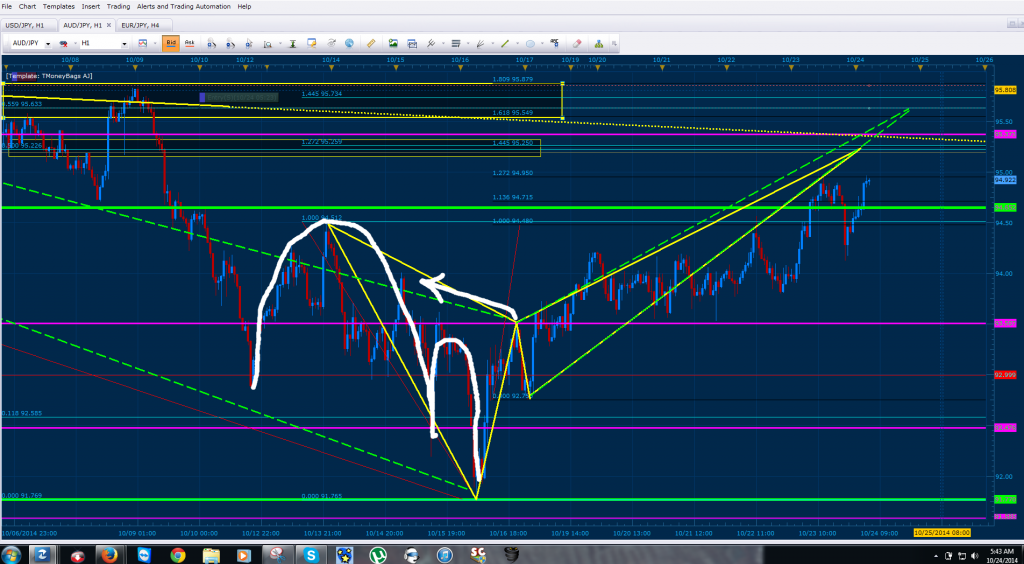
I’ve illustrated above in white how I read the swings you mention (remember that the green lines go towards the most extreme X and the yellow butterflies X is at the most Recent extreme point).
photobucket is down atm. i can’t see the images. although i did get a quick peak at them earlier. but atm i can’t see anything as photobucket appears to be down. what a shame. price is stalling at the price point you mentioned and i would love to open a sell order, but i feel this would be foolish of me without analyzing the charts myself.
actually having plotted the AUD/JPY on my chart now, i can see that the price is still a bit below the final D point [good job i just didn’t jump in and sell lol]
having reviewed the chart and taken into consideration the other JPY pairs i do think there is a decent chance that price will react off TMB’s projected D point. I am wondering though why TMB your stop loss on this trade is tight and it is not a visual stop loss like you usually use? is there any particular reason for this?
and is the target pips for this trade the 38.2% of AD or 30 pips?
Good morning, our GBP/USD entry was just triggered recently where the .618 of XA converges with 180.9 CD. In addition, the .662 of XA converges with the 200% of CD. our physical stop is above the 200% CD and a visual close above or on this converges constitutes an exit. Our target is shy the .382 of AD and the projection is towards C for a retest of this zone before continuation (remember the bullish D point we’ve been waiting for? This is the entry towards that zone).
Here is a trade I am currently in on the GBP/CAD. the pink trendlines represent fibs drawn from the daily. although it is hard to see the 100% AB projection converges with the 50% of XA on the white fibs. in addition the 50% of the daily [purple fibs], is virtually in the same position as the 50% from the normal white fibs.
how did you know it would not reach your target and to scalp for 16 pips instead???
on the GBP/CAD i got taken out for break even. price came back up. I am annoyed. but then i remind myself it’s better to be taken out for break even than for a loss.
I notice GBP/CAD is RIDDLED with gartleys all suggesting price is heading upwards. there are so many it makes finding a legitamate D point challenging.
Had a short signal for the USD/JPY and AUD/JPY indicating dollar weakness while price action on the gbp/usd showed hints of respecting the previous support (gbp and aud pairs tend to follow each other and usd/jpy is a good signal for dollar weakness or strength).
had a look at GBP/USD and again, i find it RIDDLED with gartleys in a similar fashion to GBP/CAD,
here is a screenshot i took. it’s already extremely difficult to read because of all the fibs, so i have not drawn in the many many gartleys. but the most secure D point looks to be the 78.6% [red fib], i shall be shorting there.
ps: there are still a few fib points left out on my fib tool. seeing as the 70.7 is not a conventional fib number i can’t help but wonder if the introduction of the 66.2 may be a bit overkill. i mean where will it stop lol
i should probably review the rest of the fibs and add them in though. i’ll probably get round to it eventually. i want to see a few more examples of them in action first.
I expect you’ve probably analyzed the GBP/USD already, but if it keeps going up, i do feel the 78.6% [red fib on my chart] looks like a very good place to short for around 30 pips. [tbh, it should probably yield more]
edit: price might not make it upto that D point though, so i guess i should atleast consider taking one of the ones before it.
took this trade today. eventually ended up manually closing for around an 11 pip loss.
AUD was strong, probably the strongest currency today, and i knew it was strong. i knew it was stronger than the JPY …and i should not have taken that D point …not a 55.9 fib, it’s too weak…
.95831 is the physical stop for that pattern, and it has nothing to do with weakness of the new fib I added. Like I said, some markets respect them some do not and If I’m using it here its because it works. As for trusting your initial intuition in the AUD being strong… that’s an excellent signal from your “inner-self” letting you know what you must do; always trust your instincts and do not trade if you are feeling conflict within.
the fat lady has sung and it’s past the failure point now. but i dunno. i get the feeling it might come right back down within a couple of days. i think it could get as high as .96200 possibly then come down. or perhaps come down before that.
i hope i am right. my predictions are becoming more accurate.
I find the AUD and NZD pairs as the hardest to predict a reversal for, in the end it’s best to find patterns that go with a pull back on a trend when trading these ;). EXPERIENCE…
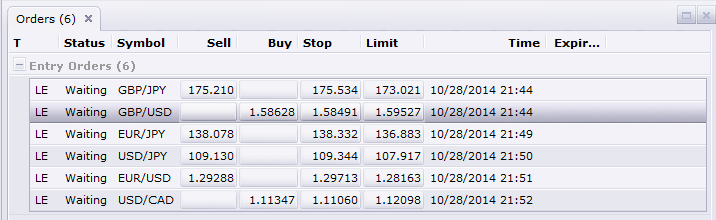
Anyways, bellow we have a list of our pending entry orders on 6 different markets. I will go in depth with each of these signals once I’m up for London open, good night.
my forcast for aud/jpy is based on a new technique i have developed. I combined 3 pieces of knowledge to come up with the technique. it’s still early stages and needs more testing. but if it proves to be accurate then i shall share it with you.
i had a look at your entries just there and for about half of them i can see the reason why you have placed a D at those points.
i need to leave the house right, so i’ll have to make this brief. but your GBP/JPY entry is where the 344.5 extreme converges with a fib point [i think you posted this one]
your EUR/JPY entry is where the 55.9 of XA converges with an AB projection
your USD/JPY entry is near to the 78.6% XA, and a AB projection lands there. your entry seems ever so slightly above it tbh, i wonder if you’ve noticed another pattern there too?