Our bearish USD/JPY trade has triggered, Ill post the full details once I’m in my office.

LOL so funny:35::35::35:
you guys really think you invented the hot water here…
try this brand new fib i just made out…its very strong and you can use it to trade your full account size with one trade…it has such strength that you need no stop to trade it…the new lvl is 0.123456789…OMG that lvl…its so strong man. you can do chinups…keep up the good counter trading…
lol wrong…your trade is NOT in a middle of a range…funny how ppl dont know market structure and try to trade…your entry is perfect SELL…did you get confused and pressed buy instead of sell?..hmmm happens all the time
I am most curious as to why your entry is 109.130 because it is above the 78.6%, and it had perfect convergence with the 127.2% too…
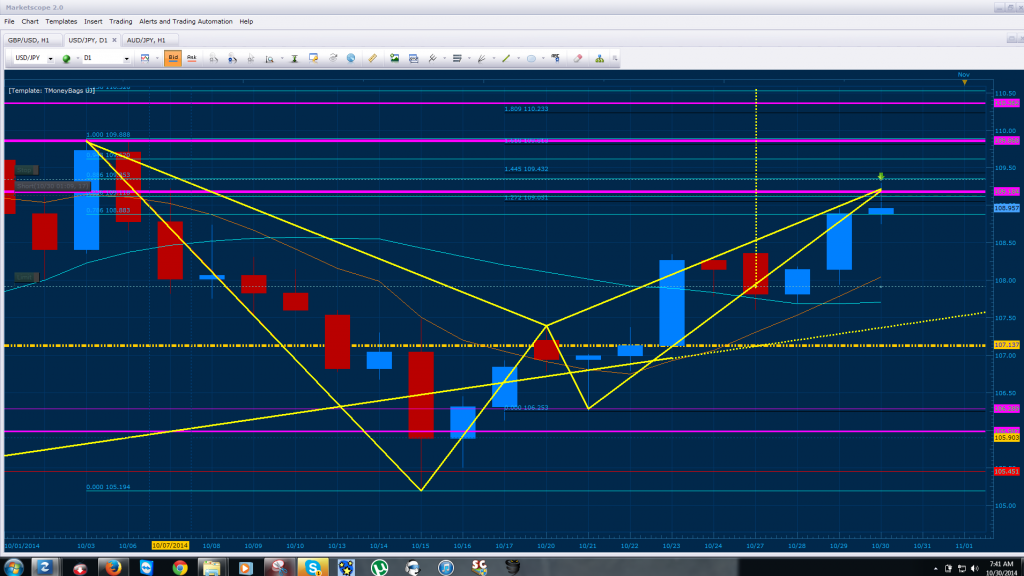
Good Morning, we have a bearish Gartley that has developed on the USD/JPY Daily chart where the 127% CD converges with the .836 of XA (note that my X is coming from 109.888). We are using stop from refined through the hourly time frame (price 109.344).
Our target is shy the .382 of AD and the projection is towards the Golden horizontal line at 107.137. If the trade fails, we see the market pushing towards 110.362
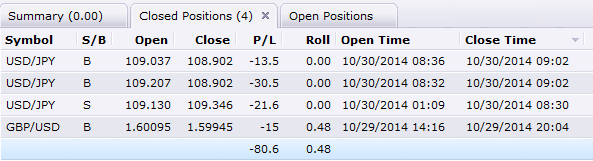
Our stop has been hit and positions on the pair reversed, our target is 109.860
Loss for the day, will live to trade tomorrow  have a good afternoon.
yes. it is great. we can make rich with stable profit. i think all of you can test this strategy.
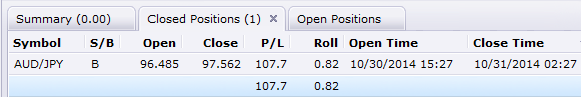
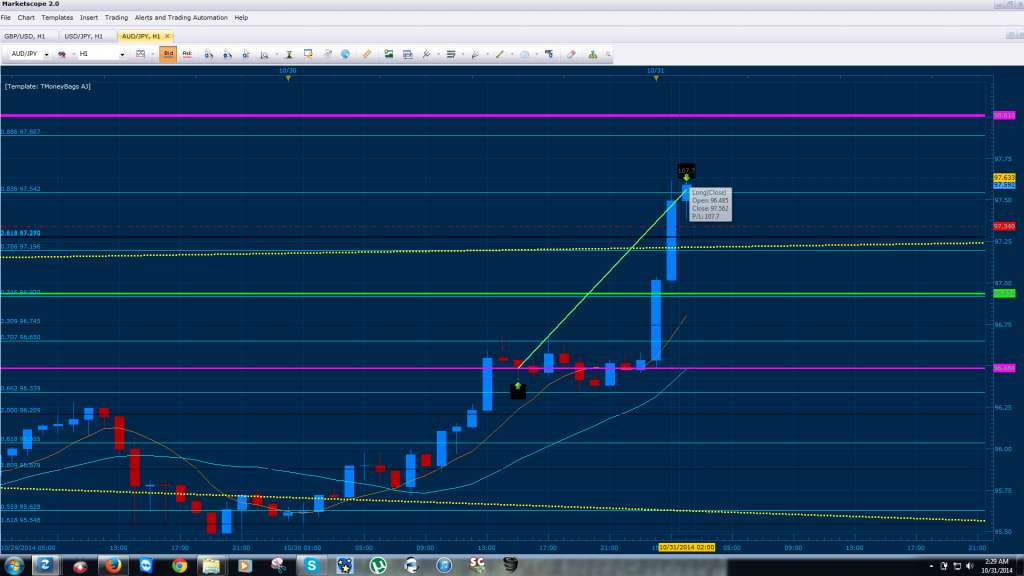
After closing out for the day negative I decided to clear my mind and leave scanning the charts for missed opportunities throughout the afternoon. After scanning the charts an opportunity presented itself on the AUD/JPY around 3pm est where price had broken an MSRT on the 4 hour and retested the horizontal point at 96.48 of price (pink horizontal). Our targeted projection after this break is the MSRT at 98.010, allowing us to scalp 107 pips (35 pips before the MSRT).
Because of the volatility presented today, I expect his zone to break and reach the 99.013-98.712 range before triggering a proper D point. Notice that I have a thick black line under the dashed red horizontal line at 97.340 of price. This represents the broken 261% CD that converged with another extension fib projection within our toolbox.
Will keep you posted if we find any developing patterns (we will most likely stay away from the yen today and focus on the majors).
where the 113.6 CD and 66.25 XA sorta converge?
will you be opening a sell there?
Long EUR/GBP Entry .78569 stop .78490; will post analysis shortly
First, please note that our physical stop has been adjusted to 0.78369 (sorry for the inconvenience).
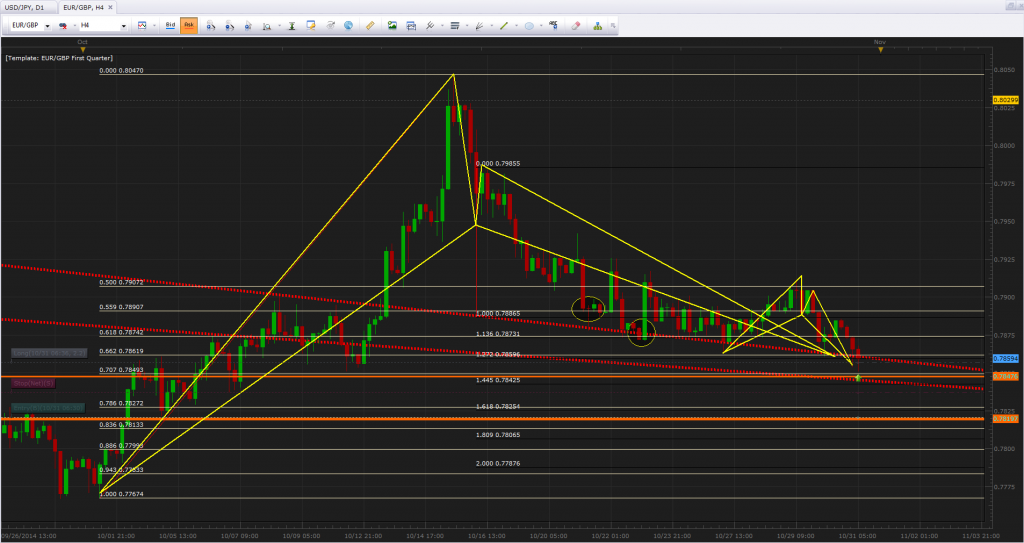
Bellow we have a Butterfly pattern that has formed on the EUR/GBP hourly chart where the 1.136 of XA converges with 200% CD. Notice how the 3 previous hourly bars wicked from this convergence giving us the confirmation for the long with the fourth retest. Also, their is a horizontal MSRT (orange .78476) and a diagonal MSRT (Red) converging with this zone; our physical stop is an offset of the orange MSRT.
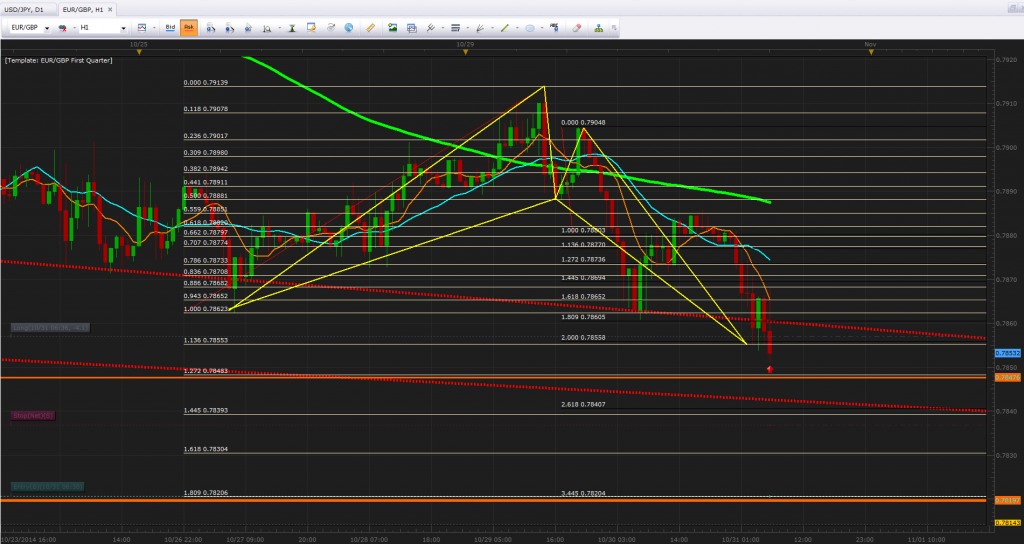
In addition to the above butterfly, we have a bullish Gartley that has formed on the H4 chart. Where the .662 of XA converges with 127% CD. Now that we are zoomed out, the MSRT relation to the fib point and the reason for its current strength during the retest is clear. To clarify, I’ve circled two previous D points with these fibs that has worked (100% CD converging with .559 XA and 113.6 CD converging with the .618 of XA). The fact that a Butterfly on the hourly has formed within this zone is simply added weight to this convergence.
im baffled to be honest.
there are higher places than the D point where the fibs converge [which you never traded], and also lower places on the chart where the fibs converge. how you are picking which D point to trade completely escapes me.
maybe im best off sticking to the old fibs. i got what you were doing there
If you read through my early posts on the thread, I also used a trend line crossing with the fibs as my favored point of entry… that’s all I’m doing here; With the exception of adding horizontal MSRT convergence in addition to the diagonal trendlines.
BTW entered AUD/JPY pullback, Long towards 98.966 where our short entry waits.
EUR/GBP hit our stop for 20 pips:

In addition, we scalped the AUD/JPY pull back for a 15.5pip avg (double lots when compared to EG

do you still use sweet pips strength table when considering which D point to go for?
I am using her indicator she made for mt4 and i cannot help but notice that the D points which you seem to be loosing seem to be when the currency strength is not in your favor, eg: on the recent EUR/GBP trade the GBP strength was a few point stronger than your EUR and since you were looking for a buy [weakening of the GBP] the strength was not in your favor
on the USD/CAD buy trade you won recently, i was not at the computer at the time but a couple of hours later when i returned i looked at the stretgh table and the USD was 2 points stronger than the CAD which was in your favour. i think it was probably like that at the time you took the trade too.
on my winning trades and loosing trades i too have notice that there seems to be a correlation between D’s succeeding and how strong the two currencies are
here is a recent screenshot from GBP/CAD
i have drawn in a trendline. i notice it crosses a fib point convergance. price seems to have gone back down. is this a good example of the way you select D points for these new fibs
bigger pic: http://i.imgur.com/ogL78Rp.png

Thank you for reminding me of this, I’ll use her strength table once more and see how it relates to the system I have in place
Hi,
There might be huge butterfly forming in USD/CAD H4.
PRZ has three fibolevel cofluence, there is structure and also psychological level 1.1 vs. 1.0999…
Have a look in your own charting program and give me your opinion.

(daily chart for better overview)
edit:
Another one for next week: EUR/USD H4 Bullish Grab
(two images)

and daily for prz

One quick one: USD/JPY M5 Bullis Bat

1st one. too early to be naming it as a potential pattern imo. there isn’t even a candle formed after your C yet.
2nd one. what fibs are you using? traditional fibs or TMB’s added fibs. if using traditional fibs and looking for convergance then there is no, or very very poor convergence around the crab fib [161.8], unless you are seeing a msrt line or something similar which is making you think that level is a valid reversal point?
if you are using TMB’s new fibs, then the 180.9% does fall sorta close to the crab level. personally i probably wont trade it , but that me…
3rd one. again, far too early to be calling it a pattern. the C is barely there yet and the CD leg has hardly retraced at all. wait till it comes further closer to B before classing it as an upcoming pattern. also when trading small patterns like this, you really need to have at the D point either trendlines/msrt lines or a major fib point coming from a higher time frame or it is likely the pattern will fail more often than it succeeds …