EUR/CAD hit our target and banks + 384 pips for January, see chart, now looking for a sell.
Notice the White Star 
Philtheforex
EUR/CAD hit our target and banks + 384 pips for January, see chart, now looking for a sell.
Notice the White Star
Philtheforex
EUR/CAD was in a strong and consistent uptrend during the recent months that buyers were successful in achieving the highest price of 1.55813.Price is going toward the support level of 1.52000 (the important psychic level of Sellers) and there is not any clear reason of buy signal in long term time frames such as Weekly and daily.
Right now in Daily and 4H time frames price is under 5-day moving average which shows consistent descending trend. According to the formed movements in the previous week, there is a Spining Top candlestick pattern which shows indecision marker for ascending or descending and there is a warning for stopping of more descending.
RSI indicator in weekly time frame is in saturation Buy area(also divergence mode in Daily time frame) that confirms the current Top price and warns about changing price direction. Generally until the price level of 1.55813 is preserved, price will have the potential for reformation and descending.
As it was mentioned in the previous analysis of this currency pair dated 27.03.2014, according to the technical formed signs there was the possibility of the price descend which finally happened.Sellers were successful in reaching to the lowest price of 1.48314 and after that the price has started to increase. The price by reaching to the Up Trendline (made of 4 bottom prices) which is drawn in the picture below could not pass the supportive level and by forming the bottom price of 1.48314(Hammer Pattern) provides a field for price reformation. Right now price is over 5-day moving average in daily and 4H time frames and warns about more ascend.
As it is obvious in the picture below, between the Top price of 1.55842 and the bottom price of 1.48314 there is none-ideal AB=CD harmonic pattern with the Fibonacci ratios of 50 and 127.2 (also Butterfly harmonic pattern) that warns about ascending of the price.RSI indicator is in saturation sell area that confirms the current harmonic pattern with the next cycle but because of non-compliance and coordination with larger time frames(such as weekly and monthly), this signal is not much valid. Generally according to the formed signs in daily time frame, until the bottom price of 1.48314 is preserved, the price has the potential for reformation.
[B]
Technical Analysis of EUR/CAD dated of 2014.05.21[/B]

Anyone else think there’s a head-and-shoulders pattern emerging here, from January 14 through to the present day?
With the ECB press conference in two weeks and with easing measures expected to be announced by this usually-hawkish central bank, the fundamentals to me suggest that there is scope for downside to the Euro.
Personally, I live in the peripheral Eurozone. With it’s stagnating economy and high unemployment, I see that one of the main locations people are moving to is Canada in search of work.
I’ll also let you in on a little secret: The European Parliament elections are on this Friday, and incumbent government parties are expected to face heavy losses due to the unpopular austerity measures that they are taking to stabilise public finances. In Greece, the anti-bailout SYRIZA party is expected to take the most seats, and is a party which has campaigned for default on Greece’s huge debt burden. If there is a large enough vote for these types of parties this weekend then this could reignite fears of Eurozone sovereign debt crisis, and send the Euro spiralling downwards.
The interest rate differential is also set to widen in CAD’s favour in two weeks time if the ECB does in fact ease, something that is probably priced into markets already in the short term but this may help develop a trend. If the Euro refi rate falls to 10 basis points as it is expected to, then the Euro will likely become as cheap to borrow in as Japanese Yen, and this may influence a carry trade benefiting higher yielding currencies (CAD = 100 basis points currently). Additional easing measures such as the ECB purchasing government or corporate bonds would also drive down yields and would be bearish for the Euro.
I have gone short EUR/CAD @ 1.4920, with a stop @ 1.5120, and a primary target of 1.4720. I will adjust my stop loss to break-even if the pair breaks the previous low of 1.4831.
What are your thoughts on this? Especially on the potential head-and-shoulders pattern?
Seems to me the head and shoulders pattern already played out and may be looking to pull back, but that depends on how you draw the neckline. Either way, I also share your short bias on this pair mostly because of easing expectations from the ECB next month. At the end of the day, ECB is still way more likely to ease compared to the BOC. Just my two pips!
This was a good call 
Technical analysis of EUR/CAD dated 16.03.2015
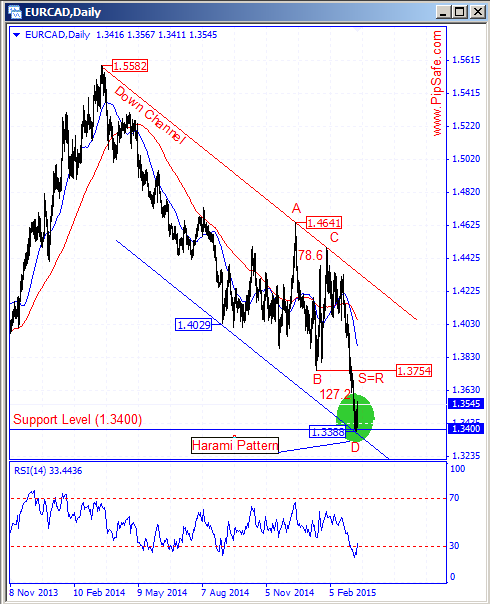
EUR/CAD was in a strong and consistent downtrend during the recent days that Sellers were successful in obtaining the lowest price of 1.3388.Price has been stopped from more descending with reaching to the supportive edge of Down channel technical pattern and also the supportive round level of 1.3400 (Sellers use this lever to exit their trades) and starts to ascend.
As it is obvious in the picture below, between the top price of 1.4641 and bottom price of 1.3388 there is AB=CD harmonic pattern with ratios of 78.6 and 127.2 that warns the potential of ascending from the D point of this pattern.RSI indicator in Daily time frame is in saturation sell area and with the next cycle warns about ascending of price during the next candles.Generally according to the current situation, until the bottom price of 1.3388 is preserved, there is the potential for ascending of price and reformation of descending trend.
Good bounce on the EURCAD from the 1.3600. The level has become a good resistance. Now the 1.3500 may become support again.