Coming above the 200-day moving average and into new 100-day highs, the AUDNZD pair may have broken the downward trend from the March 2011 high. Failing in March 2014 to trade below the January low, higher highs and higher lows have it now over 700 pips above that low and just 385 pips from the 2013-OCT-28 high, a break of which would confirm the end of the downward trend.
Bouncing above the 2014-JUN-04 high and breaking into a new 3-day high, I took a long position from 1.1016 on 9/25 with my stop just below the 9/22 low (the then 3-day low). Since then I have trailed that stop up the 3-day low to 1.1061 to lock in 45 pips of profit.
Thoughts? Is it time to go long AUD/NZD? May the forex gods sanctify thy account.
Congrats on your win so far! I myself have missed that opportunity to buy on the pullback since I was going for a more conservative entry at 1.0900. Fundamentals seem to favor further gains for the pair now, especially since the RBNZ just confirmed that they intervened in the market last August. A break past those recent highs around 1.1300 could indicate that there’s further upside for this one.
If it breaks a fresh 3-day low before the 7-day low moves above my entry, I’ll take profit and wait flat for the next break higher to go back in long. But if it continues upward from here I will hold this long until a fresh break of a 7-day low.
Locking 95 pips, my stop is just below the 10/2 low (the current 3-day low). If I am stopped out I will book those profits and wait for the next break of the 3-day high. If she goes higher from here I will ride the wave.
May the spirit of JP Morgan be upon you my fellow capitalist pigs.
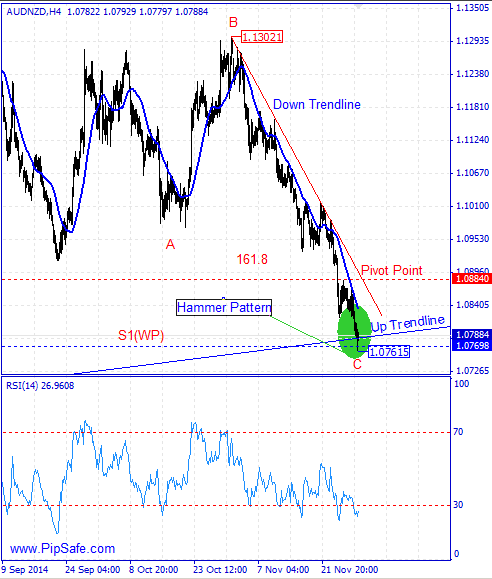
AUD/NZD from the top price of 1.13021 was in a strong descending trend without reformation that could record the bottom price of 1.07615.As it is obvious in the picture below, price during the descending has touched the Up Trendline (made of 3 bottom prices) and also the s1(pw)of 1.07685 and has created the hammer candlestick pattern. Closing of the bullish candle after this pattern will confirm it and warns about ascending of price.According the general ascending trend and not observing a clear technical reason for ascending of price in long term time frames such as monthly and weekly, if the price level of 1.07615 breaks, the price will have the potential of reaching to the support range in this currency pair.
s2(wp)1.06988
s3(wp)1.05781
obvious in the picture below, between the bottom price of 1.07615 and the top price of 1.13021 there is ABC harmonic pattern with the ratio 161.8 that by completing the end point of this pattern, there will be a warning for forming of a bottom price.Generally the first sign for ascending of the price is formation of a bottom price and recording of it in daily time frame.
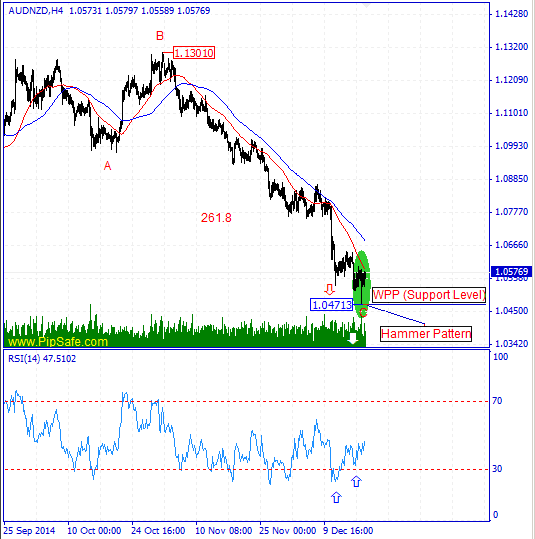
AUD/NZD during the recent weeks was in a strong and consistent downtrend that Sellers were successful in achieving the lowest price of 1.04713.Price has been stopped from more descend by reaching to the specified support levels(261.8 and WPP) in the picture below and with exit of some Sellers from their trades, the ideal Hammer (H4) and Spinning Top candlestick(Daily) patterns have been created. These candles shows vulnerability and indecision market in ascending or descending of price that for confirmation it needs closing of a bullish candle.
As it is obvious in the picture below, between the top price of 1.13010 and bottom price of 10.4713 there is ABC harmonic pattern with ratio of 261.8 that warns the potential of ascending from the C point of this pattern.RSI indicator is in saturation sell area in daily(also h4) time frame and in divergence mode with the price chart that warns about changing price direction during the next days. The first important warning for ascending of price is breaking of the 1.05998 resistance level(the highest level of price changes in previous day).
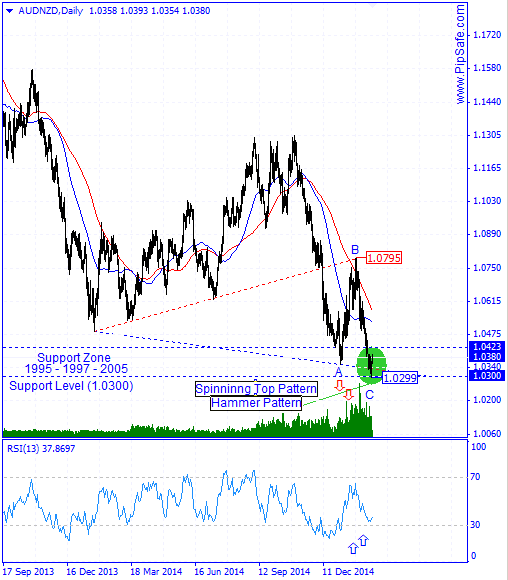
AUD/NZD since 2011 was in a long term and strong downtrend which is currently among the lowest prices. Sellers could achieve the lowest price of 1.0299 during this downtrend.Right now price has been stopped by reaching to the round level of 1.0300 and supportive levels’ range (made of 3 bottom prices dated back to 1995) and by making a bottom price had a little ascend.
formation of hammer candlestick pattern on 19th day in daily time frame, there is a warning for the first failure of sellers in achieving lower prices and formation of a bottom price for increasing of the price in this area.RSI indicator in Daily time frame is in saturation sell area and also in divergence mode with the price chart which confirms the bottom price of 1.0299 and warns about changing price direction.Generally according to the formed signs in price chart until the bottom price of 1.0299 is preserved, price will have the potential for ascending and reformation.
After this pair failed to stay over the MDMA in November, I went short on the Dec 10 break to a new low and took profit on that trade on Jan 05 on accident. I moved my stop closer than I had intended and got out with 189.9 pips in profit. Then, I went short again on Feb 04 with the break to a new 10-day low and I am in that short now. My stop will drop to break-even next week.
Currently at Century lows, short is where I want to stay on this pair.
May you all enjoy profound profits and bounteous beer.
The weekly hammer is indicated by the green arrow. Unless we see a new four week high in today’s session (which would require a 285 pip bounce), we will close this week out with the four week high dropping 455 pips since that week. In those eight weeks since, five weeks have posted fresh lows. I am still hanging in there, looking for a four week high. If the ten week high gets below my entry before my trade closes out, I’ll use that as my stop instead.
I read about candlestick reading and tried to back test it, but I can’t ever seem to get anywhere with that. I seem to have the most success looking at price ranges and following longer term trends.
Here on H4 it made afalse bearish break out of a range (1,014 -1,022), then re-entered violently inside, testes the resistance at 1,022, rejected it and it now drifting mildly back to the range support at 1,014. As this bearish consolidation towards the range support is very gentle, and as the two lst bullish moves have been very solid, I rather see the pressure upwards and will enter should I get a signal on the retest of the range support. I am expecting the resistance at 1,022 to be broken and the pair to retest 1,03 1,035. Of course I need a signal and an entry to get in first.