Randy Candles

I’m sharing a strategy that I’ve been working on for the last three weeks. It’s actually not a new strategy but rather somewhat of an old one. Credit for inventing the strategy goes to an enigmatic user known as Golden Equity. Although he shared the details of the strategy on a couple of other forums, it has never been exhaustively detailed here.

I wanted to share what I had learned and what I’ve been using in the hopes that others may contribute their observations. I’ve never before shared a strategy in a thread of my own since joining Babypips, so you can imagine that this is a matter of particular interest to me.

[B]Randy Candles[/B]

Chart Setup:

TF - Any, but the most popular are 15m and 5m, with some even using 1m.

Indicators - Although many have tried adding in numerous indicators to act as additional filters (mostly with little or no benefit, in my opinion), the basic Randy Candle setup is simple. One must use Heikin Ashi candles along with 2 Simple Moving Averages – a 25-period SMA (often referred to as the “D” line) and a 3-period SMA. The original strategy also detailed a 7-period SMA but this is not necessarily used to open trades but rather to determine whether a “fan” pattern has occurred or is emerging. All MAs are taken from Closing price.

GE mentioned shifting all SMAs as follows: 25 SMA, shift 5; 3 SMA, shift 3; 7 SMA, shift 5. The purpose of the shift is purportedly to better see the upcoming direction, but I doubt whether the shift is integral to the success of the system.

[B]Theory:[/B]

Heikin Ashi candles can indicate the start of a trend at its earliest point by observation of an indecision candle followed by a strong movement candle. Ordinarily, simply taking a trade off an HA color change or any candle following an indecision candle can be problematic without some kind of filter indicating a new trend is underway or that a present trend is continuing following a retracement. That is the purpose of the SMAs. Additionally, some have reported using stochastics, including multi-timeframe stochs (get to that later).

Here is a chart example of what HA indecision candles look like:

The first rule is to look for one of these candles. They are hereafter referred to as Signal or Alert candles. Following a Signal candle, one then looks for a thicker-bodied HA candle with a noticeable wick in the direction of the desired trade. This is your Entry candle and upon its Close your order should then be placed.

[B]Rules:[/B]

The Alert candle –

  1. The appearance of an Alert Candle is your FILTER.
  2. Correct alert candles simply have stems ABOVE AND BELOW; they are small to moderate in size.
  3. The BEST alert candles will CROSS and close OVER the 3 SMA.
  4. The alert candle is NOT the entry candle! DO NOT ENTER on an alert candle.
  5. If you enter on an alert candle, you have failed.

The Entry Candle – You must WATCH the entry candle develop to make your decision.

  1. The Entry Candle must obviously have the right HA color for your direction.
  2. It must have the correct stem color for your direction…wait till you get it!
  3. The “preferred” entry candle should only have the stem going your way (not an absolute rule, however).
  4. The BEST entry candles are birthed having ALREADY crossed the 3 SMA.
  5. If the above scenario has happened and you are let’s say at the top of a fan you ALREADY have a 90% probability of putting in a correct entry of both timing and direction.
  6. The SMAs are treated as dynamic points of support and resistance. Dynamic means they move, as opposed to static like Fibos. Support and Resistance means your trades can respect and bounce from them and at other times must “chew” through them. This Price vs. SMA interaction occurs on both the 5M as well as the 15M charts. 3 is the weakest, 25 the strongest. Learn by watching Price vs. the SMAs.

Here is a chart example of a successful Randy Candle trade:

[B]WARNING: SMA Line Arguments[/B]

An SMA Line Argument is when the price is consolidating.
The 3 SMA and 25 SMA start merging and weaving together.
Usually the candles get smaller and color combinations are mixed.
Don’t trade going into one…they can last for hours.

You are looking for a bounce off the 25 SMA or a successful cross of it. You look for your alert candle followed by the entry candle moving away from the D line with the correct HA and stem color for your direction.

In a strong trend, the candles will start respecting the 3 SMA. The best moves will ride above this line.

Exits are a little more complex. I can talk about them later.

Hopes this helps somebody sharpen your entries… You now have a high probability entry signal generated right from the current price action. Probability is all you can expect. It is a discretionary trade method of entry and needs to be tempered with everything else you know about the market.

I’ll cover more in subsequent posts.


John (Merchantprince)

“Nobody can be exactly like me. Even I have trouble doing it.”

Heikin Ashi candles are included with the Trading Station II platform I use with my broker. For Metatrader 4, you’ll need to install them as a custom indicator. Download the attachment below.

I’m also attaching more documents I’ve dug up on this system in the hopes they may be of interest to others. As the inventor of the system does not frequent forums very much at all over the years some of this meager information has been repeated in more than one document.

Heiken Ashi.zip (1.12 KB)

Arnies_Hole-in-One_TS.pdf (743 KB)

RANDY CANDLES METHOD.pdf (240 KB)

Good luck John !

i`ll be watching the developing of your thread.
maybe i can help in time …:slight_smile:

i will watch it closly too… will backtest it in 4h and dailly charts today.

it may get some good entrys for mmtt inded;)

Rui, we were always looking for that definitive moment when price moved outside the channel and turned back inward for good. Maybe something like this could do it?

On what timeframe did you test this strategy?

where do we get the heikin ashi candle?

I have been practicing with the 5m and 15m charts across six currency pairs, EUR/USD, GBP/USD, AUD/USD, USD/JPY, EUR/JPY and GBP/JPY.

There have been users who claim Randycandles also work on the 1m charts but I’ve only tried once or twice.

Mario, I’ve attached the HA candle indicator for MT4 to my post above. :cool:

curiosity…

why are they called Randy Candles?

In honor of the great Randy Quaid of course!

Actually, Golden Equitys real name is Randy and thus they got that nickname.

I am going to post a successful randy candle trade tonight, along with an explanation for how I have been taking my exits.

yeah, I looked it up on google and found references to golden equity aka Randy,

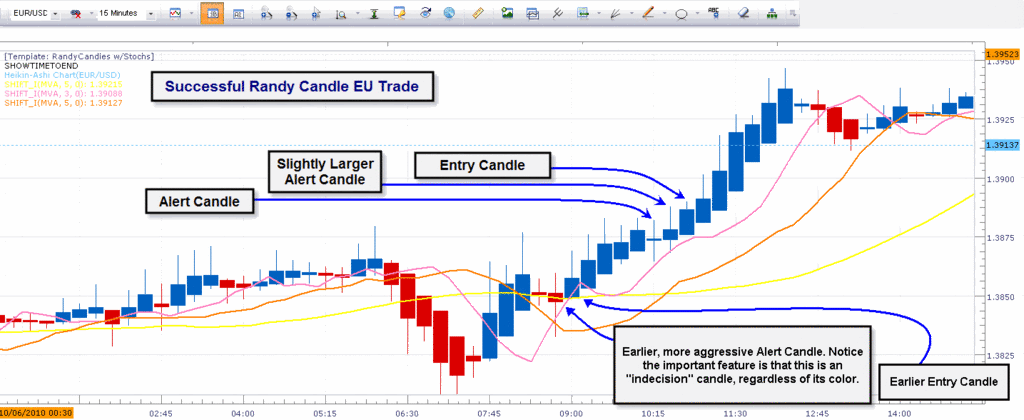
Wanted to share an example of a winning trade I made earlier today using Randy Candles as my signal. I could have entered earlier with a more aggressive trade but wimped out. The trade I did open is actually more strictly adherent to the rules for RCs.

Here’s a screenshot of EUR/USD 15m chart:

I entered at the close of the 10:45 EST (14:45 GMT) candle, the first full body candle to follow one (then a second, sometimes this happens) indecision candles.

Had I chosen to be aggressive, I could have entered based on the earlier alert candle 8 candles back (actually opening the trade on the entry candle seven candles back). I would have doubled my pips total, but the 3 SMA had just barely crossed the 25 SMA and it could have resulted in a loss had price just twisted around in a line argument followed by a subsequent bearish drop.

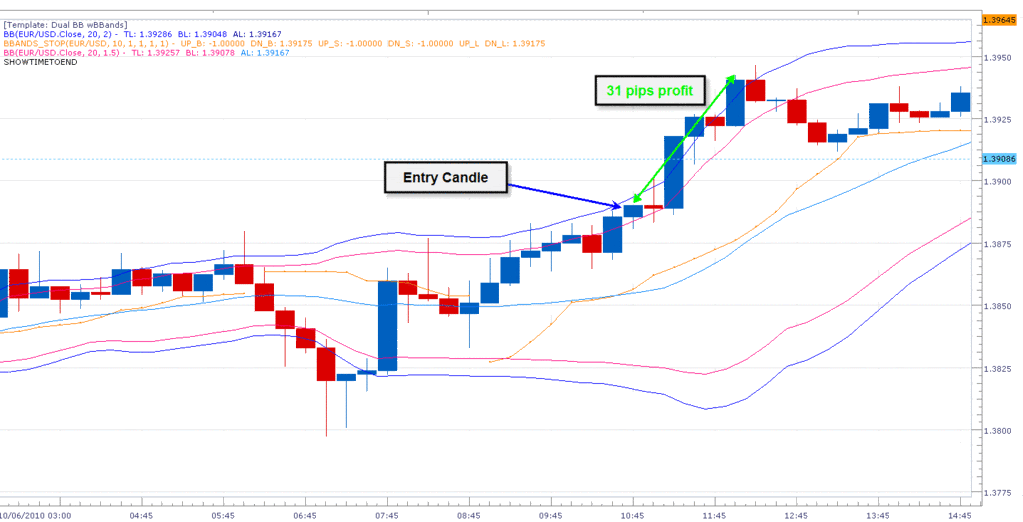
In any case, to give you an idea of what this trade looked like on a standard candle chart, see below:

I closed this trade for +32 pips based on stochastics. I’ll explain why I did so first with a passage I’ve paraphrased from one of the documents compiled on Randy Candles (Arnie’s Hole-in-One):

Finally, one of the issues with trading off the Heikin Ashi candle chart is knowing when to exit. This is the hardest part of any system. It’s definitely the hardest part to teach. After you watch the charts and get a feel for the system you will also get a feel for when to exit.

Randy Candles off a 5m or 15m chart is basically a day trade scalping system so we are looking for profit from 20-50 pips. Anything positive is always good so don’t hold on to a trade that starts to move against you. You can use a fairly tight stop because the entry signals for this system are excellent.

For me, I look at several different things to determine exit points. I use a combination of the following:

[ul]
[li]If the 14, 3, 3 stochastics are moving back from oversold or overbought after crossing into them, I take that as a possible signal to exit.[/li][li]If price is near a fib number or a support/resistance line and I have gotten some profit.[/li][li]If the candles are starting to get smaller or turn color.[/li][li]If price is getting close to the 25 SMA after being above or below for several bars.[/li][li]If price is breaking back across the 7 SMA.[/li][/ul]
So, with that in mind, here is my randy candle chart setup with a 14,3,3 stochastic plotted:

Notice the 12:15 EST (16:15 GMT) candle is the first candle to close with the stochs showing a downward crossover from an oversold area. This is usually the sign the trend has begun to lose steam.

Now view a standard candle chart showing that very same timeframe (and the candles that followed):

Price did indeed peter out (although the overall trend of EU remained bullish, you might have stayed in the trade – if you were so inclined to attempt holding the position overnight, hoping for more profits).

In addition to the Heikin Ashi custom indicator for MT4 users, I’ve also added two Randy Candles PDF documents I’d previously found to the second post in this thread.

Thanks. But i dont understand. whats the difference between HA and Randy candles. Ive downloaded the HA but its different candles in your examples.

Trading “Randy Candles” is the same as trading normal Hekin Ashi candles, but with the SMAs acting as filter. Otherwise, they are the same indicator.

Ive downloaded the HA but its different candles in your examples.

Yeah, HA candles in MT4 are different than in my platform, they have different colors for wicks and candle backgrounds. You can take the HA indi and thicken the bodies so they look more like the HA candles in my platform, but most randy candle traders seem to prefer having the different color wicks. Check either of the PDFs I have attached to my second post for more detail.

Very interesting John. I’ve always seen Randy candles around (FF forums is where I saw it I believe)

I’m a 4hr chart trader usually but I’m looking into shorter time frames, I’ll let you know how my experience goes with these.

Well, I have to say that I was also checking this out on the past week’s charts on the 4H TFs, myself. It looked very promising on that TF, as well. :cool:

Thanks so much for posting this. :smiley: