Been away for most of the this week, and have had some catching up to do on the posts, good job on the info sharing.
Two things I’d like to add my voice to:
My thoughts on GBPCHF pins:
Apart from helping me read the PA story, these pins do not say “trade me!” to me.
And if something looks suspect, I stand by and watch price unfold; there is no obligation to trade.
On H4, the last of the pins is formed at a level relevant to H4 (IMHO). But still the price story does not look right (compare with last 1-2-3 just to the left on H4).
Until price gets to more significant levels ( i.e, daily zones ) and shows something plain and obvious, I’m watching from the sidelines.
S/R levels
Mr J has given two excellent responses (as always)
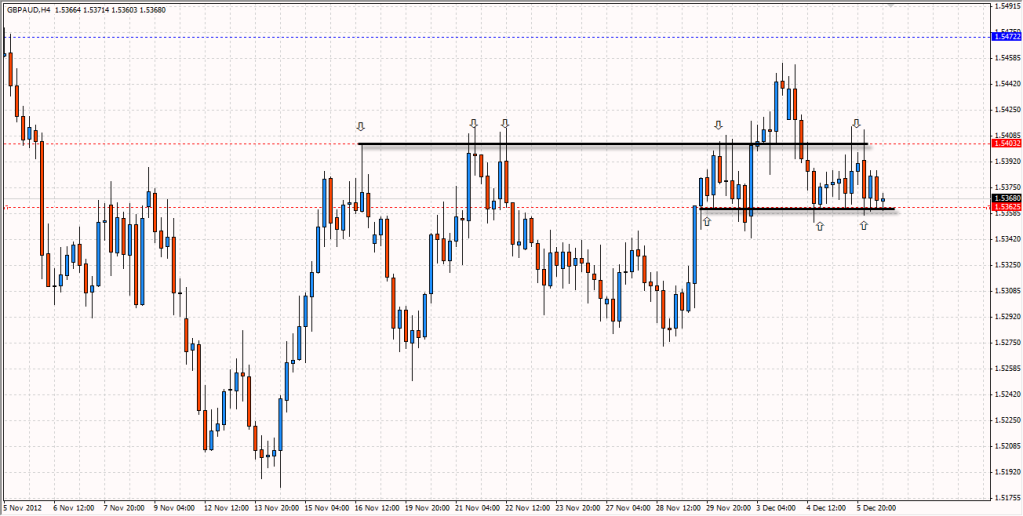
GBPAUD D1: great level! (1.5400) but currently I see: progressively higher highs, and higher lows, so I’m wary of shorting…[ esp since the 2nd bar of the 2BR shows signs of rejection at its bottom…]
Yes, I got busy with the new work. Thought you were not going to comment. Your comments are always welcome. I still get confused with the 2 BR hehe. Anyway I might just have to trade conservatively. In the 4 hr i spotted a BEEB. TY
If you are referring to your post #5614: the level you marked is approximately similar to the marked level on my H4 chart (your level is abit higher). If I was looking for PA on H4, that’s where I’d look.
That doesn’t mean either of us is right and the other is wrong. The picture just does not add up to me (I don’t see decisiveness/direction), and I wanted to explain why I’ll be watching from sidelines…
Oh , i’m newbie and i don’t know what best pairs to trade ? (Example : EU,GU,UCHF,AU or …v)
I can’t monitor over too much pair in the same time. So i want ask you the best pairs to monitor .
The more liquid a pair is, the better!
So if you don’t want to watch too many, start with the MAJORS (e.g GBPUSD)
Then as you get more comfy with time, you can add the JPY crosses (e.g EURJPY), then the other crosses (e.g EURAUD)
NB: whatever pairs you decide to watch, do this as first thing:
a) go to daily chart
b) mark two key horizontal levels: one above current price, and the other below current price.
Those are the places we wait for price to reach and produce PA. Once you get comfortable trading on the Daily, then you can check out the H4 (looking for PA at those same Daily levels).
Thank you that is very helpful. Is this basicly correct? If the bars close at the same level but the highs (or lows) are at different locations then the resistance (or support) is at the closing level, however if the closing levels are at different levels but the highs all stop in the same area then the resistance is at that level.


 and may it go higher for you!
