I had a short going- and was in the red about 30 pips – - I wanted to short again- - and I was successful, however - - my first position closed???
So I tested with another short a few pips later- and it held??? what???
Dude, deep breaths. GBP/AUD is in upward trend yo. Go long B.
Maybe you bought instead of shorted.
Thanks guys -
From my experience - maybe I am wrong - but If I am already in a short position - and I add another short - - it just works.
I’ve never seen or heard why/how it would first close my original position.
So - maybe I put in a buy order instead - - good idea - but again from experience then I would have gotten an error - something stating that I can go short and long at the same time.
I am with FXCM US and if I shorted the same amount and longed the same amount, the position would just close with no error message. Let’s wait for Jason as he’s the expert. But maybe your open/closed position logs will tell us.
Hi PT,
Kashix is correct. The first thing we need to check is your account statement to see what order type closed your trade. Please follow the steps below.
[ol]
[li]Please tell me whether this is an FXCM US, UK or AU account.
[/li][li]Go to MyFXCM.com and log in with your account number and password.
[/li][li]Click on Account Statement to view a report for the time in question.
[/li][li]Please tell me what it says in the Condition column both for the first trade that closed and for the second trade you opened. (You can even post a screenshot of the account statement here as long as you cross out any personal information such as your name, address and account number.)
[/li][/ol]
Thanks,
Jason
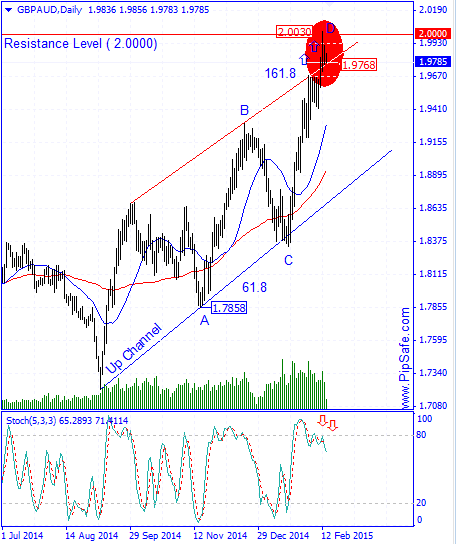
GBP/AUD during the recent days was in a strong and consistent uptrend that buyers were successful in achieving the highest price of 2.0030.Price by reaching to the important round resistance level of 2.0000 and the resistance edge of uptrend channel has stopped from more ascend that shows buyers used this price level to exit their trades.
According to the formed price movements in the chart, between the bottom price of 1.7858 and top price of 2.0030,there is AB=CD harmonic pattern with ideal ratios of 61.8 and 161.8 that with completion of the D point there will be a warning for descending of price.Stoch indicator in daily time frame is in the saturation buy area and is in divergence mode with the price chart that warns about changing price direction.One of the important warnings for decreasing of is breaking of supportive level of 1.9768 (Low level of price changes in the previous daily candle).
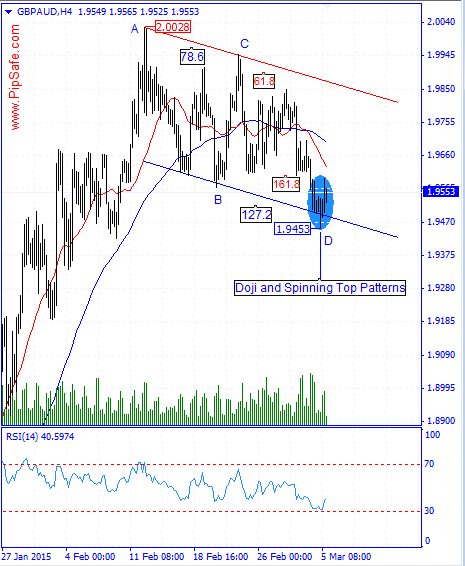
Technical analysis of GBP/AUD dated 06.03.2015
As it was mentioned in the previous analysis of this currency pair dated 16.02.2015, according to the formed signs in this price chart, there was the possibility of descending of price which finally happened.As it is obvious in the picture below, price with reaching to the supportive edge of Down channel has been stopped from more descend and by forming a bottom price (Doji Pattern) of 1.9453 has prepared the field for ascending of price.
AS it is obvious in the picture below, there is an ideal AB=CD harmonic pattern between the top price of 2.0028 and the bottom price of 1.9453 with ratios of 78.6 and 127.2 that warns the ascending of price from the D point.RSI indicator is in saturation sell area that confirms the current harmonic pattern with the next cycle but because of non-compliance and coordination with larger time frames, this signal is not much valid.Based on current chart , there is a probability for bullish candles , First notice for starting bearish trend will be came out after punching D spot in 1.9453 level.