I will post some of my charts and trades setup, and please let me know what you think
I think it looks like a chart.
Did you have a more specific question?
Mafahmy, you setup S/R and trendlines, this is incomplete by itself. In all actuality there is no trade setup.
You must answer two questions (or more) within yourself now that you have somewhat setup these charts?
- Which way is the pair going to go: up, down, or sideways? (And why?)
- When are you going to enter and exit your trade? (And why?)
The first question involves you as a trader. Are you trading the charts alone via candlestick formations, etc, Technical Analysis? Or are you trading via Fundamental Analysis, via News Reports, IMF Reports/Data, COT Reports etc? Or a combination of both? Or are you trading Price Action?
The second question involves the answer to the first question.
Mastergunner99 is right you need to add more information, and please take no offense, as your post just needs more information.
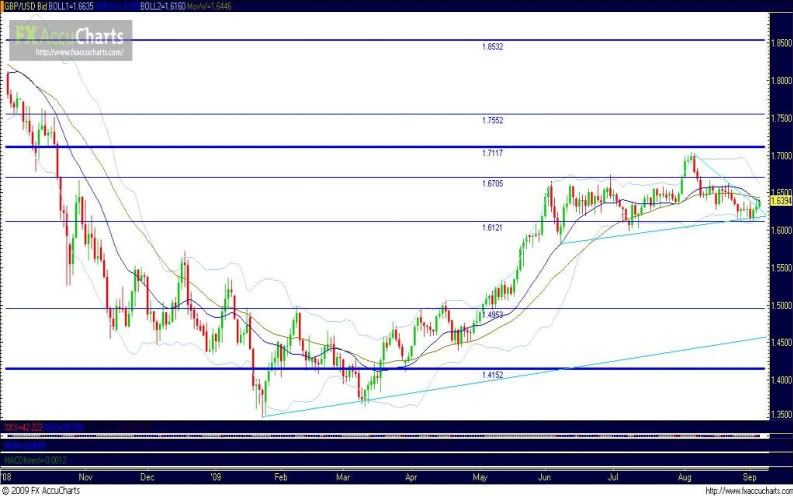
these are charts with major support and resistance and trendlines that i will build on it the trading plan and setups for this week , i will post my trades setup as soon as i have it ready,
my trading is based on definning support and resistance area, chart patterns,candlestick formation,harmonic pattern.
oh,i meant what do you thing of how the support and resistance and trendlines is set on the chart ?
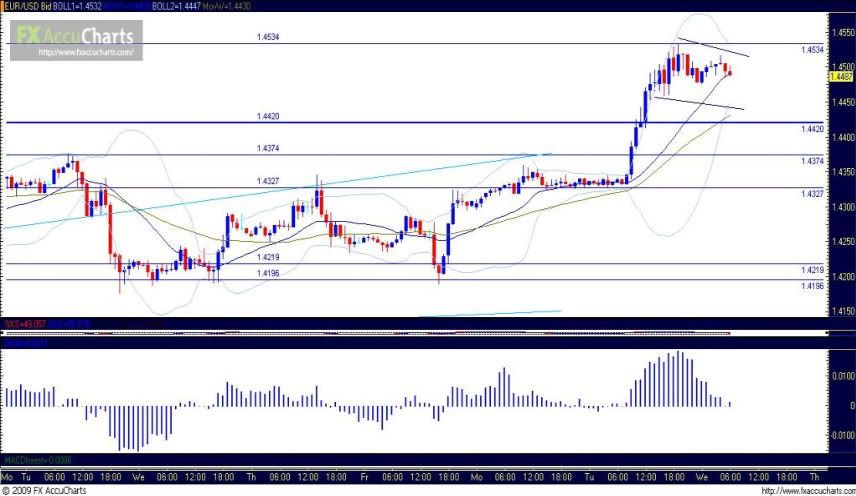
EURUSD TRADE SET UP , I AM WAITING FOR A BREAK OUT OF THE RANGE AREA SHOWN ON THE CHART, BREAK OUT TO THE UPSIDE , WHEN THE BEAKOUT TO THE UPSIDE HAPPEN, I WILL ENTER BUY WITH A STOP LOSS BELOW THE LOW OF THE RANGE
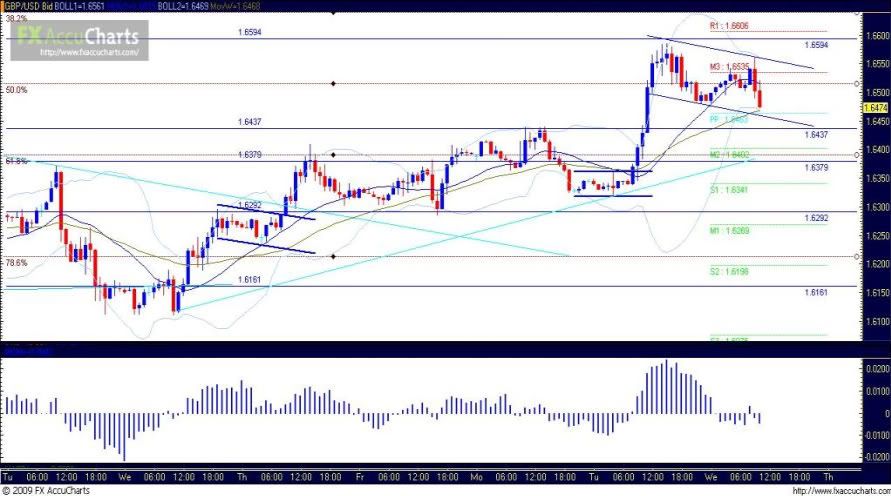
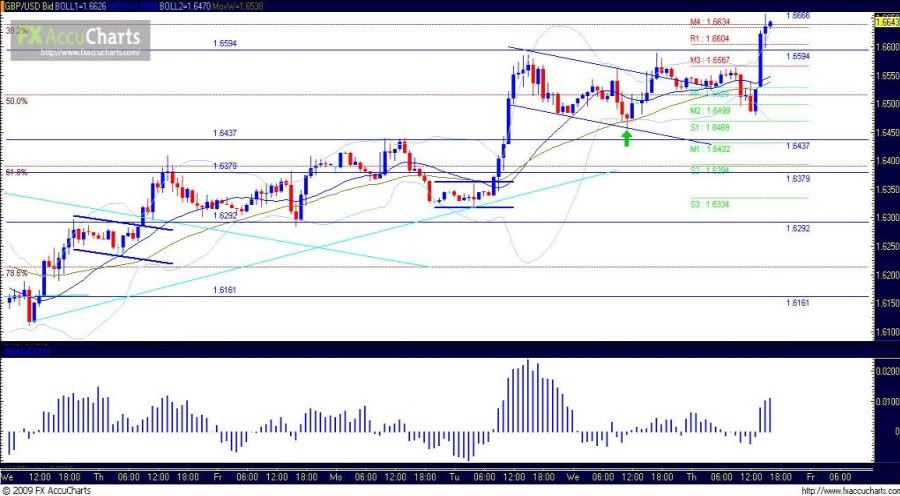
GBPUSD TRADE SETUP THERE ARE TWO WAY TO ENTER A BUY ENTER CLOSE TO THE LOWER LINE OF THE CHANNEL WITH A STOP LOSS BELOW THE RESISTANCE LINE AT 1.6437 AND A TARGET AT 1.6646, OR ENTER ON THE BREAK OF THE UPPER LINE OF THE CHANNEL WITH A STOPLOSS BELOW THE SWING LOW .
I PREFER THE FIRST ONE
I like it!!
Here’s a couple suggestions…
-
Get rid of MACD. It lags. It’s worthless. I am not a big fan of the calculated S/R levels either. I could see how some use them though.
-
When I mark a support or resistance area I mark the absolute extreme. So on your second chart I wouldn’t mark 114.75 I would mark the bottom of the wick. Person preferance here but that keeps me patient and waiting for the S/R to be appropriately tested.
-
When price is approaching support I am looking to BUY. When price is approaching resistance I am looking to SELL. On that last trade I can’t really tell what you are trying to do there. I do see you are buying a pullback in an uptrend so atleast that is good.
-
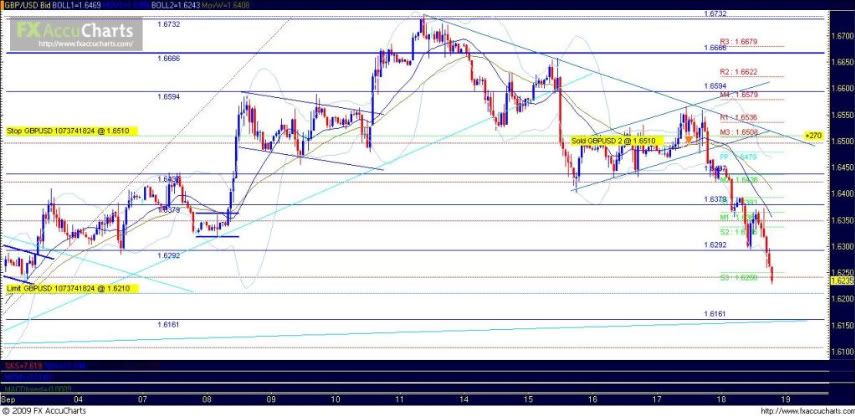
Price can very easily touch 1.6437 so imo that is not a good place for a stop. On this chart price blew through the previous high (resistance) and when it does that often times it atleast comes back and touches it even if it’s realy quick. In this case you had a lot of confluence w/ the BB and MA’s for that long so it worked out.
i am glad that you like it,
the macd i use it mainly for divergence,any support or resistance line to me ,it represent a zone , an area of resistance or support, at this trade the stop loss was set below the daily pivot
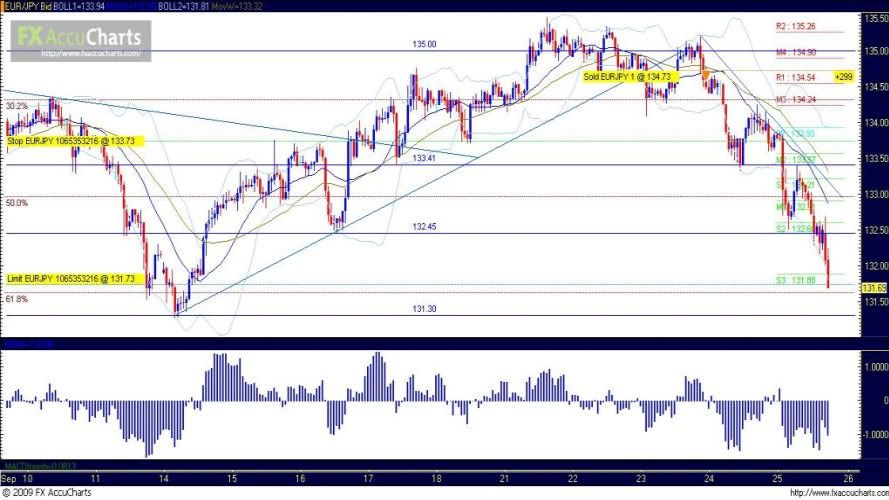
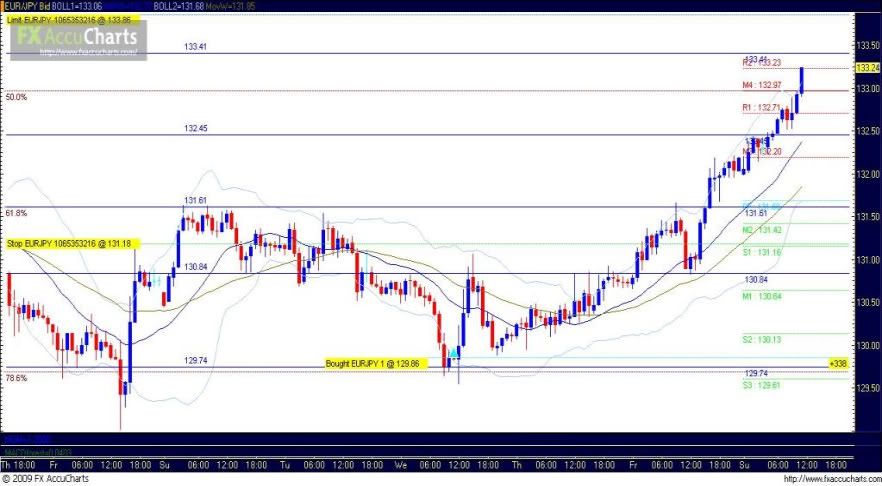
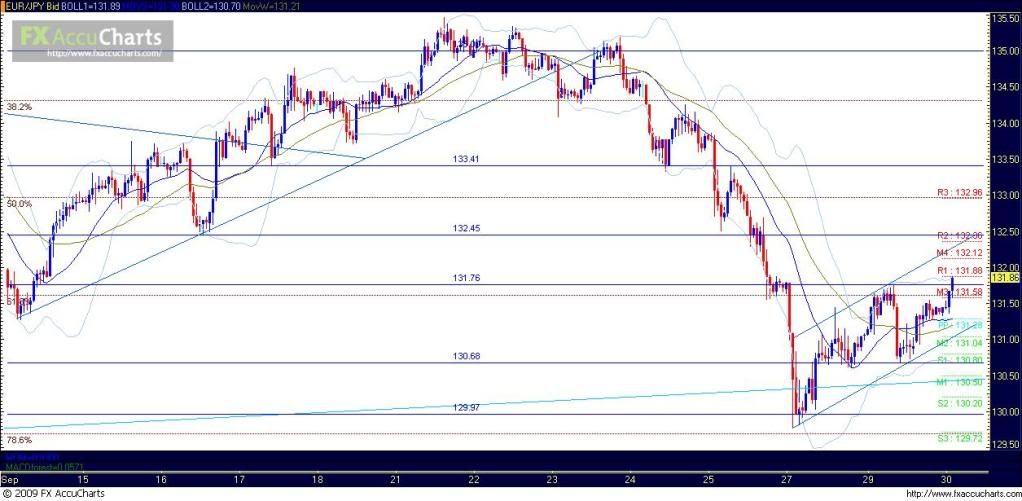
eurjpy there was a bullish gartley pattern that i took advantage of and price now is ranging to the downside forming a possible flag pattern
Hey Mafahmy,
Why don’t you post your trade ideas up on meetpips? I think some users from the BP forums post their trades their as well. You might be able to get some feedback there as well 
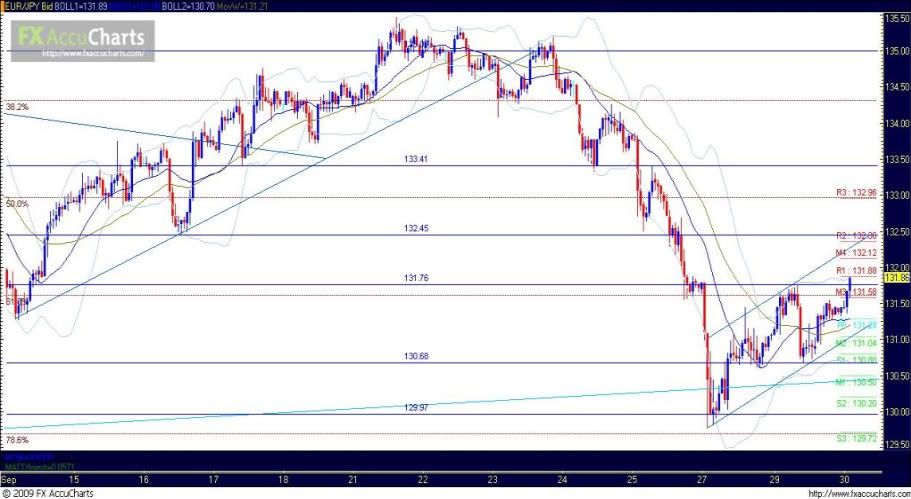
What timeframe are you using for this graph?
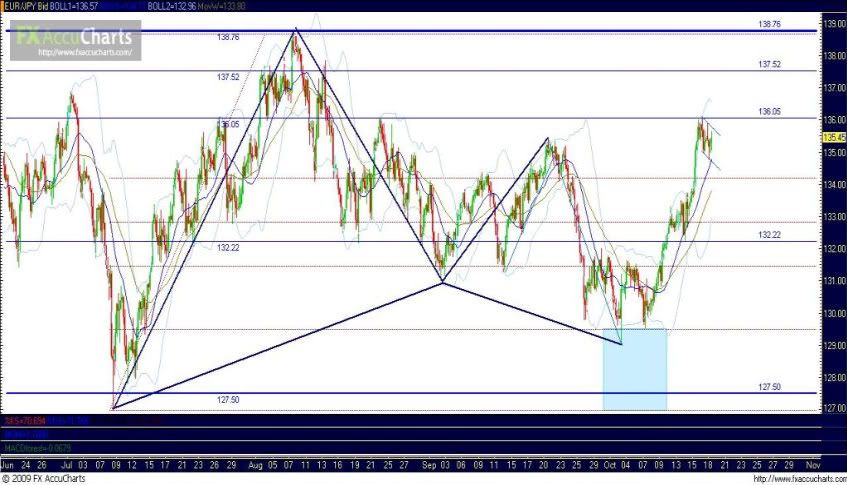
welcome to my thread mich and for this one it is 1hr timeframe
thank you , that is a great advice, i didnot know that this site exsists