While going through past data I saw this anomaly. The first circled candle shows the bar for 15 Sept 2008 at 2200hrs while the second circled candle shows the bar for 16 Sept 1900hrs. 15 Sept was a Monday and 16 Sept a Tuesday in 2008. Was this cause by data problem with the broker or something else? 
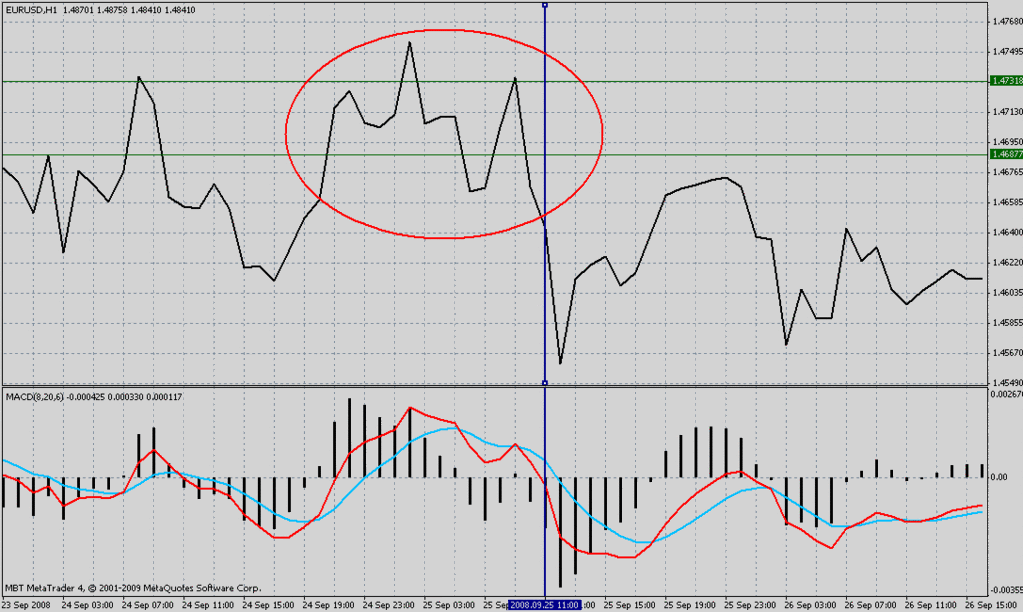
And one more thing, can this pattern (circled red) qualify as a head and shoulder pattern as the right valley seems to dip too low 

Hi Caesar
I am confused by your first chart and question, It looks like a 1 hour chart
think the problem is with your feed . you got a whole chunk missing when compared to mine
best regards
