Just wondering whether traders out there use a system consisting of only Trend line, support/resistance and candle patterns and maybe and indicator like stochastic.
If so how has it worked for you and have you learned anything useful worth passing on to others.
It would be great to get something going where people load their pre and post trade screen shots (with systems using the above techniques) with what first caught the eye on the chart and then their further analysis and thinking behind getting into the
I know it my be time consuming, but I think it would be a great help and guidance for new traders like myself, who sometimes lose their way in the analysis.
You may be trying to do too much at once. Its great to have a full set of trading tools at your disposal, but that doesn’t happen easily. It is better to concentrate on one or two things until you master them. Of the 3 things you mentioned, I can say that S/R strategies are the only ones I trade regularily and that was the first strategy that I mastered. Since then, I have mastered retracements, pullbacks and continuations and gave up using numerous others.
As far as trendlines go, that seems to something that some people use and others like myself don’t even begin to understand.
Rather than asking others to post their trades on your thread, it might be more beneficial to find an interesting thread and follow it. I’m not familar enough with BabyPips to recommend any. Otherwise, you are going to be bombarded by a variety of trading styles and strategies that may even be contradictory.
I’ve been doing this exactly for tha past lil while. It started with an EU setup but I continue ta post screenies and why I entered. Tha thread is called “Current EU Setup.” I just posted on it actually. It’s a recent thread and I would love ta see someone else post a trade with a similar plan. SDC has posted on it as well. I personally like shapes…
yes all charts can be interpretted differently dependant on your style of trading.
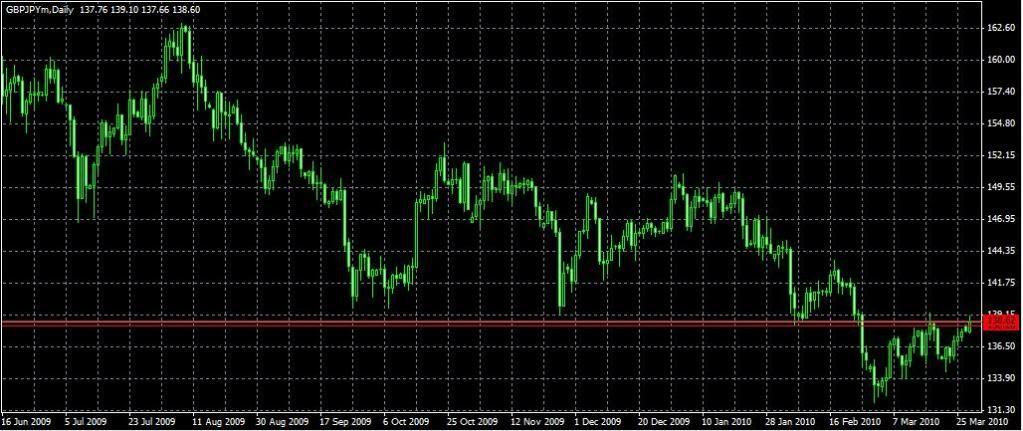
but in this thread he is refering to horizontals and trendlines, so on that basis this chart does show a pretty clear sell signal which im simply asking him to point out for educational reasons and to ensure he fully understands the concept of how their used, their relevance and determining their strength
A newbie guess here but retest of last known resistance coupled with what looks like price being near a roundish number (can’t really make out the numbers from our chart)?
Sorry for late reply was having trouble posting for some reason so had to sign up again (old username dp83). Thank you all for your replies all very helpful.
To Profitforextrader.
I would say its a strong sell signal due to the fact that price is hitting an area which was once support (end of jan and the points around nov and sept 09) then turned resistance ( around 14th of march). Also without placing any trendlines then chart looks as though price is in a downtrend, and usually best to take trades in the direction of the trend. Is that right???
But if you were to place a trendline connecting the 4/1/2010, 17/2/2010 and 17/3/2010, then price has broken above and closed above it. So then wouldn’t you want enter long on a break and close above the resistance line that you have drawn or am I missing something???
Thanks again to all so far, I am very willing to put in the effort to learn and everyone efforts to help are greatly appriciated.
everybody draws there lines diferently and what works for some doesnt always work for others although obviously there are some general rules of thumb.
i personally wouldn’t have drawn a trendline through the 3 points you mention as you’d have way too many full body candles crossing that line, i would only allow candle wicks and maybe a small part of certain candle bodies to breach that trendline.
although your thinking is very rational and you are definately on the right track.
have you learnt to draw and use fibo retracements?
if so could you possibly narrow down a 4H chart and draw where you think the most recent major swing high to low would be and your thoughts on it
To be completely honest I know a bit about fibonecci, but not I whole lot. I know that it can act as turning points for price when it is in line with and area of s&r it makes that area that little more vaild.
If I was have a go at where I would place it then this would be it (see attachments). But to answer this I had to search for answer else where in regards to drawing them.
Also to add to the above (reply to profitforextrader), I’ve been reading through many of your threads and have seen how you have developed yourself as a trader over time.
Just wondering how did you start out (in either or other financial markets)and what do you think have been some of the keys to get to the point you are now as a professional trader and fund manager? (I definitely know that there would have been lots of hard work along the way)
Again thank you for taking the time to reply to my posts, much appreciated