Inspired by others I’ve decided to make a trade journal as I attempt to get to grips with Tymen’s Bollinger DNA method. After reading the thread on trend trading it seemed like this is a system that would help me overcome some of the deficiencies I noted in myself as a trader after 1 year’s experience. Thanks to TimberWolfMk2 for the initial outline to shamelessly plagiarise 
Plan to trade in the following markets:
-EUR/USD
-GBP/USD
-AUD/USD
-NZD/USD
-GBP/JPY
-EUR/JPY
-USD/JPY
-USD/CHF
-EUR/CHF
-USD/CAD
-EUR/GBP
-GBP/CHF
-AUD/JPY
Position Sizing
2 contracts will be used for all trades risking not more than 2% of my account for each trade. Can have up to a maximum of 5% in play at any one time when combining all open trades.
Time Frame
The 1 Hour & 4 Hour Timeframes will be traded mostly. I will not trade lower that 1 Hour but I may occasionally decide to trade the Daily if I see a good opportunity.
Entries
I only use one set of Bollinger Bands with default standard deviation set to 2.0. In times of rapid BB expansion I’ll add another with standard deviation set to 3.3 in order to identify price extremes.
Entries will be made employing an orthodox Count Back Line method which is fully defined in Tymen’s thread.
I will typically avoid trading the No Trade Areas identified in Tymen’s method though this may change depending on additions to the original strategy which may be forthcoming from Tymen.
Stops
A stoploss will typically be set at the extreme candle’s high/low.
Once the trade is underway I’ll use the Parabolic SAR / Middle BB trailing stop approach as outlined in Tymen’s method.
Exits
The Middle Bollinger Band will be the site of TP1.
The Outer Bollinger Band will be the site of TP2 though I will monitor the bands and PA closely at this point and hold off on exiting if I believe there is a chance to participate in an upcoming walk.
Trade 1 - 26/07/2010
Pair: GBP/JPY
Timeframe: 1 Hour
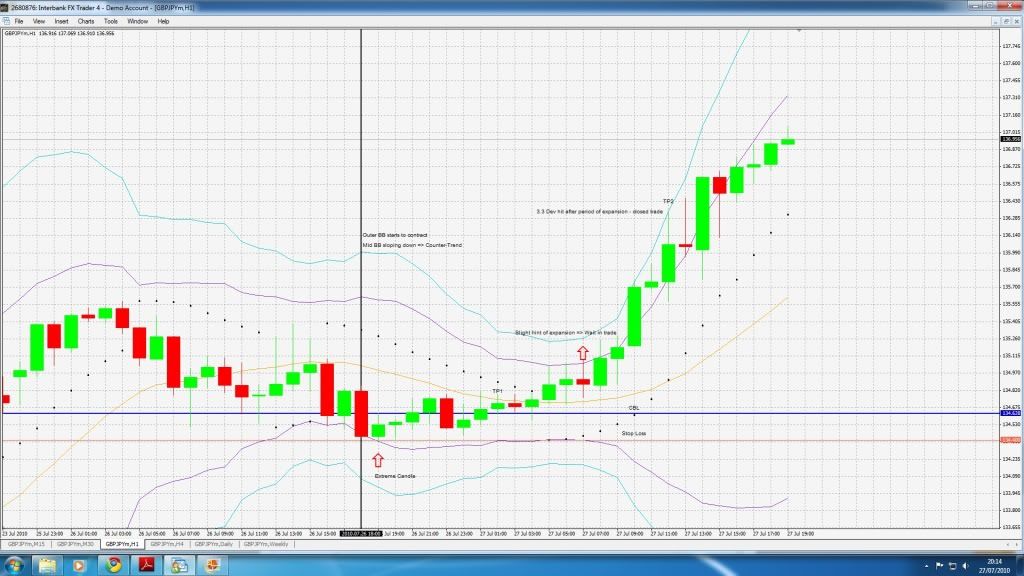
Thought we were in a some sort of a squeeze, identified the candle in the chart as a possible extreme and entered a long trade at 134.64. Stop was drawn from the low of the extreme candle at 134.41.
Accounting for spread TP1 was hit for a princely 8 pips and 1st position was closed. At this point it was time for some sleep so I left the trade to run overnight figuring that the worst that could happen to me would be I’d be down just over 20 pips in total.
When woke up could see PA was at TP2 level but there was a hint of expansion to the Outer BBs. Following Tymen’s advice about how you have to sniff out upcoming walks sometimes I decided to wait and see how things played out.
PA rose up strongly and I decided to close after it had hit the Dev 3.3 BB after a good few hours of rising (following Tymen’s exit rules). Maybe could’ve hung in longer for quite a few more pips but I think following the rule long term will probably serve me better.
Total P&L: 172 pips
R/R: 2.97
Trade 2 - 26/07/2010
Pair: GBP/CHF
Timeframe: 1 Hour
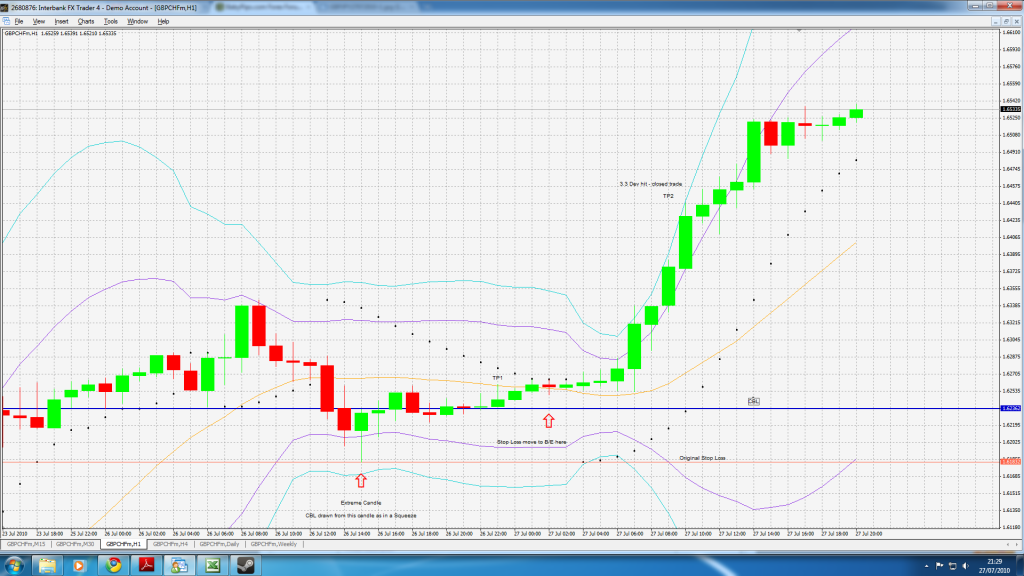
CBL drawn from extreme candle in a squeeze. Stop placed at low of extreme candle. TP1 was hit later that night and 1st position was closed for +15 pips. As the original stop was 50 pips away at this stage and I was off to bed I moved the stop up to break even and left the trade go overnight.
The next morning it looked like the Outer BBs were starting to expand so let the trade go despite hitting TP2 similar to GBP/JPY trade. Wait and see paid off and closed out trade after it had hit the 3.3 Dev after rising up strongly. Again I could’ve hung in there for longer maybe but am following the rules (as I understand them so far anyway).
A nice start so far though was certainly helped by GBP’s explosion today. Best thing about the method I’ve found so far is the feeling of control over the trade. Up until now I was a very haphazard trader and it showed. Constantly.
Total P&L: 213 pips
R/R: 1.75
Account Balance: +3.85% after the CHF & JPY trades
wow, awesome trade man. looking forward to your journal, especially if your results continue to be like this!
Hi,
your off to a flyer! nice job.
…could you zoom in a bit more to your chart I’m finding it really difficult to see the meat and veg… 
Good trading, I’ll be following along.
Will do! I noticed myself it’s almost impossible to read the chart details once uploaded. I’ll sort it out for future trades.
Hey there, [B]PipBandit![/B] I am going to be following this journal with keen interest, along with all the rest. I find them a refreshing read, and would really like to see all of us becoming proficient with the DNA Method.  Keep it up and good work!
Happy pipping!
Trade 3 - 28/07/2010
Pair: EUR/CHF
Timeframe: 1 Hour
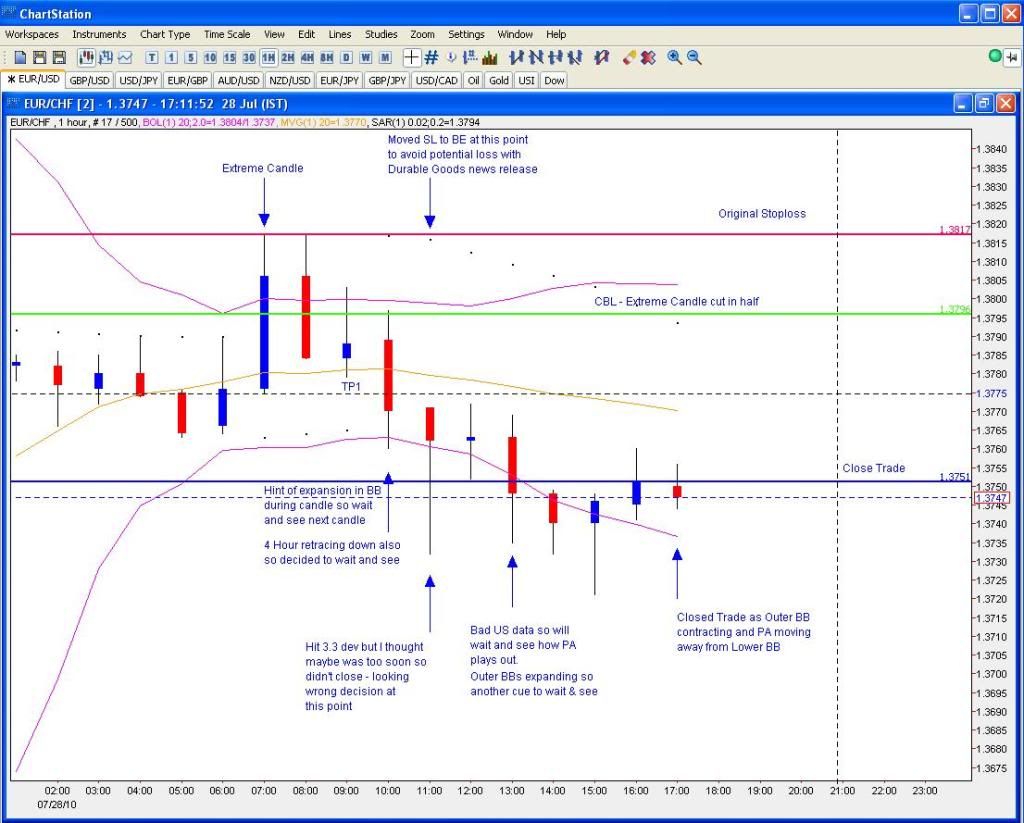
Entered a short trade in a squeeze at the extreme candle CBL which was drawn from the extreme candle being cut in two per the standard rules. Stop was placed at the high of the extreme candle.
TP1 was hit quite quickly and 1st position was closed out for +11 pips.
TP2 followed shortly after but as PA fluctuated a little it looked like there was a hint of the Outer BBs expanding so I decided to wait to the next candle and see what transpired. The 3.3 dev line was then hit on the next candle but I thought this was too soon to close on that alone so remained in the trade.
As had +50 pips at this stage I moved the stoploss to breakeven given that we had the Durable Goods report coming. Bad US data then pushed the PA down some more and price hit the 3.3 dev again at around 3pm GMT. At this point I should’ve exited the trade but didn’t. Price rose back up and I exited using the Simple Method (Outer BB contracting & PA moving away from Lower BB line) described by Tymen giving back 30 pips to the market as a result.
Lesson: If after expanding for a few hours the price hits the 3.3 dev just take it unless there’s a very clear reason to remain in the trade.
Total P&L: +51 pips
R/R: 1.21
Account Balance: +0.49%
Overall Account Balance: +4.36%
Thx for sorting out the charts, much better.
Nice trade… just one thing 
You wrote EUR/GBP, the chart tab says EUR/USD but the chart is EUR/CHF…
 … hehe
Whoops… oh yeah. Fixed it up. Keep my EUR/CHF charts in the EUR/USD folder for some reason. And EUR/GBP is the other trade I opened up this morning - getting things mixed up!
Worst case scenario - I think there are several of us ‘copying’ Trizzle now - so worst case we’ll get to see 3 or 4 or more versions of the same plan and how they evolve for each of us.
I’ll be watching this one too, as well as trying to improve my ‘details’ lets grab the bull by the tail and hang on - - -I think we’ll all be positive pips and sooner rather than later. . .
you should look at meetpips.com and mt4pips.com I think they are great tools for logging trades that include some charting.
Does it hook into the actual trade on MT4? Unfortunately I can’t access MT4 from work - impossible to install anything on my work computer. Work for one of those big financial companies and they have everything locked down tight. If it’s just logging with charts I’ll take a look.
meetpips requires no software. Its pretty cool.
Trade 4 - 28/07/2010
Pair: EUR/GBP
Timeframe: 1 Hour
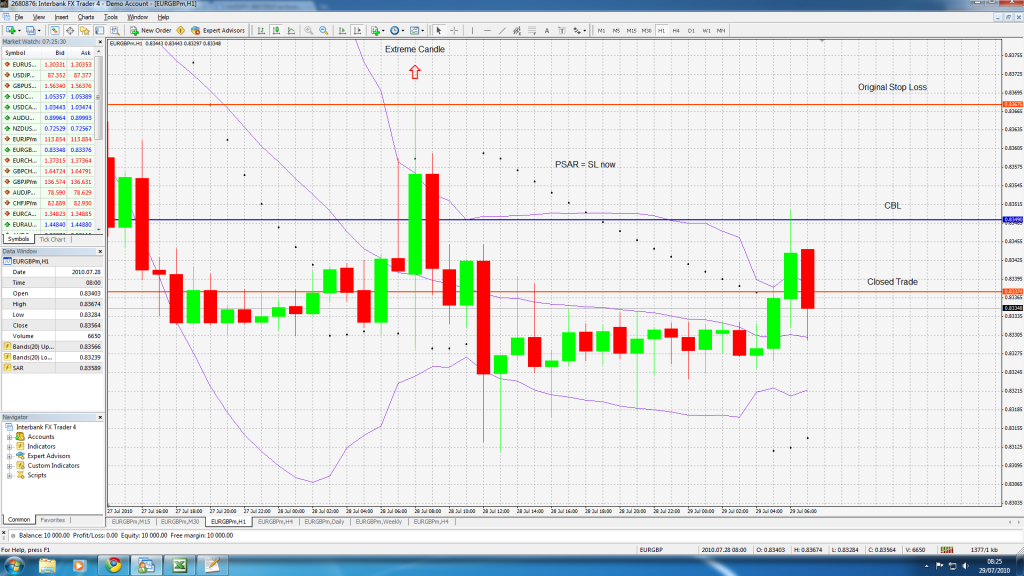
Entered a short trade in a squeeze with the CBL being drawn from the extreme candle cut in half. TP1 was hit almost straight away from +8 pips. Trade just dawdled along after that going nowhere really. Left it run overnight and when I woke up this morning price was starting to rise up. After the PSAR inverted I drew a stoploss line from across the last point and once that was hit I decided to close the trade there and then rather than wait for a close. Looked like we were going into another squeeze at that point and I’d no clue where price might go. I had higher hopes for this trade but not to be it seems.
Total P&L: +18 pips
R/R: 0.47
Account Balance: +0.17%
Overall Account Balance: +4.54%
Trade 5 - 28/07/2010
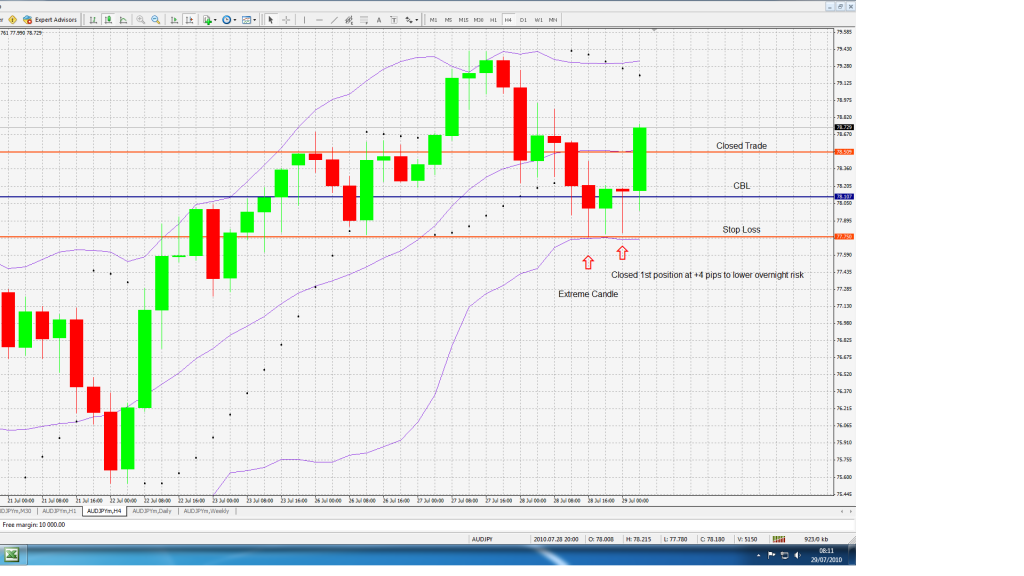
Pair: AUD/JPY
Timeframe: 4 Hour
Entered in a squeeze with the CBL drawn from the extreme candle cut in half. Was a bit hesitant about the trade as the Aussie had been getting hammered but figured it was worth a punt. Came very close to being stopped out - within 4 pips - after price dropped 30 odd pips after triggering the long.
Rose up again by around 12:30am GMT to just over the CBL so I decided to close out the 1st position there for +4 pips and leave the balance run overnight. Early this morning the price hit the Mid BB and I decided to close the trade there - easily could’ve been a 2 contract punch in the face this one so I’ll take what I’m given.
Total P&L: +40 pips
R/R: 0.58
Account Balance: +0.38%
Overall Account Balance: +4.94%
Trade 6 - 29/07/2010
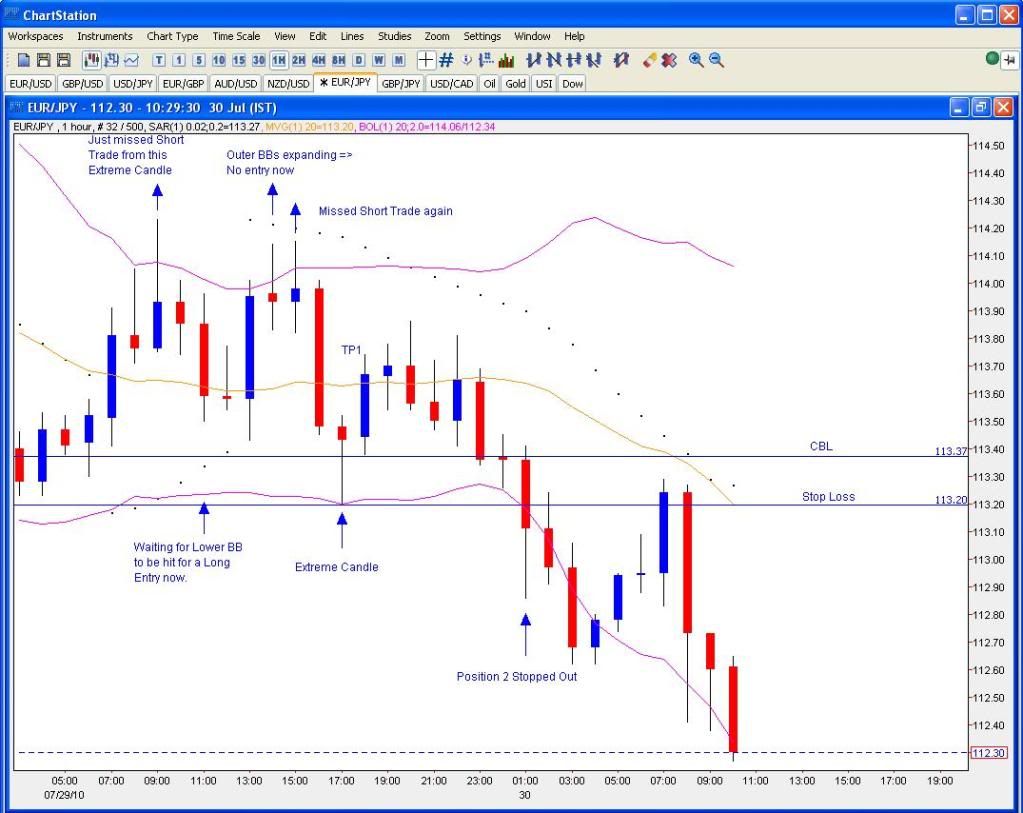
Pair: EUR/JPY
Timeframe: 1 Hour
Missed out on a couple of short trades before in this pair by not paying close enough attention. Got in with a long trade shown at the extreme candle CBL. Got in just above the CBL and TP1 was hit just a few minutes later and position 1 was closed for +22 pips.
Price rose up a bit more before starting to reverse. The wise option at this point would have been for me to move stop to breakeven as the overall trend in all the JPY pairs was down making this a counter-trend trade. I didn’t though thinking that we might get a turnaround in the pair which was a mistake on my part. JPY continued to strengthen overnight and the 2nd position was stopped out for -21 pips. Another lesson learned… hopefully.
Yesterday was a series of missed opportunities for me. In particular I missed the glaringly obvious short EUR/CHF trade which would’ve been good for 150+ pips. No worries - on to the next set!
Total P&L: +1 pip
R/R: 0.02
Account Balance: +0.01%
Overall Account Balance: +4.95%
Trade 7 - 30/07/2010
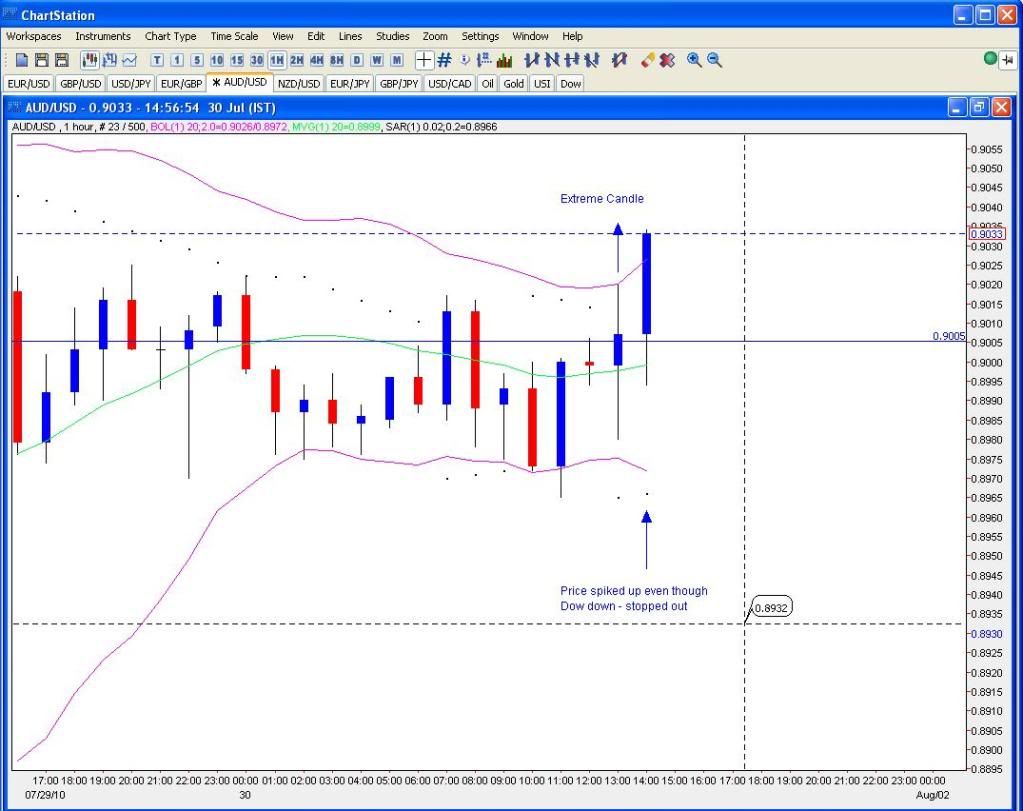
Pair: AUD/USD
Timeframe: 1 Hour
Waited for the short entry at the Upper BB during a squeeze. 4 Hour chart looked like maybe we were in a return to Outer too. Figured waiting for the short was the better choice as Dow futures were -80 at that point after the GDP numbers. Placed stop 5 pips above the high of the extreme candle to give it a little breathing room. Dow opened down and Aussie spiked up which stopped me out in short order with both positions closing at 0.9025.
Perhaps the clue to stay out of the trade was that even though Dow futures were down that much the Aussie was holding up well at the 0.9000 level. Another lesson to absorb I guess.
Total P&L: -32 pips
R/R: -1.00
Account Balance: -0.30%
Overall Account Balance: +4.63%
Trade 8 - 30/07/2010
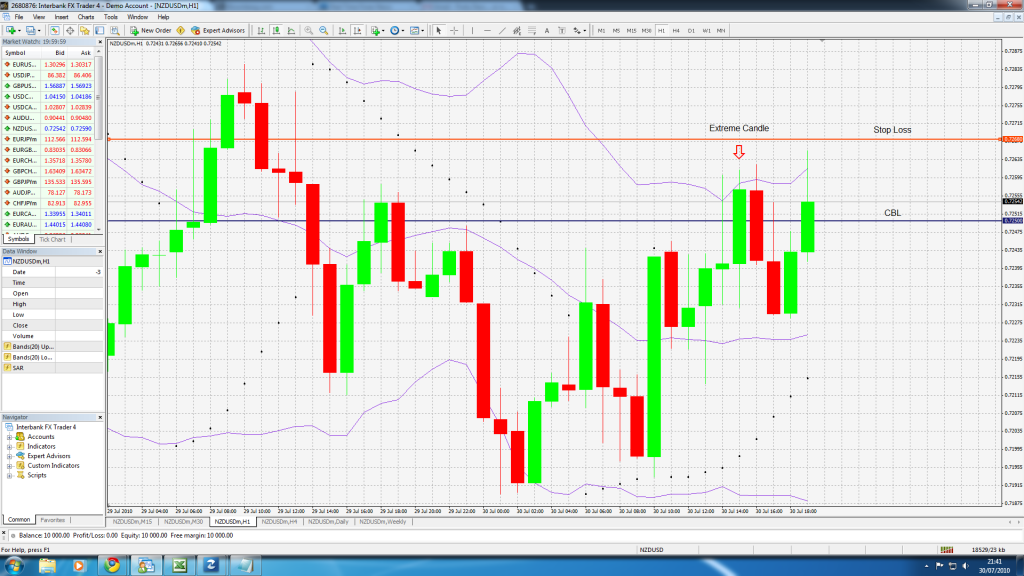
Pair: NZD/USD
Timeframe: 1 Hour
Thought price was in a squeeze and entered short at the CBL at 0.7250 (which I only noticed later that I’d drawn a little too high). Placed a stop 5 pips higher than what was the high at the time of entering the trade at 0.7268.
Price went my way for a while before turning around before the mid BB and with the NY close on the way I decided to close the trade manually at break-even which I missed by a pip thanks to a little hesitation.
Total P&L: -2 pips
R/R: -0.06
Account Balance: -0.02%
Overall Account Balance: +4.61%
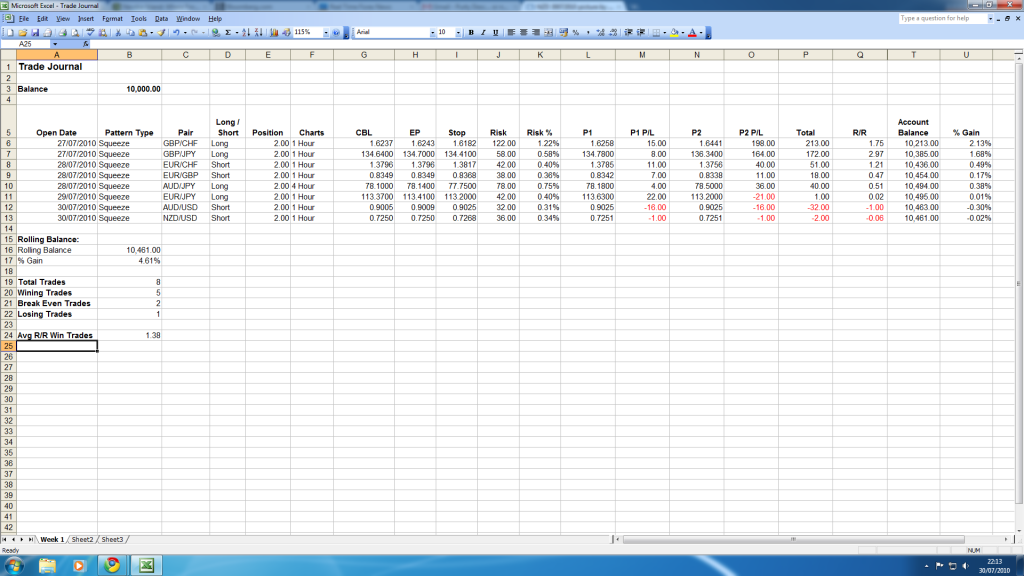
Week 1 Summary
1st week of using the method outlined by Tymen and was certainly a good one for me all in all. Having a much more structured approach has really helped me. Found myself placing a lot fewer trades also than I previously did. Still need to work on spotting potential setups. Missed a few blindingly obvious ones but practice will help I suppose.
Thoughts have turned also to multiple lots. With my two big wins I had half my position off the table very early on. I really could’ve capitalised a bit more on those trades as they panned out. I’m going to look back over some of Graviton’s and others posts on this, see what I can apply and come up with some structured rules for myself.

