I have a couple of questions regarding the overview chart:
[ol]
[li]Is the trend line correct? The reason I’m asking is because, although I see the overall trend going down, it seems a new trend has formed at it’s bottom.
[/li][li]Is the Fibonacci retracement traced between the correct swing high/swing low (pink line)?
[/li][/ol]
And a couple more regarding the setup details:
[ol]
[li]The stop loss is positioned on the 100 fib level as the entry price is positioned on the 61.8 level. Is this correct?
[/li][li]Is the candlestick pattern “Bearish engulfing” correct?
[/li][li]I’ve placed the entry price on the 61.8 level because it’s the trend line crosses this level and it’s a downtrend. Is this correct?
[/li][li]I’ve traced the Fibonacci extension (blue line) on different swing high/low from the Fibonacci retracement. Is this correct? And would it be the right place to trace the Fibonacci extension?
[/li][/ol]
I’m getting confused about these Fibonacci retracements, because every trade I make based on it comes out wrong. Of course I assume I’m doing something wrong
In your chart you should pull the fibonacci retracement tool up the last upswing, in other words pull it along your blue trendline from the low to the high.
Having said that, I’m not entirely happy with that trendline, I have been looking at that same chart myself and debating … that upswing was a bit messy in that it faltered about a third of the way up, as opposed to the previous downswing which was a lot cleaner looking and is has a definate high and low I like that a lot more when it comes to pulling trendlines.
So because of that when pulling the trendline I would be debating whether to pull it like you did, and call it broken as you have, or … if you look at it another way, strictly speaking the trend was broken when it faltered a third of the way up, if you assume that you can see how that first trendline turned from dynamic support to resistance after it was broken.
If you continue to assume that you would then pull a second trendline along the lows after the trendline break and you would then see a different picture, that uptrend is currently unbroken and still in effect so would not be a valid place to pull the fib retracement to.
Ok so anways, that is how you should be looking at things if you assume the fib retracement is going to work… But if you want my opinion, fibonacci retracements are one of those tools that works well in hindsight, the reason I say this is because if you watch any tutorials about fibonacci they will always show you how it would have worked over some previous chart historical price moves.
What they dont tell you is how are you to know, when live trading, where is the end of the current trend.
You can see the dilema easily on the chart you posted, to use the fib retracement you have to assume the end of your blue trendline is the end of the current upswing and therefore is the highest high. But then, what if its not …
Hmm, I must say that trend line does look suspect. It takes TWO tops to form a trend line and THREE to confirm it. What you did was simply connect a previous top with whatever price EUR/USD was at.
Fibs are subjective, and the way you drew it is perfectly fine in my opinion. The trend is generally down.
If you traded using the Fibonacci levels you drew, you could’ve caught some pips on the 38.2% Fib and 61.8% Fib.
My take on the Fib is this. They are a great forecaster of possible S/R, like the PP. I use the PP and the Fib on Daily Charts to get a sense of what may happen during the trading day. Factor in any newsreports and I think thats the best way of using Fib, atleast at a newb level. I wonder if the vets around here use it as a live trading indicator??
The fibs would be drawn correctly if he had been trading on the upswing but I think you’ll find if you look again, he draw the fibs on the downswing and is planning future trades with those same fibs, after the subsequent upswing, otherwise why point out the bearish engulfing pattern? To trade after that bearish engulfing pattern the fib retracement should be pulled along the same line as his blue trendline from low to high assuming the bearish engulfing pattern is accurate and a new downswing is about to begin …
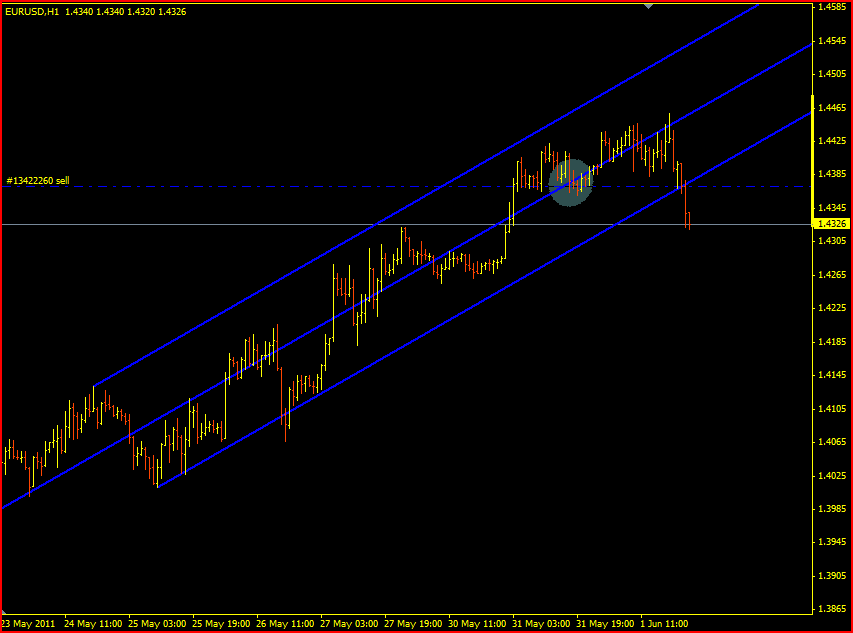
The current hourly chart is difficult to trendline using normal trendlines, Ive been using Andrews Pitchfork for the last few days to bounce trade I think I jumped the gun though with my last sell position I thought it was going to break the middle fork again but now I’m not so sure
Those pitchforks remind me of regression channels. I personally like regression channels better.
I don’t trade much Fibs but I used to. They are discretionary just like anything else, you draw them from a swing low to a swing high or vice versa, the thing is, a new high can blow up and the fib now needs to be moved.
Can be a real head scratcher if they aren’t used in congruence with basic price action.
I made an unprofitable trade today and i wanted to analyze the reason it became a bad trade to identify what i did wrong…
I use fibonacci retracement levels.
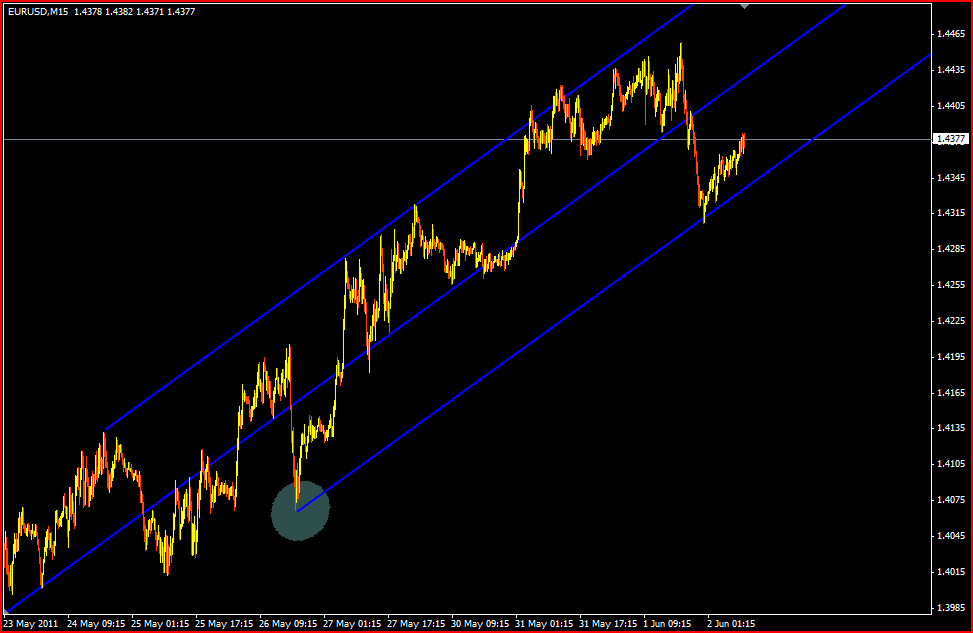
As you can see in the first picture price had been dropping, so when i saw the first
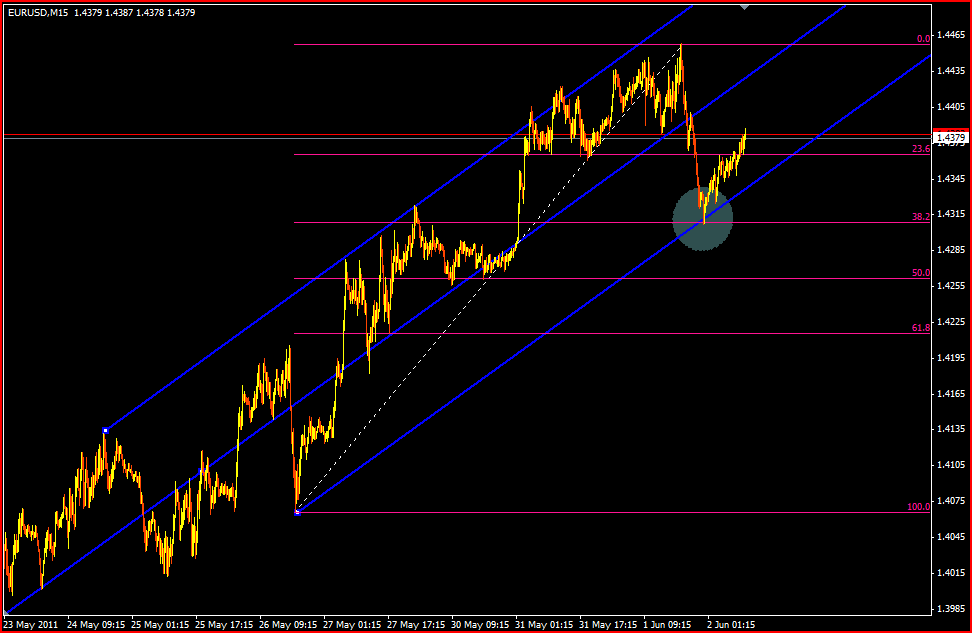
green candles i though a reversal was near so drew the fibonacci from the bottom to the top… I then believed i had hit a support level so i got long but as you can see i was wrong.
As you can see it was quite near a resistance level, but not all the way… I’ve read in the babypips school that it doesn’t have to be quite on spot but you shall rather see the areas as as areas of interest or kill-zones?? What does this mean?
Before i did the trade I must admit that i had both these scenarios in my head, that it could just be a temporary reversal and then continue the down trend…
I think my example was really alike with the one in the school
But the green candles and the wrong drawn fibonacci got me…
I was guessing that it would be a reversal, and this is dangerous in trading, however i’ve never encountered this. Until now.
What are your opinions, have i analyzed my mistake correctly?
What your seeing right there is what I touched upon in my earlier post about fibonacci retracements working a lot better in hindsight and in trading tutorials than it does in real life.
You drew your fibs correctly what you didnt do, is what most of us wish we could do, is correctly recognise the end of the price move.
If we knew where that was we wouldnt need fibs or anything else, we could just buy those bottoms and sell the tops.
I think most would agree a 3 bar reversal is not enough to go by, look over that chart see how many 3 bar reversals amounted to nothing, you need more to go by than just that, especially on the 15 minute chart.
Going back to that pitchfork thing I noticed something I should have done but I didnt at the time, I think I should have adjusted the pitchfork to accomodate when that low which dropped below the lower fork on May 26th if I had done that the current chart would look like this.
So then I thought, well if I’m going to consider that low is significant enough that I should pull the pitchfork to it, and it causes the channel to then fit the price action, maybe I should pull a fib retracement to the same low and then to the highest high …
Pretty neat huh …
just coincidence ? Probably.
Would I have traded on it had I seen it earlier ? knowing some of the things I have traded on in the past, way more unlikely than that, I probably would have lol.
I think its reasonable advice to say its worth learning all the tools and play around with them on the charts and when you see something like that, when two or more seem to agree, risk a small trade on it, had I adjusted the pitchfork to that other low earlier and seen it match up with a fib and with the overall trend, I would have risked a small lot size on it, Ive done things like that in the past and its suprising how they can work even when it is nothing like anything you read or saw anyone mention before.
EDIT:
Im kicking myself right now for not doing that earlier it would have been a great entry point after that drop earlier, especially as I had been trading the bounces on that pitchfork already, I took profit on the short when the price reached the bottom fork then lost my nerve when the price dropped right out of the channel as I had it drawn before and I didnt take a long position at all… oh well live and learn I guess …
I dont know why I’m posting all this junk on your fibonacci thread I probably should have made my own lol … apologies for the hijacking…
I guess while I’m in the advice giving mood I’ll give you my take on it all, and try to clarify the point I was making in a rather haphazard way in my previous posts.
I think of it as a game with many players, all using different trading methods, indicators, analyctics etc.
You know the price is going to go the way of the majority so you want to get as many of those players on your side as you can, this means looking at lots of different ways of trading and looking for points where different methods match up.
If you trade fibonacci only, you have the fibonacci players on your side but that is all, are they enough to control the market by themselves ? Probably not, so pull your fibs then start looking at support and resistance, when major support and resistance levels also match up with the fib levels you have the fib guys and the S&R guys on your team, now start looking at MA crossovers and other well used indicators if you can find points where several of them match up you probably have a pretty good team all trading on your side so enter at that point, or if you are already in a trade and looking for the exit, exit at that point.
Like everything else in forex that is a lot easier said than done, but I was in the mood for saying more and doing less today, so there you go lol


