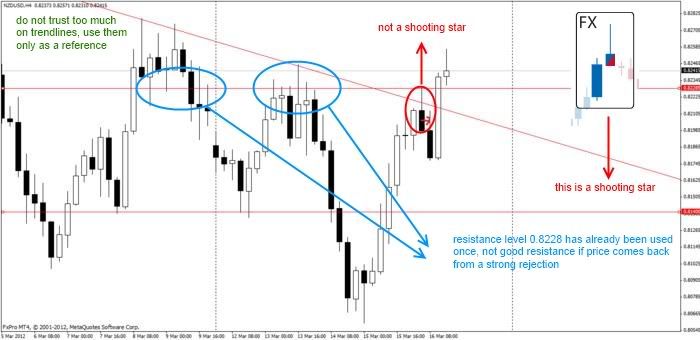
Im trading using candlesticks,trendlines and S&R’s on 4hr chart. I have entered a short trade today in NZDUSD. As you can see in the pic, it was a falling trend line and also price was rejected at the resistance level at 0.8228. and also price could not break the and formed a shooting start at the LH. I’ve entered the trade at the midpoint of the next bear candle (at the yellow mark). Take profit is at the next support level which is the horizontal red line 0.8140 and stop loss at 0.8235. Price reversed after the news of CPI and it has hit my stoploss. Well, i just wanted to know, if the strategy im following is correct or is there something else i should change ?

The price action setup you used looks good! Unfortunate you got stopped out because of the news though.
Fundamentals aside I think that it is a pretty good trade. We all see things differenty and you have looked at the chart and traded what you saw which is good. You have also kept it relativley simple as well which I personally like.
sometime you win and sometimes you lose. I also got stung on this same move today on EUR/USD so pretty much in the same boat. I was hoping the 79% fib retracement level along with the upper resistance from the day would send the price back down.
DT.
gs8888,
You could go short at that level but moving your stop at B/E quickly or taking small profits
But if you were looking for more than 40/50 pips then you are taking the wrong side of the trade.
If you trade the 4H chart you must check at least the daily chart. Never forget the top-down analysis.
I am using your chart to show some things you should consider about PA an S/D
First the candle you traded was not a bearish shooting star, the top wick should be at least 2 times the body of the candle plus the body of the shooting star has to be above the body of the previous candle
Second, the resistance level 0.8228 had already been used once, that means sell orders had been taken out of the market. if price travels south and spends a lot of time down then, when that level is revisited, maybe is a good level to go short, but if the price comes back quickly from a rejection, it is better to look for a higher level
I use trendlines but only as reference, do not trust them too much
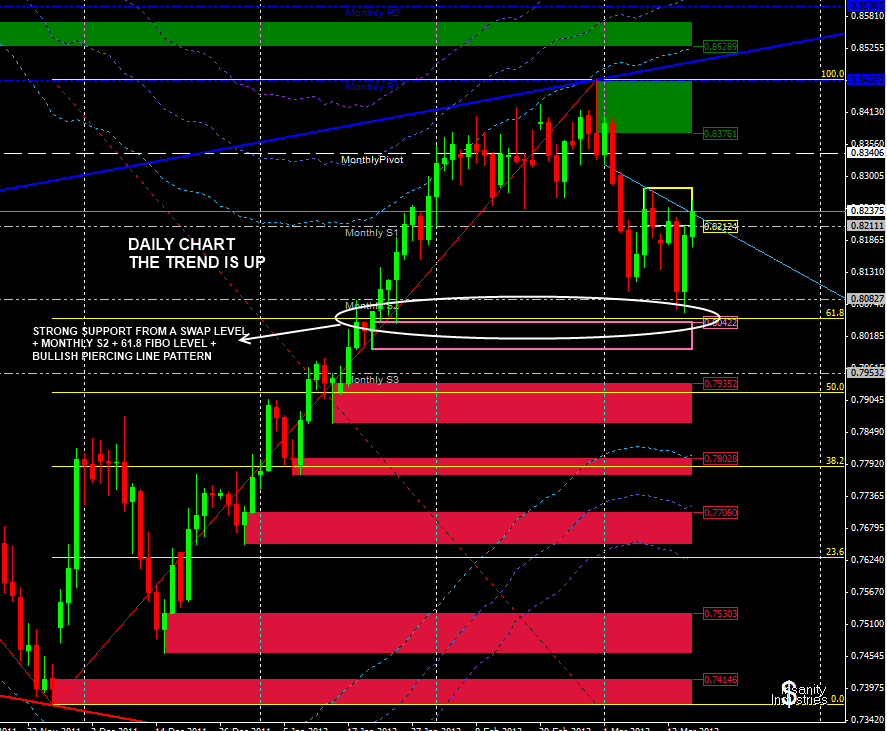
Next it is very important… the daily chart
The first thing you look for is the direction of the trend, here is up.
then you look for strong S/R levels, around 0.8050 you can find a swap level ( where resistance turns into support) nearby is monthly S2 and 61.8 fibo (0.7368-0.8469)… in that area a strong bullish piercing line pattern formed
That tell us the daily trend has not ended yet and we should look entries for going long.
Not saying that you have to go long at those levels because above we have a good consolidation area, but selling at 0.8228 with a such a big TP was a risky.
Hope this helps.
Thnq for the reply. It was really helpful. Well, i have two queries.
-
I studies that, the more times price gets rejected at a particular level, the more strong that particular support or resistance level is. So, as from the picture 6 candles tried breaking the resistance level, but couldn’t break it. So, i thought its beacuse of the news, that level is broken. Am i right this way ?
-
In ur daily chart i see that Fibs are drawn from top to bottom whereas it shud be from bottom to up in an uptrend ?
Thnq
I know some people teach that, but in the real world, S/R levels are there to be broken 
in a serious note you have to go only for the high probability trade, in S/R theory the first and second tests have the better chances to hold
it doesn’t matter since you only need the 61.8, 50, and 38.2 levels… they are the same either way
I think you done an ok job. You will develope your own trading style if you keep learning from your mistakes. Its good that you asked.
The way i look at it is like this:
Think of a resistance and support level like a concrete ceiling or floor. Each time it’s touched its like hitting the ceiling with a sledge hammer. The more times a resistance or support is touched the more likely it is to break. If it doesn’t break it just its a signal of the strength of that trend line or s & r.
The 3 peaks on that sloping trend line aren’t wide enough for my liking so i would of disregarded it.
The support level is good. It has been rejected 2 times and by its 3rd touch it was broken. Also by its 3rd touch the price has seen 2 lower highs which increased the chances of the support being broken. By its 3rd touch and on the break that could of been a short trade there. It kinda takes on an ascending triangle formation. However i still wouldn’t of taken it judging by this chart alone. So for me there are no trades on this chart.
But thats my style and my style isnt your style. But maybe you learnt something from what i said.
You on the rite track. My advise to you is follow Price action on the main forum, its all about PA on mostly daily and 4HOUR. its
basically what you looking at but more advanced.
With H4, Candles are best traded when they form a valid pullback or some other pattern.
I rarely take a trade on H4 if its a clean reversal at the changing of the hour. This is the reason why H4 candles make excellent TF to watch out for a pullback. They often end up in the same direction as the previous candle.
In your case, I would have waited for a much better candle to indicate that the buyers have weakened.
First of all, i dint check the daily TF. It was an uptrend in Daily. after i got stopped out, i relised that there was a pullback and continutaion in H1 TF which could have given me 40 pips profit. Which Timeframe is better for the entry ? 4hr or 1hr ?