Profiting from noise. Price Action Trading on tick charts

Well, looks like the mods are hard at work modifying my thread without my permission.


Just another reason why it might be time to leave. I hate censorship as much as marketers. So this idiot member “Bearish” (I’ll call him out), posted some pointless, irrelevant, mumbo jumbo, jibber jabber that he normal spews forth on my thread. In a tone most controlled for myself, I told him to begone. Yet the mod’s in their exalted position, have deemed necessary to remove these posts. Well, I’m a big boy, and am more than capable to deal with such nonsense. So please don’t!

So back to the forward test. I have reset my data and bot to trade off server time, re-calibrated and reloaded. So we are live testing on the EURUSD pair again. I have also re-adjusted myfxbook to reflect the new start date.

I am still concern about this time alignment. After speaking to my broker the change in daylight saving comes at the end of October here. My test data is set for the beginning of October. So I could be in for a world of pain again. Time of day is the most critical part of this bot and the only filter for trades. If it is mis-aligned then it will destroy all this hard work again. [B]So if anyone has any experience in aligning time in historical data to time server I would be most grateful if you can share your experience or solutions.

And now a tune for the lords of the underworld

[/B]<strong>


Hey Bob,

Great thread here, I found it searching for info regarding tick trading.

I downloaded your gift zip that you posted on there, thanks. I’ve added the market overview indicator to my charts and using it in conjunction to a scalping strategy I’ve developed it’s working really well as a filter, very impressed with the improved results.

Although it seems to be working for me in the way I’m using it, I’m not totally sure what it is I’m actually looking at! Sounds strange but also kind of in line with your way of thinking… do it your own way/find what works for you etc… Having said that I’d be really grateful if you could explain in a bit more detail how the indicator works and how you use it also.

Cheers
Oli

So glad you found a use for this indicator bro. Haven’t got much time but I’ll touch base now and explain what you are looking at.

They say a picture paints a 1000 words but here on BP is more like 250 because of quality, so I apologize first for the poor quality of the picture I will reference against


So, to start, inputs are just the one, inpPeriod. This is simply the number of bars the indicator will look back over. There are 4 buffers. Buffer 0 and 1 (which I have highlighted green and red) measure sentiment over this period. Green being bull, red being bear. The formula measures percentage wise each bar over this period comparing the body of the candle to the range (high/low) Then averages them out over the period. When bulls have control sentiment will be < 50%, when bears take over it will rise above 50%.

Buffer 2 and 3 (again lime green for bulls, magenta for bears) measure buying power. It simply’s measures the body of each candle (bulls and bears separate), sums them up over the look back period and them expresses it as a percentage of the total sum of all bodies over the period.

So how to use. Well its a trend finding indicator. In a strong bull trend, buffer 2 will be greater than buffer 0 which will be greater than 50%. In a bear run, buffer 3 will be greater than buffer 1 which in turn will be greater than 50%. I use it to determine when a trend will start.

Part of the theme of this thread is that we are trying to detect when market negotiations have stall. We will see price stall and trade in a narrow range. This indicator detects that because the buffers start intertwining themselves around the 50% line - as depleted in the picture. When the market breaks the buffers will break in the same direction. So in a bull run, you’ll first see buffer 2 break greater than 52% followed by buffer 0. The bear buffers will natural break below 48%. You then use what-ever method you are using to confirm the break and enter.


Now my work is on ticks and the 1 min chart so this is what the indicator has been developed for. The theory should hold true but for higher time frames. Also think of it as combined rsi/stoch indicator when you use it on your charts.

I hope that has helped, always here and happy to answer questions if you need more specific details.

Thanks for filling in the blanks for me Bob! Really helpful.

I use it on a 1 minute chart in conjunction with an indicator that shows volume increases by colouring the candles red or green when there is a significant increase. I look for a retraces to the 50 EMA coupled with a high volume candle close to the top/bottom of the retrace depending if I’m going short or long respectively. By analysing the buffers on your indicator I can get a much better idea if the trade is a good one or not.

If I’m going long the criteria is 0 and 2 pointing up, above the 50 mark but below 58 is the highest probability trade. With just 2 pointing up that would be one step down but still valid. If they are flat, pointing down or not both between 50 and 58 levels this invalidates the trade.


G’day bro’s and bro’ets. Being running my mouth as usual so time for an update where I’m at.

So a couple of live forward test showed how greedy I can get. Greed and speculating don’t mix. So I analysed my results, went back to the drawing board and started afresh. First thing I did was eliminate the pattern types I was looking for. Now I’m concentrating of 6 key patterns as illustrated below.


I redefined my binary rules to describe the relationships of each box and updated the knowledge base to reflect the specific patterns I’m searching for. I recompiled my test data back until Jan 2011 and ran my tests over that period (effectively double the back test period). I redefined my active trading hours to only allow trading only when the following conditions where met, a) less than 10 trades taken - 70% win rate, 10-20 trades 65%, >20 trades 60%.

I’ve also added in bounces of these levels. Where as traditional I look for breaks, many of these breaks can be fakeys and simply reverse. Here is the current trade on picking a top at the end of a bull run on the UJ


and closed in profit

Might as well take advantage of this fact. Final trick, limited the pairs to just 2, my beloved EU and added in the UJ.

And the bot is up and running again for just over a week. As usual here’s the fxbook link BRAB JailBreak System by forexbob70 | Myfxbook and results

So far so good. Been interesting watching it in action over the past couple of weeks. As we know there is a level of inverse correlation with this two pairs. And the market hours and direction are matching up according. So hopefully that’s a good sign. I’ve got the risk set at 1%. But that’s because of the small capital assigned to this live test. Also because of this small size it doesn’t allow for proper MM to be used. Even though risk is set at 1%, trades can range from 0.75% to near 2% in range because of the small pip movement I am chasing. This can greatly distort the profit factor at the end of the day.

So much more work to be done still. Currently resetting my data back to Jan 2005 for back testing. First I want to see if the system can hold true over a much larger period of time. I suspect it won’t.

The theory I’m implying is that even though the market scum and educators would like us to believe the markets are 24 hours, the reality is it’s not. From what I understand 80% of the markets participants ( ie the banks) conducted their business within the first hour of business local time. Not server time from our broker, not GMT. Which goes back to one of my original beliefs, the same players, play the same markets at the same time leaving evidence of PA on our charts. This evidence is probably (my opinion) more valid in the past 5 years with the advent of more automated trading. At least 75% of all transactions are computer generated these days. And since banks trade to balance inventory (cash) not speculate we can use this fact more to our advantage than 5 or 10 years ago - evolving to market conditions.

So thats about all I have to dribble on about now. I see the bot has just said that could well be the end of that little pullback, lets see if I can lose that money just made with a long order.


We’ll see in a few minutes!

Happy pip hunting all

Bob


The market giveth and the market take awayth. Such is life


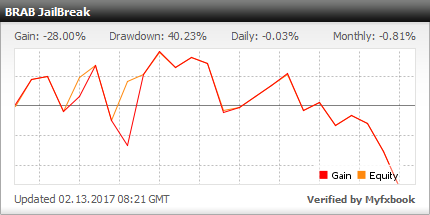
Oh how good does it feel to be home. Duckin fantastic.

Hello tick chart traders and lovers of pure price action. Seems like we have a population of pantie wearing want-a-be’s polluting the forum at the moment so time to step things up. Also good to know who your friends are.

First an update. Still haven’t automatized the system yet but it has evolved as a discretionary system. Also, thanks to @Lexys, I have studied Ross Hook patterns and added them to my arsenal of tool. Which is what I wish to share with you all today.

Now remember, this is all designed to work off tick charts. But, it will also work on a 1min, 5min, 30min and daily charts. Of course I can’t be bothered pissng around with them when I can be in and out of a tick chart leaving me with plenty of time to play golf, kick the kids and upset pantie wearing conservatives here on babypips.

So what have we got. First up is a Bot. Its what’s called a Trade Panel or Dashboard. When trading manually and discretionary on tick charts you don’t have a lot of time to make decisions. One needs all the information to make ones trade decisions at hand. Thanks to the good people over at fx1.net they have release some freeware called mt4gui. A graphic user interface allowing one to turn MT4 into a more powerful tool. Actually I only like their buttons and check boxes but the freeware has one more powerful feature. It produces ticks internally allow the user to turn MT4 strategy tester into a manual trade environment. Much better than paper testing or ForexTester.

This is what it looks like up and running

First panel on the far right is my market management panel. It gathers all the details and information I need to place and enter a trade. Once a trade is entered, a second panel pops up. This panel gathers all the information I need to actively manage a trade. The bot also draws my beloved boxes.

Just on these boxes. while researching I discovered a gentleman called Nicolas Darvas. He loved his boxes as well but used them in a very different but well documented way. Do take the time yourself to research him.

Next up the first of two indicators. This is one I built myself and is a liquidity indicator. IT WILL ONLY WORK ON A TICK CHART. Price movement on your chart between levels “usually” (used very loosely) starts with and finishes with increased market activity i.e. increased liquidity. We also need a liquid market to ensure our order gets filled at the price we want and to ensure the price will move sufficient to generate a return.Looks a little something like this

Now also on this image is the Ross Hook indicator. This indicator was built by fxdaytrader over at forexfactory as freeware. I have modified the code to the extent that I have removed the alerts. I find the indicator fantastic on a tick chart as it not only provides confirmation for entries off boxes but provides a general trend direction as well. For those unfamiliar with Ross Hook patterns I have also included a very detail PDF explaining the pattern.

Please note Candlestick traders, the Ross Hook is a price action pattern. Blow your candlesticks out your wa-zoo.

So here’s the package.
Bobs Magic Boxes.zip (3.7 MB)
I have organized it so extraction into the appropriate folders is self explanatory.

And thats about that. We’ll see if we can fire off a few trades during the week.

Love price action. Love tick charts. Love those boxes. Hate candlestick traders that call it PA trading.

2 Likes

Here we go first trade of the day.

Nothing really specific to report here except I recognize this price action on a Monday morning at Singapore Open.

The only thing I don’t like about this trade is that it has to break through the 1.18 level. Not to worry. It’s moved in my favor, stop loss has been moved to break even and liquidity is on the sell side. Batter up!

1 Like

So closed this one out. Price bounced of the 1.18 level. Made a nice little 1.19% of it. Live to trade another day.

Make a bit, add a bit, wash, rinse, repeat.

1 Like

Ok so second trade for the day. Broken the 1.18 level. Liquidity seems to be bearish. Plenty of room for the price to continue south. I’m reentering short. Risking 2% on a 1:2 risk/reward. Coming up to London open so have to watch for a fakey.

1 Like

Well got that one wrong. But maybe it was me showing off.

Post trade analysis shows a few mistakes. First big one, trading around a round number ie 1.1800. Next low volatility on a Monday. Third, beating my chest here. Forth time in trade. There could also be a dumb placement of the stop loss but time will tell on that one.

Now, I could have gotton out six times from this trade. Being Monday I probably should have recognized the first finishing volume demonstrated in the liquidity indicator and exited. Then the market gave 4 more exit points to break even at. Finally a reversal signal.

Somehow I feel that this might turn into a low volatility Monday or at least during my waking hours. So I’ll stay out for the rest of the day. Own my decision, accept, learn, move on.

Now who can I go upset!

1 Like

Great to see you showing your box trades here, Bob. I know these are very dear to your heart and that you have put an incredible amount of work into these.

Obviously, tick trading is not for everyone, and each has to find what works for them. (As you know, I am moving out into the other direction towards daily charts). But I really hope this works out as it is something quite different to the usual stuff we see about trading forex.

I also always appreciate people showing their honesty by putting up the losers as well as the winners!

Although I don’t normally look to trade Monday mornings at all, there is sometimes some immediate follow-through from the Asian session and, like you, I tested the downside. But after a period of total non-movement decided to close it and made a humongously huge 2 pip profit to start the week! Is there anyone more simple than Simon, I have to ask! :smiley:

1 Like

Can’t all be winners my friend. The first sign of a charlatan especially here on babypips is you only see post trade analysis of winners. I plan (like in the rest of my thread) to post all my trades this week for documentation purposes. Then, like the revolving door of babypips members probably drift away into obscurity.

Why do people fail at trading, well, they follow the herd and do what everybody else is doing. Never been a follower.

It was a very quite Monday. 39 pip range straddling a round number. No good for the cash machine. Lets hope for a more trending Tuesday.

1 Like

Here we go folks. Bit of a delay between when I took this trade but you get that. First my bias is bearish on the EURUSD. If I had not been so greedy an thought about my stoploss a bit more yesterday then my loser would of been a winner.

Next, this pair has slipped into a tight range over the past 5 hrs of 21 pips. However it keeps testing the lower range and doesn’t seem to be able to recover to form a higher high. So I’ve entered short on a box break.

Again what looks like a tight stop just follows my rules. If the trade fails I’ll look to re-enter but I will need a confirmation signal. At this time of day one has to remember that USD borrowers become active for the next 2 hours and these dollars have to be converted to the mother currency. If so I will get stopped out but it should also mean I’ll get a better entry and risk reward ratio if my bias is correct.

Time to sit back and enjoy the ride. Now where’s that abandon baby with their hammer.

Just had to add to this trade

How deep is the river’s bottom???

Welcome to the club, I understand some prop desks are at the same place. GOOOOO CATALONIA

The Ever Profiting Off Turmoil VIPER

1 Like

Ok, Locking in profits.

Where I am it’s time for bed. Looks like there could be some finishing liquidity here. But getting the extra trade in was a bonus and I don’t want to lose what profit I made, which was 3%. Tomorrow is a new day and more opportunities are to be had.

So while others are zooming in and out of time frames, looking for rejection bars ,dicking with pin bars, buying in valleys and spewing forth the same old same old some of us are just doing.

2 Likes

Good night, sleep tight and don’t let the Platypus bite.

The Ever Wishing Well From NC VIPER

1 Like

Well, sun’s up. Quick check of the chart. Looks like lessons learn from Monday paid off and I exited these trades at a perfect point

Today’s agenda, I have to met Adam and Adam to beat them up with a big stick.

1 Like

I see from the PDF you are a big fan of Joe Ross. I am working my way through his literature, also on recommendation of that lass Lexys