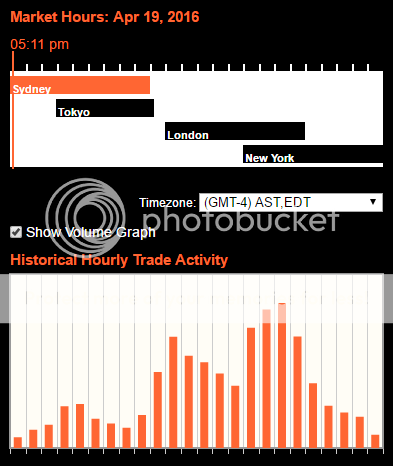
Since I first began to learn about the forex market, I have understood trading sessions to be the times of day when various major trading centers are active. According to this view, it all starts in New Zealand, sometime in the early morning (New Zealand time), and ends in the U.S., sometime in the late afternoon (New York time). I’ve always looked at it this way, because that’s how it was taught to me 11 years ago.
I’m now throwing all that out.
The important thing about trading sessions is [I]not[/I] when the Sydney market overlaps the Tokyo market, or when the big banks open in Frankfurt, or when the stock exchange opens in London, or when the futures market opens in the U.S. I think we can forget about all of that, and we can forget about trying to define [I]normal business hours[/I] in the major trading centers.
What I’ve thought, and said on this forum, for years about [I]opening[/I] and [I]closing[/I] times in various forex markets has been, at best, only a rough approximation of what the market is actually doing. Individual forex markets — Asia, Europe, North America — don’t [I]open[/I] or [I]close,[/I] except over the weekend.
Instead, they ebb and flow, as they continue to operate 24 hours per day.
So, the way to define trading sessions is to chart this ebb and flow, and let the opening and closing times fall where they will, without regard to the business or cultural patterns of life in all the countries where forex trading is brisk.
How do we chart the ebb and flow of trading activity? I submit that [I]liquidity is the driver that makes everything happen in this market[/I] (or in any market), and there is a simple way to track liquidity. (More on this in post #3.) Furthermore, we can identify repeating patterns of rising and falling liquidity over the 24-hour trading day — and these patterns tell us how the market has [I]organized itself[/I] into trading sessions.
There are four of these liquidity-driven trading sessions in a typical trading day, beginning and ending at 5pm (New York time) each day, except Saturday. These trading sessions could simply be numbered from 1 through 4. But, they overlap the 3 trading sessions in a conventional Tokyo/London/New York trading-session system [I]closely enough[/I] that it’s convenient to use those labels.
Here are the four trading sessions which I believe best show how the market has organized itself:
[U]Session[/U]
[U]Tokyo time[/U]
[U]London time[/U]
[U]New York time[/U]


Tokyo Session
6am - 3pm
10pm - 7am
5pm - 2am


London Morning Session
3pm - 8pm
7am - 12pm
2am - 7am


London / New York Overlap Session
8pm - 1am
12pm - 5pm
7am - 12pm


New York Afternoon Session
1am - 6am
5pm - 10pm
12pm - 5pm
The table above shows current trading session times, corresponding to northern hemisphere summertime, when both London and New York are on Daylight Saving Time.
The next post will show the Trading Sessions on 2 charts: (1) a chart for northern hemisphere summer, corresponding to the times shown in the table above, and (2) a chart for northern hemisphere winter, with Tokyo times adjusted for the 1-hour shift in the start of the trading day at the end of Daylight Saving Time.
The third post in this thread will be a discussion of liquidity, price movement, and volume, as those metrics relate to constructing the Trading Session charts.
.


 thanks for the great effort!


