Metals took a strong dip in New York Session. Asian session saw some retrace and expect retrace to continue before bears settle in. For intraday trades, keep your Longs Short, and be patient to place your Shorts.
Our outlook for Silver and a look at its technical disect
In addition to that, Our Aud/Usd Trade of yesterday missed the stop loss by a mere 2 pips and went to hit our TP 1 in the early Asian session today giving us + 20 pips.
Here’s an interesting look at the chart.
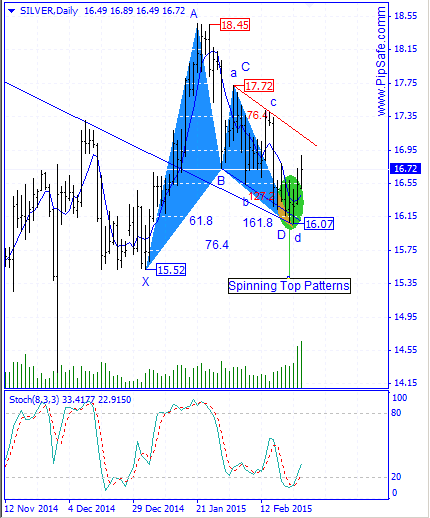
Silver was in a descending trend from the top price of 18.45 that could record the bottom price of 16.07. Right now this bottom price is fixed by the next ascending candles and is the next nearest supportive level. If this supportive level breaks , the price will have the potential of reaching to the important supportive level of 16.00.
As it is obvious in the picture below, there is a harmonic Gartley pattern between the bottom price of 15.52 and the top price of 18.45 that there is a potential for changing price direction from D point of this pattern.Stoch indicator confirms the ascending trend in this time frame and warns its possibility.Currently the first sign for Sellers is breaking of the D point of harmonic pattern in the price chart.
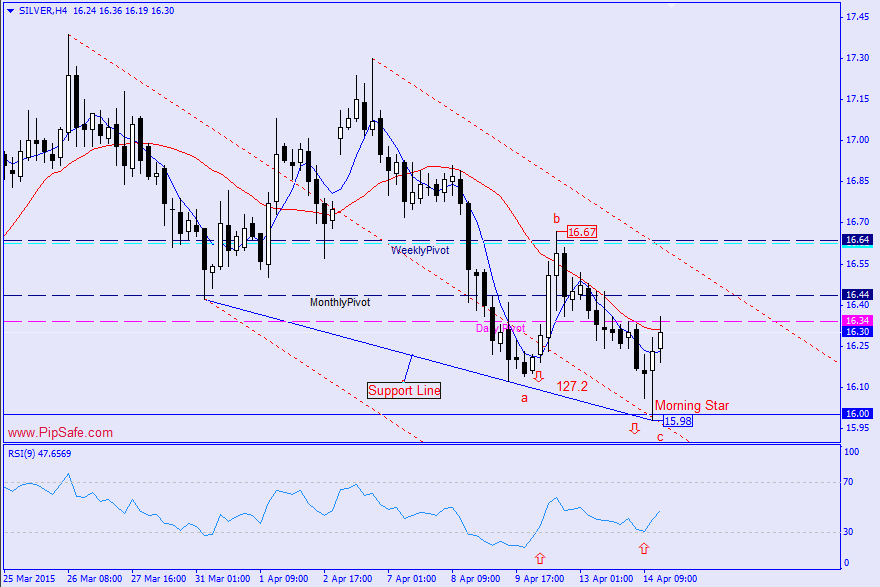
Silver chart has experienced a descending trend during the recent day that could record the bottom price of 15.98.Price during the descending has touched the Support line (made of 2 bottom prices) and also the round supportive level of 16.00 and has created the morning star candlestick pattern. Closing of the bullish candle after this pattern will confirm it and warns about ascending of price.
As it is obvious in the picture below, between the top price of 16.67 and bottom price of 15.98 there is ABC harmonic pattern with ratio of 127.2 that warns the potential of ascending from the C point of this pattern. RSI indicator is in saturation sell area in H4 time frame and in divergence mode with the price chart that warns about changing price direction during the next candles.Generally until the bottom price of 16.00 is preserved, there is a potential for price reformation in this Metal.