Ok, see that blue rectangle on the chart. This is the lowest price EURNZD ever got to this millennium. From there we went on to make higher highs…I think we just caught a significant bounce at its very early stages. It is also a good time fundamentally; we normally see a EUR squeeze after the ECB and the bank of New Zealand just said its open to lowering rates, turning from hawkish to neutral.
Personally I’m buying at the open of the next daily candle, my stop will be a few pips below the low at 1.47462. Profit target is, there is no profit target, I will let it run for two or three weeks.
It is worth noting that in the chart I shared, RSI and price diverged on the second high. I expect price to fall back to 1.5259. So for those who prefer to place orders.
Buy at 1.5259, stops at 1.47462. Move the stop loss to breakeven when price hits 1.5826. Profit target 1.6000
So you risk 50 pips to make 80. It is paramount you use good money management. Risk only 1% per trade. Use Babypips position size calculator for this.
NB: this is my first post in “show me the money” so I lack credibility obviously. So may be you’d like to keep an eye on this trade and sticking around for other recommendations if you like what you see.
My trading style and your are of course going to be totally different so do not let my analysis shake you at all but if you are a looking at short term I would be a little more sell heavy than long heavy.
With my method of measurement that market look like it is due for a drop, which is to say it look like an artificial high to me.
Well as I mentioned in the opening I expect price to fall to 1.5259 triggering the entry before moving stop loss to breakeven at 1.5826. I will hold the position beyond the 1.6 area I marked as a profit target (because I cut losers short and let winners run.) My stop loss is at 1.47462.
So far nothing has happened with the trade, my entry wasn’t triggered, my stop loss wasn’t reached and it hasn’t reached any of my target. I will report with a chart once any of those happen (probably next week).
I discussed the possibility of a bottom in EURNZD and suggested going long. While it sounds a crazy idea, the of such trade is that it offers you very limited downside in exchange of a massive upside. That law in the picture is the lowest this pair got in the 21st century. If the pair makes a new low I’m out of the trade.
My limit order was at 1.5259. You see the pair falling towards the entry. The pair double-bottomed there and is now rallying a bit. Now this is a good sign because it tell us the trend is still bullish. You’ll notice the entry coincides with a 50% retracement of the latest upmove. This tells us that the bullish trend is of medium strength. I’m gonna hold this long until at least 1.6.
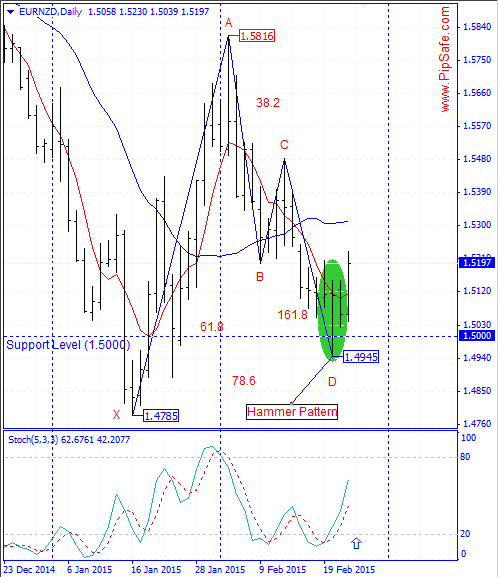
EUR/NZD was in a strong and consistent downtrend during the recent days that Sellers were successful in obtaining the lowest price of 1.4945.price with reaching to the important round level of 1.5000 has stopped from more descend ( Sellers used this level to exit their trades) and with formation of a bottom price in daily time frame has prepared a field for ascending of price.price in daily time frame created hammer candle stick pattern in bottom price of 1.4945 and has provided ascending of price and stop loss of price.
As it is obvious in the picture below, there is a harmonic Gartley pattern between the bottom price of 1.4945 and the top price of 1.5816 that there is a potential for changing price direction from D point of this pattern.Stoch indicator is in saturation sell area in daily time frame and it warns the potential for ascending of the price according to the next cycle.Generally according to the formed signs in price chart, until the bottom price of 1.4945 is preserved; price will have the potential for increasing and ascend.
There has been lots of potential reversal signals that have all failed. EURNZD kept ranging with EURUSD and broke down with it. We are really low now, but the last daily candle is very strong, with a bearish breaking of the range and breaking of two fiblines (,786 and,886). I will look to sell into rallies. We got three resistances roughly at 1,49, 1,495 and 1,5. Three places to look for short. If we break back 1,5, then I will think long again.
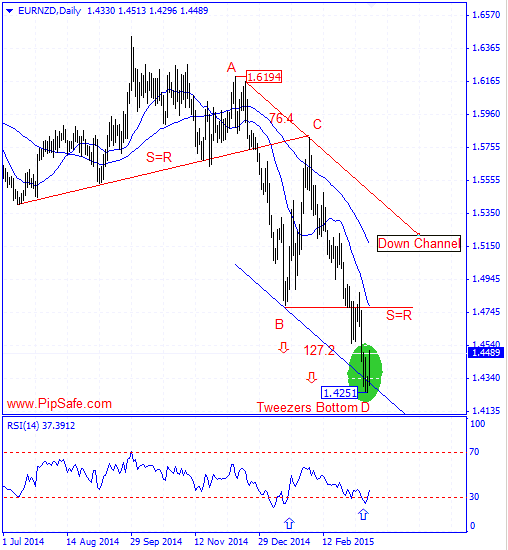
EUR/NZD was in a strong and consistent downtrend during the recent months that Sellers were successful in obtaining the lowest price of 1.4251. According to the previous day changes, previous week candle was closed as Tweezers Bottom(with hammer pattern) candlestick pattern which shows vulnerability of descending trend and potential for formation of a bottom price in this range.As it is obvious in the picture below, between the top price of 1.6194 and bottom price of 1.4251 there is AB=CD harmonic pattern with ratios of 76.8 and 127.2 that warns the potential of ascending from the D point of this pattern.
RSI indicator is in saturation Sell area in daily time frame and in divergence mode with the price chart that warns about changing price direction during the next days.Generally according to the current situation, until the bottom price of 1.4251 is preserved, there is the potential for ascending of price and reformation of descending trend.
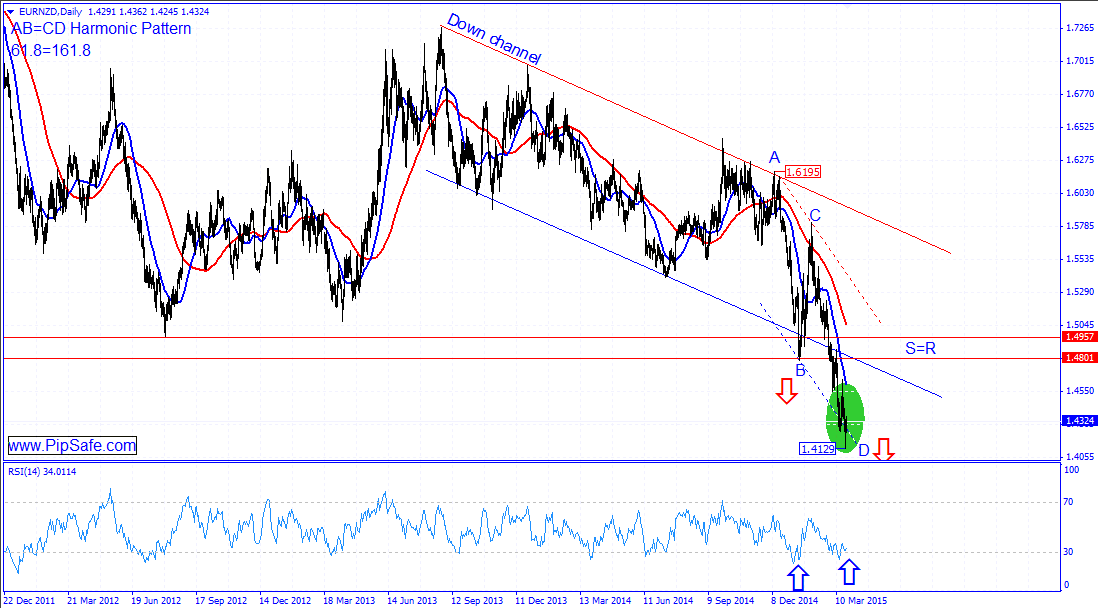
EUR/NZD during the recent week was in a strong downtrend that Sellers were successful in achieving the lowest price of 1.4129 .Right now the price is in the lowest prices in the recorded history and generally in long term interval according to the bottom price of 1.4129 and other factors, it has a good potential for ascending.Currently price at daily time frame has formed Hammer candlestick pattern (To notice this candlestick pattern, there is a need to closure of a descending candle) that shows the first warning signals for the formation of a bottom price.
As it is obvious in the picture below, between the bottom price of 1.4129 and top price of 1.6195, there is an AB=CD harmonic pattern with ideal ratios of 61.8 and 161.8 which warns about ascending of the price from the D point of this pattern.RSI indicator is in saturation sell area and in divergence mode with the price chart confirms the mentioned bottom price and warns about changing price direction.Generally according to the current situation, if the bottom price of 1.4129 records, the price will have the potential in reaching to the S=R .