SPX Elliott Wave View: Mature Cycle
Short Term Elliott Wave view in SPX suggests the rally from 3/27 low (2322.2) is unfolding as a leading diagonal Elliott Wave structure where Minute wave ((i)) ended at 2378.36, Minute wave ((ii)) ended at 2328.95, Minute wave ((iii)) ended at 2398.16, and Minute wave ((iv)) ended at 2379.75. The Index has broken above previous Minute wave ((iii)) and thus it has met the minimum requirement in the number of swing to end cycle from 3/27 low as a leading diagonal. However, while near term pullbacks stay above 2380, further upside in one more leg still can’t be ruled out before cycle from 3/27 low ends. Near term, Minute wave (v) is proposed to be unfolding as a zigzag Elliott Wave structure where Minutte wave (a) ended at 2403.8 and Minutte wave (b) ended at 2392.4. While pullbacks stay above 2392.4, and more importantly above 2380, Index has scope to extend one more leg higher. We don’t like selling the Index.
SPX 1 Hour Elliott Wave Chart 05/10/2017
SPX Elliott Wave View: Near Pullback
Short Term Elliott Wave view in SPX suggests the rally from 3/27 low (2322.2) is unfolding as a leading diagonal Elliott Wave structure where Minute wave ((i)) ended at 2378.36, Minute wave ((ii)) ended at 2328.95, Minute wave ((iii)) ended at 2398.16, and Minute wave ((iv)) ended at 2379.75. The Index has broken above previous Minute wave ((iii)) and thus it has met the minimum requirement in the number of swing to end cycle from 3/27 low as a leading diagonal. Although the cycle from 3/27 low is already mature, another leg higher can’t be ruled out as far as pullbacks stay above 2380. Near term, Minute wave (v) is proposed to be unfolding as a zigzag Elliott Wave structure where Minutte wave (a) ended at 2403.8 and Minutte wave (b) ended at 2392.4. While pullbacks stay above 2392.4, and more importantly above 2380, Index has scope to extend one more leg higher. We don’t like selling the Index and chasing the last leg higher here is also a bit risky. Expect cycle from 3/27 low to end soon with or without one more leg higher and Index to do larger degree pullback in 3, 7, or 11 swing to correct cycle from 3/27 low before the rally resumes.
SPX 1 Hour Elliott Wave Chart 05/11/2017
SPX Elliott Wave View: Pull back started
Short Term Elliott Wave view in SPX suggests the rally from 3/27 low (2322.2) ended at 2403 as a leading diagonal Elliott Wave structure where Minute wave ((i)) ended at 2378.3, Minute wave ((ii)) ended at 2328.95, Minute wave ((iii)) ended at 2398.16, Minute wave ((iv)) ended at 2379.75, and Minute wave ((v)) of A ended at 2403. Near term, while bounces remain below there expect the Index to pull back in larger degree 3, 7, or 11 swings to correct cycle from 3/27 low before the rally resumes again. We don’t like selling the Index and expect buyers to appear after 7 or 11 swings pull back for extension higher. This view remains valid as far as pivot at 3/27 (2322.2) low remains intact.
SPX 1 Hour Elliott Wave Chart 05/12/2017
ES_F Elliott Wave View: Ending Impulse
Short Term Elliott Wave view in ES_F suggests the rally to 2403.75 ended Minor wave A. Minor wave B unfolded as an Expanded Flat Elliott Wave structure where Minute wave ((a)) ended at 2379, Minute wave ((b)) ended at 2404.5, and Minute wave (©) of B ended at 2344.5. After ending the pullback, the Index started a new leg higher and the rally from 2344.5 low looks to be unfolding as a 5 waves Elliott Wave impulse structure where Minutte wave (i) ended at 2375, Minutte wave (ii) ended at 2361, Minutte wave (iii) ended at 2388 and Minutte wave (iv) ended at 2378. Minutte wave (v) is in progress and the Index has scope to extend higher towards 2404.2 – 2410.5 area and this last push higher should also end Minutte wave (a).
Once Minutte wave (a) is complete, the Index is expected to pullback within Minutte wave (b) in 3, 7, or 11 swing to correct cycle from 5/18 low (2344.7) before the rally resumes again. Ideally the last push higher in Minutte wave (v) of (a) breaks above the previous peak at 2404.5 as a break above that level will give confirmation that the Index has started the next leg higher. If Minutte wave (a) can end above 2404.5, there’s a better chance that Minutte wave (b) pullback can hold above 2344.7 for the next leg higher. We don’t like selling the proposed pullback and expect buyers to appear again once Minutte wave (b) pullback is complete at later stage, provided that pivot at 2344.7 low remains intact.
ES_F 1 Hour Elliott Wave Chart 05/24/2017
ES_F Index Elliott Wave: Resuming Higher
Short Term Elliott Wave view in ES_F Index suggests the rally to 2403.75 ended Minor wave A. Minor wave B unfolded as an Expanded Flat Elliott Wave structure where Minute wave ((a)) ended at 2379, Minute wave ((b)) ended at 2404.5, and Minute wave (©) of B ended at 2344.5. After ending the pullback, the Index started a new leg higher and the rally from 2344.5 low looks to be unfolding as a 5 waves Elliott Wave impulse structure where Minutte wave (i) ended at 2375, Minutte wave (ii) ended at 2361, and Minutte wave (iii) is proposed complete at 2411.25. Expect Minutte wave (iv) pullback to commence soon to correct cycle from 5/19 low before turning higher one more time to end Minutte wave (v). This last push higher will also complete larger degree Minute wave ((i)).
Once Minute wave ((i)) is complete, the Index should pullback within Minute wave ((ii)) in 3, 7, or 11 swing to correct cycle from 5/18 low (2344.7) before the rally resumes again. As the Index has broken above the previous peak at 2404.5, it gives more conviction that the Index has started the next leg higher and thus pullback can likely hold above 2344.7 for more upside. We don’t like selling the proposed pullback and expect buyers to appear again once Minute wave ((ii)) pullback is complete at later stage, provided that pivot at 2344.7 low remains intact.
ES_F E-Mini S&P500 Elliott Wave: Ending wave (iii)
Short Term Elliott Wave view in ES_F E-Mini S&P500 suggests the rally to 2403.75 ended Minor wave A. Minor wave B unfolded as an Expanded Flat Elliott Wave structure where Minute wave ((a)) ended at 2379, Minute wave ((b)) ended at 2404.5, and Minute wave (©) of B ended at 2344.5. After ending the pullback, the Index started a new leg higher and the rally from 2344.5 low looks to be unfolding as a 5 waves Elliott Wave impulse structure where Minutte wave (i) ended at 2375, Minutte wave (ii) ended at 2361, and Minutte wave (iii) remains in progress and can reach 2423.13 or 161.8% fibonacci extension of Minutte wave (i). Expect Minutte wave (iv) pullback to start once Minutte wave (iii) is over before turning higher one more leg in Minutte wave (v). This last push higher will also complete larger degree Minute wave ((i)) and as impulse, it should be accompanied with momentum divergence.
Once Minute wave ((i)) is complete, the Index should pullback within Minute wave ((ii)) in 3, 7, or 11 swing to correct cycle from 5/18 low (2344.7) before the rally resumes again. As ES_F E-Mini S&P500 has broken above the previous peak at 2404.5, it gives more conviction that the Index has started the next leg higher and thus pullback can likely hold above 2344.7 for more upside. We don’t like selling the proposed pullback and expect buyers to appear again once Minute wave ((ii)) pullback is complete at later stage, provided that pivot at 2344.7 low remains intact.
ES_F E-Mini S&P500 1 Hour Elliott Wave Chart 05/26/017
Very interesting. Im not into elliot wave, but I enjoy gaining insight into other traders view points and strategies. Thank you for sharing
1 Like
SPX Elliott wave view: Showing impulse
Short term SPX Elliott Wave view suggests the rally from 5/18 low (2352.7) to 6/19 peak (2453.8) ended Minor wave 3. The pullback from 2453.8 to 2405.70 on 6/29 low ended Minor wave 4. Up from there, the rally is unfolding as an impulse Elliott Wave structure with extension. This 5 waves move could be Minute wave ((a)) of an Elliott wave zigzag structure where Minute wave ((i)) ended at 2431 and Minute wave ((ii)) ended at 2407.7.
Minute wave ((iii)) is subdivided into another impulsive waves of a smaller degree. Minutte wave (i) ended at 2432, Minutte wave (ii) ended at 2412.8 and Minutte wave (iii) ended at 2463.5. Below from there Minutte wave (iv) ended at 2450.34 and above from there Minutte wave v of ((iii) is in progress towards 2466.82-2471.8 area. Afterwards, the Index should pullback in Minute wave ((iv)) before further upside, provided that pivot at 2405.70 low remains intact.
In case of further extension in Minutte wave (v) of ((iii)), the index could extend to (v)=(i) target area at 2474.7-2480.4 before a turn in Minute wave ((iv)) happens. If the pullback turns out to be rather strong then the Index could already end the cycle from 6/29 low (2405.7) as an Elliottwave Flat structure, and it should then correct the cycle from 6/29 low before the rally resumes. We don’t like selling the Index and favors more upside as far as pivot at 2405.70 low remains intact.
SPX 1 Hour Elliott Wave Chart
SPX500 Bullish Elliott Wave Sequence
SPX500 move up from 3/27 (2322) low is proposed to be unfolding as a double three Elliott wave structure when rally to 6/19 (2453) completed wave W and dip to 6/29 (2405.74) completed wave X. Up from there, Index rallied in 5 waves to 7/27 (2484) which completed wave ((a)) of Y and now the Index is showing 5 swings up from 3/27 low. 5 swings is an incomplete sequence and calls for more upside to complete 7 swings sequence. Index is currently in wave ((b)) correcting the cycle from 2405.74 low. This pull back is expected to unfold as a zig-zag Elliott wave pattern and while below 7/31 (2477), SPX500 has scope to trade lower towards 2453.73 – 2438.81 area to complete wave ((b)). From this area, SPX500 should turn higher to resume the rally in wave (©) of Y towards 2537 – 2568 area or bounce in three waves at least. In case the bounce from the above mentioned area fails to make a new high, then Index could turn lower and do a 7 swings pull back in wave ((b)) before starting wave (©) higher. We don’t like selling the Index and favor buying the dip towards 2453.73 – 2438.81 area looking for a target of 2537 area or a 3 waves bounce at least to get into a risk free position.
SPX500 4 Hour Elliott Wave Chart
SPX500 Potential buying area
SPX Bounce from the 8/21 lows is Impulsive
Hi fellow traders. The $SPX Bounce from the 8/21 lows is impulsive as the title suggests and does display the usual characteristic traits of an Elliott Wave impulse. Looking back previously before this 8/21 date, the stock index is within an obvious uptrend in multiple degrees. For purpose of this particular blog we are mainly focused upon this particular time frame in four hours up from that aforementioned 8/21 low. The point is to try to tell and show what to look for ideally happening in the near term to help get a shorter term trader in position to capitalize on the pending and conditional dip that can be seen correcting the uptrend cycle from the 8/21 lows. That is to identify the area the wave (4) pullback can reach. Longer term traders and investors should be able to stand back and enjoy the benefit on being long in the uptrend.
That being said, the dip to 2566 from the 2597 highs of 11/7 , coupled with other correlated instruments was strong enough in our system to suggest it was correcting the cycle from the 8/21 wave (2) lows. The one condition mentioned above is there is an ongoing bounce in wave X shown in the graphic chart below that currently shows an equal legs extension area at 2594 where it may or not reach or as well it can even exceed. What the bounce will need to do is fail below the 11/7 highs at 2597 and turn lower for another swing below 2566 otherwise there is a risk that the wave (3) is extending higher. This is very common for an Elliott Wave three of any degree to extend with the trend and is just another reason a trader should not trade into a correction against the trend. If the dip materializes as proposed then great, buy into it and join the uptrend on the right side of the market.
Finally and back to what the point here is identifying the area the wave (4) dip can reach is as per the following. After the proposed wave X ends and it breaks below 2566 again, a measurement from the wave (3) highs of 11/7 down to the 2566 lows then up to the wave X highs will give the equal legs to 1.236 extension area for the dip in wave Y of (4). The Fibonacci extension will usually be more precise as compared to the usual Fibonacci retracement area in a wave four. As it stands now while below the 11/7 highs a typical wave four will retrace .236 to .382 of a wave three. That area comes in at the 2554-2528 region.
SPX Elliott Wave View: Further Weaknesses Likely
SPX Elliott Wave view suggests rally to 2801.90 on 3/13/2018 ended Primary wave ((X)). Decline from there is unfolding as a double three Elliott Wave structure where Intermediate wave (W) ended at 2585.89 and Intermediate wave (X) ended at 2674.22. Subdivision of Intermediate wave (W) unfolded as another double three of a lower degree where Minor wave W ended at 2694.59, Minor wave X ended at 2739.14, and Minor wave Y of (W) ended at 2585.89. Subdivision of Intermediate wave (X) unfolded as a zigzag Elliott Wave structure where Minor wave A ended at 2639.26, Minor wave B ended at 2601.81, and Minor wave C of (X) ended at 2676.54.
Intermediate wave (Y) is currently in progress as a zigzag Elliott Wave structure. A zigzag is a 5-3-5 Elliott Wave structure with ABC label. The subdivision of wave A is in 5 waves and the subdivision of wave C is also in 5 waves. In the case of SPX, decline from 2676.54 is unfolding as 5 waves impulse Elliott Wave structure where Minute wave ((i)) ended at 2593.06, Minute wave ((ii)) ended at 2659.07, Minute wave ((iii)) ended at 2553.80, and Minute wave ((iv)) is proposed complete at 2586.38.
Expect Index to extend lower 1 more time to end Minute wave ((v)) towards 2509.45 – 2540.78 and this next leg lower should also complete Minor wave A of a zigzag from 3.28.2018 high (2676.54). Afterwards, expect Index to bounce in Minor wave B in 3, 7, or 11 swing to correct cycle from 3.28.2018 high before the decline resumes. We don’t like buying the Index.
SPX Elliott Wave 1 Hour Chart
SPX: The Index Within Areas Where The Hedging Is Calling a Pullback
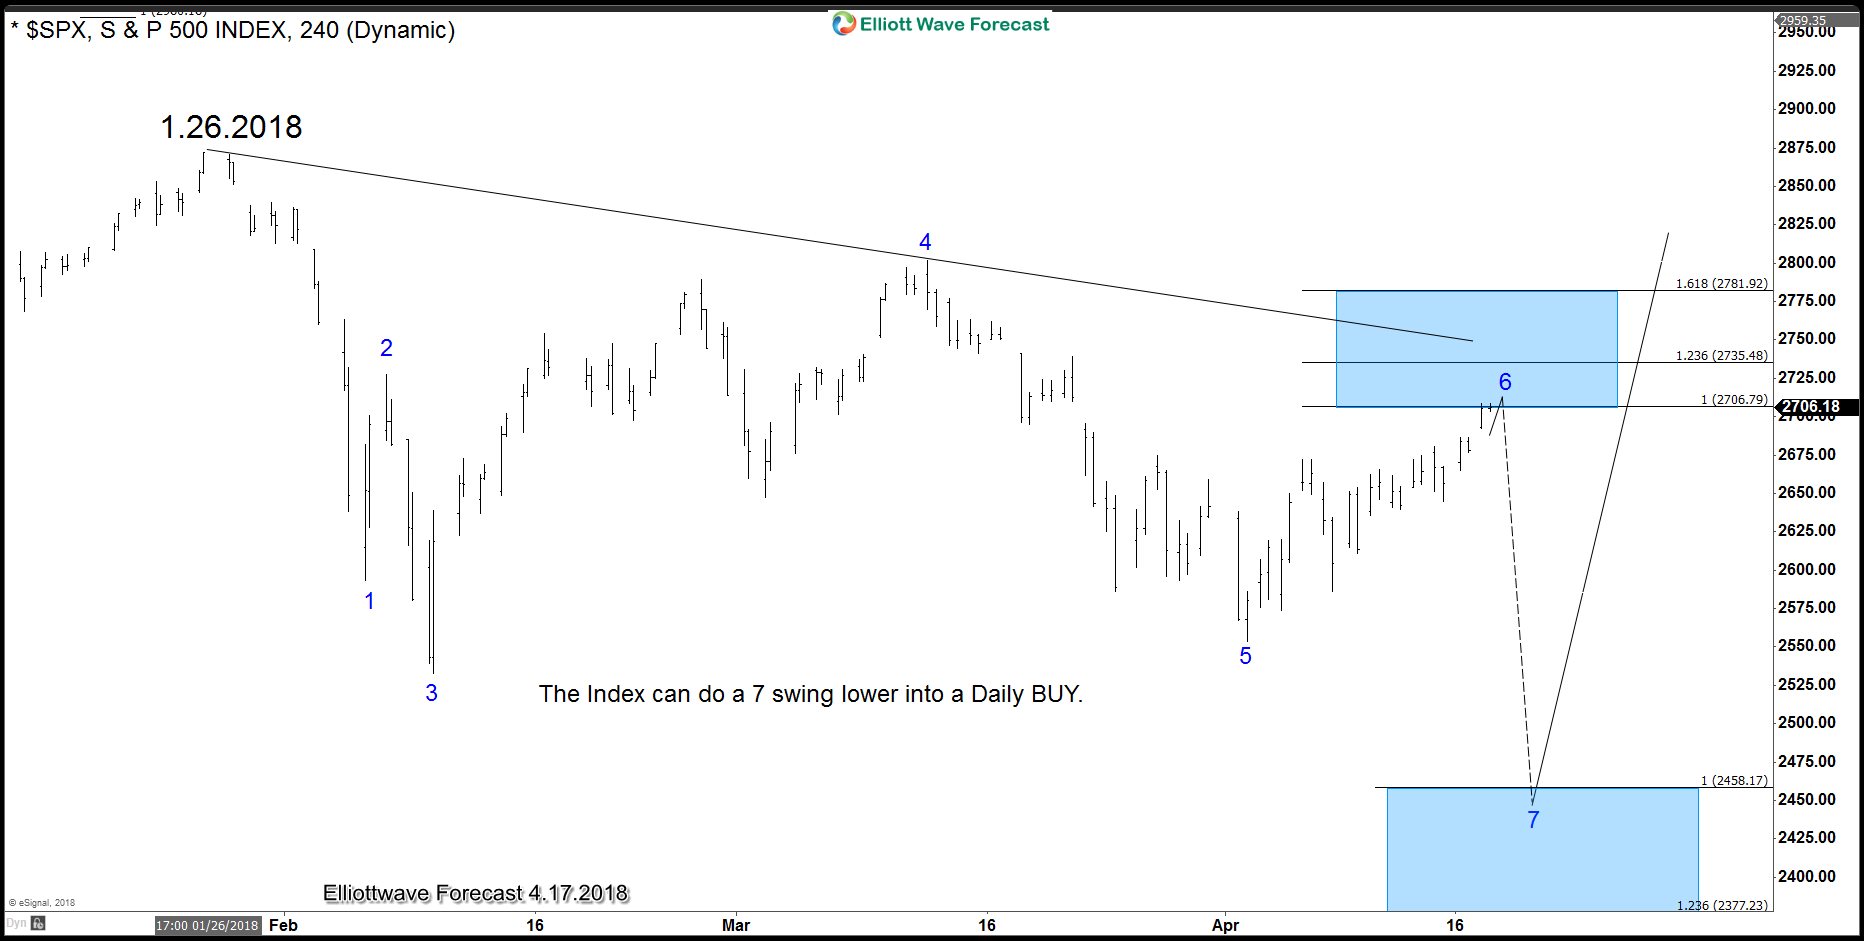
The $SPX trend is to the upside but the Index ended the cycle from 2.2016 and like every other Index, it is correcting that cycle. In Elliott Wave Theory, corrections run in the sequences of 3-7-11 swings and consequently trading against the main trend which is to the upside is always risky. We do understand the Market Nature and we are able to see all possible paths or possibilities a Market can do. The Index is reaching the Blue Box from the low at 4.2.2018 and soon it should pullback in 3 waves into a definition of the higher degree trend. The move from 4.2.2018 is a 15 minutes cycle and the Market is combination of time frames. We are currently presenting to members the scenario which takes the Index to 2461 but we do not see any bearish sequences calling lower so we do not recommend selling, otherwise we recommend waiting for the market to reach the extreme to buy or create a short-term bearish sequence before selling intra-day bounces. If reaction lower from the blue box manages to break below April low, that would create a 15 minute bearish sequence down from 3.13.2018 peak.
The Following chart is showing the cycle from 4.2.2018 and consequently the Blue Box in 15 minutes.
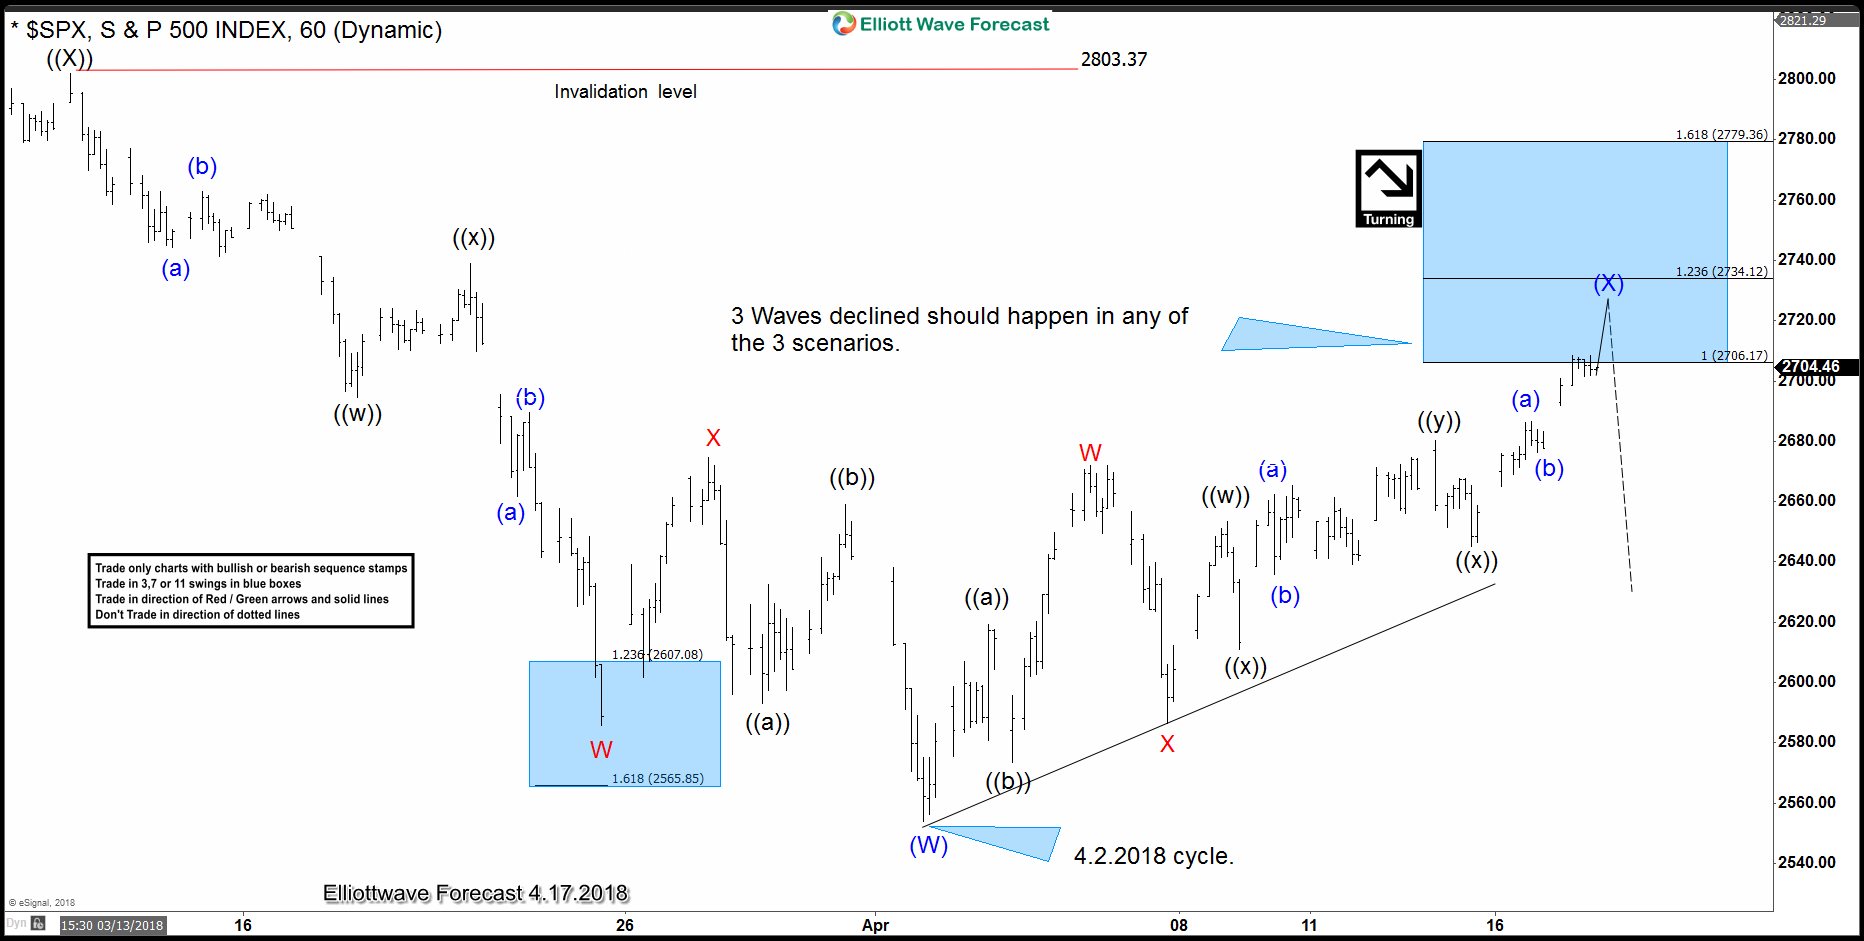
- The Index reaches our area (Blue Box) to end a corrective cycle from 4.2.2018 and then consequently will extend lower into a 4 Hour extreme since peak at 3.13.2018, this is the most Bearish scenario and should provide a nice area to go long around 2461.
- The $SPX Index reaches our area (Blue Box) in which 3 waves from 4.2.2018 ends and instead of breaking lower into 2461 area, the Index remain trapped between 2.9.2018 low and 3.13.2018 peak creating either a Bullish or Bearish triangle.
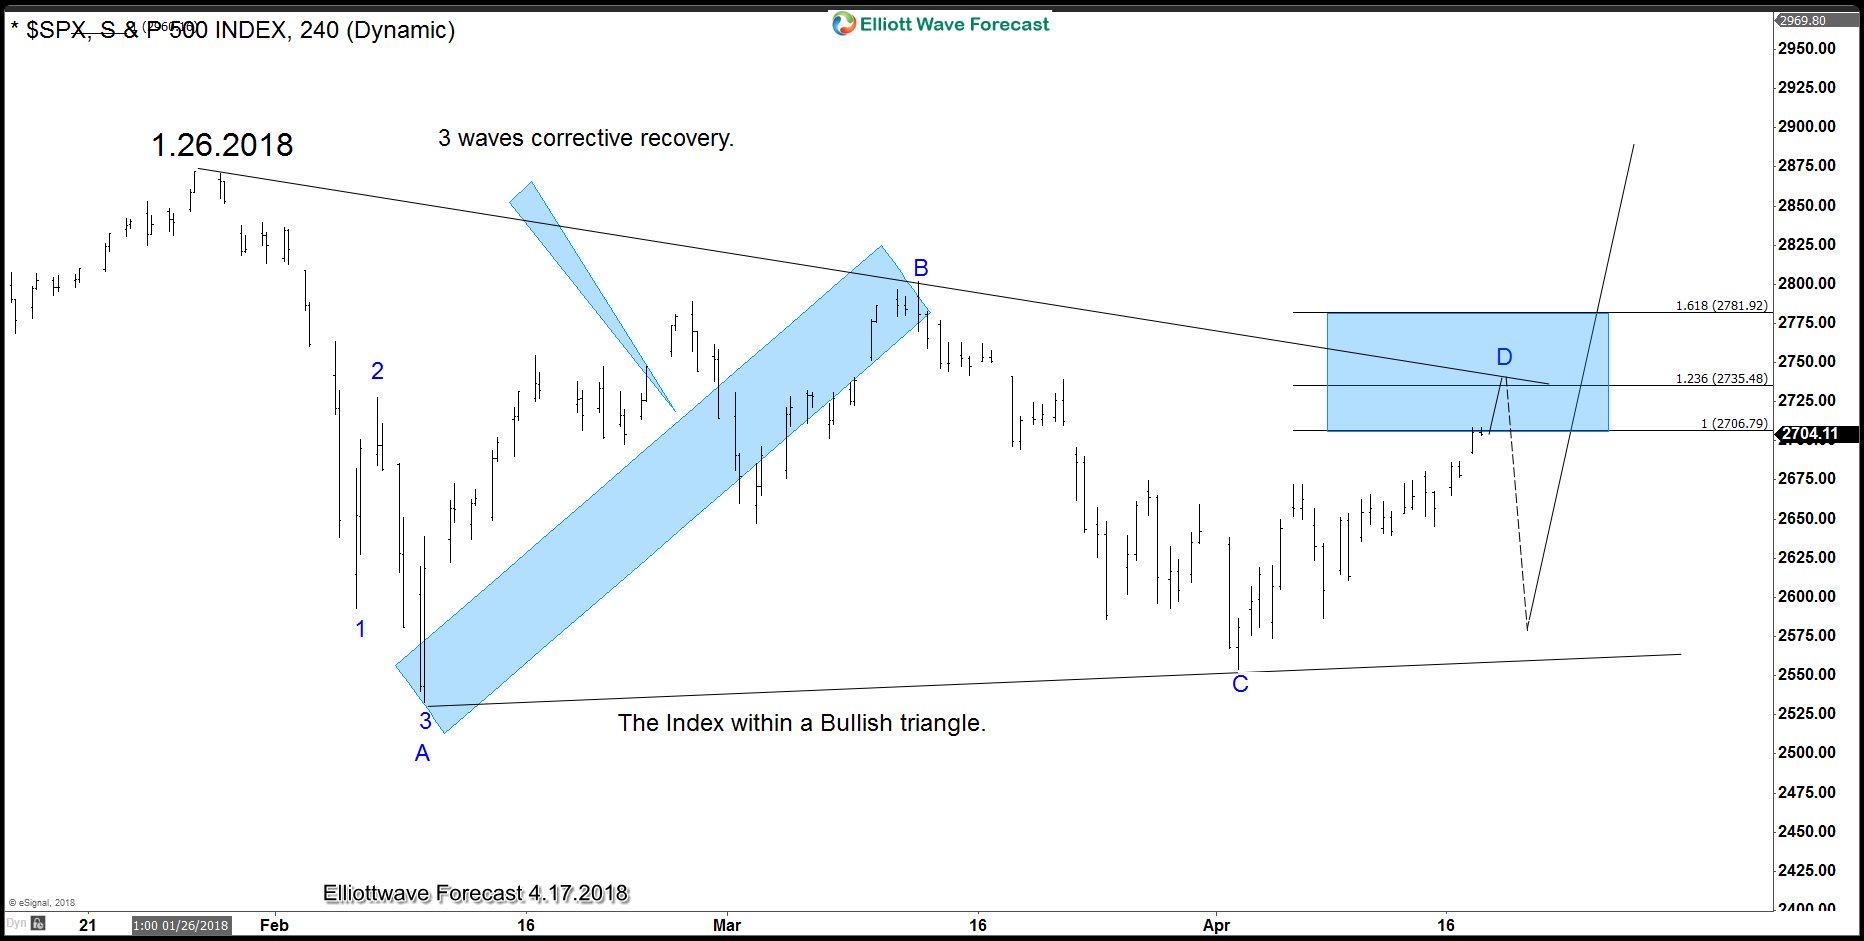
- The $SPX Index reaches our area (Blue Box) in which 3 waves from 4.2.2018 ends and pullback in 3 waves, then rally into 2822 in which case either become a Bullish triangle or renew of the higher degree trend.
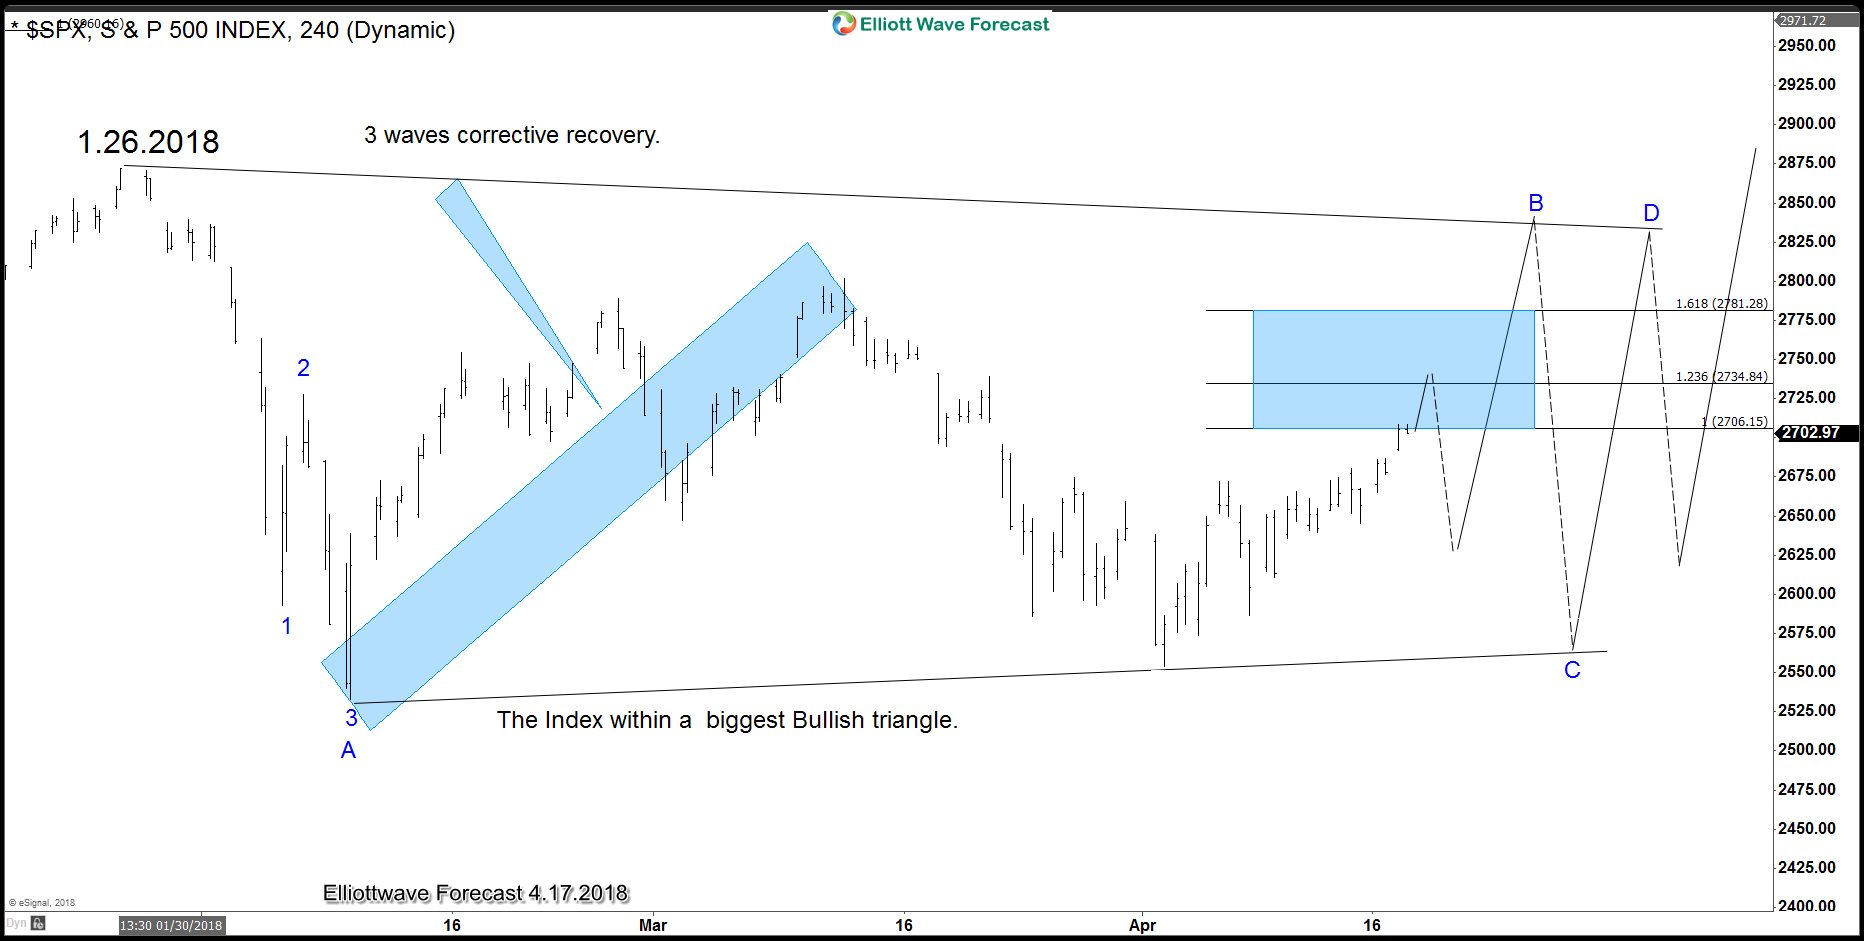
As we can see the Market is calling for a pullback from the area between 2706-2779. We do understand the Nature of the Market and always educate members to wait for the extremes and then trade with the trend, consequently even when Elliott wave hedging now is calling a pullback, the Market needs to clear the path and define which scenario is playing out. The declined from 2706-2779 area will defined the path and consequently better opportunities will present in the near future, waiting and understanding the nature of the structure sometimes is better than guessing.
SPX Elliott Wave Analysis: Close To A Pullback?
SPX short-term Elliott wave view suggests that the rally from 4/02/2018 low (2553.8) is extending higher in 5 waves structure. These 5 waves are expected to be part of a leading diagonal structure within intermediate wave (1) higher. The move higher from 2553.8 low has the characteristic of a diagonal where the internal distribution of each leg higher shows sub-division of 3 waves and there’s an overlap between Minor wave 1 & 4 .
The internals of a rally from 2553.8 low ended Minor wave 1 at 2717.49 in 3 waves corrective sequence. Down from there, the pullback to 2594.62 low ended Minor wave 2 as Elliott wave double three structure. Above from there, the rally to 2742.1 high ended Minor wave 3 as Elliott Wave Zigzag structure. Below from there, the pullback to 2676.81 low ended Minor wave 4 as zigzag structure. Near-term focus remains towards 2752.9 – 2765.33, which is 100%-123.6% Fibonacci extension area of Minute wave ((a))-((b)) to end Minor wave 5. The move higher should also complete the cycle from 4/02/2018 low (2553.8) within Intermediate wave (1). Afterwards, the index is expected to do a pullback in Intermediate wave (2) and expected to find buyers in 3, 7 or 11 swings for further upside. We don’t like selling the index.
SPX 1 Hour Elliott Wave Chart
Intraday Elliott Wave Analysis: SPX Due for Pullback Soon
SPX short-term Elliott wave view suggests that the rally to 2742.24 high ended Minor wave 3 as Elliott wave impulse. Below from there the pullback to 2676.81 on 5/29/2018 low ended Minor wave 4 as Zigzag structure. Up from there, Minor wave 5 rally is unfolding as impulse Elliott wave structure with extension in 3rd wave higher. As an impulse, the internal subdivisions of Minute degree wave ((i)), ((iii)) and ((v)) should unfold as 5 waves structure. On the other hand, the corrective Minute degree wave ((ii)) & ((iv)) should unfold in any 3 wave corrective sequence i.e double three, triple, flats etc.
The first leg of the rally from Minor wave 4 at 2676.81 low ended Minute wave ((i)) as 5 waves structure at 2729.34. Then the pullback to 2700.88 low ended Minute wave ((ii). Above from there, the index rallied higher in extended Minute wave ((iii)) which ended at 2790.21 high. Down from there, Minute wave ((iv)) pullback looks complete at 2778.78 low and index can now see the last push higher towards 2801.31-2820.07 area before ending Minor wave 5. The last push higher should also complete Intermediate wave (1). Afterwards, the index is expected to do an intermediate wave (2) pullback in 3, 7 or 11 swings to correct cycle from April 3 low before further upside is seen. We don’t like selling the proposed pullback.
SPX 1 Hour Elliott Wave Chart
SPX Elliott Wave Analysis: Calling Correction Lower
SPX short-term Elliott wave analysis suggests that the rally from 4/02/2018 low to $2792.25 ended the intermediate wave (1). Down from there, correction against that cycle remains in progress in 3, 7 or 11 swing structure. Also, it’s important to note here that the decline from $2792.25 peak shows an overlapping price action thus suggesting that the correction is taking place in a corrective manner i.e either Double three or Triple three structure.
Down from $2792.25, Minor wave W unfolded as a double three structure with a combination of 3,3,3 swings in each leg. Minute wave ((w)) of W ended at $2743.10, Minute wave ((x)) of W ended at $2774.86 and Minute wave ((y)) of W ended at $2698.67 low. Up from there, Minor wave X bounce remains in progress to correct cycle from 6/13 high ($2792.25) as a Zigzag structure where Minute wave ((a)) ended at $2746.09 and Minute wave ((b)) remains in progress as a running triangle structure. Near-term focus remains towards $2745.32-$2756.36, which is the 50%-61.8% Fibonacci retracement area of the cycle coming from $2792.25 high to complete Minute wave (©) of X. Afterwards, the index is expected to continue lower in Minor wave Y to correct cycle from 4/02/2018 low. We don’t like selling the proposed pullback.
SPX 1 Hour Elliott Wave Chart
SPX Elliott Wave Analysis: Buying Opportunity Soon
SPX Short-term Elliott Wave analysis suggests that the pullback to $2691.80 low on 6.28.2018 ended intermediate wave (2). Above from there, the rally higher to $2848.03 peak ended Minor wave 1. The internals of that rally higher took the form as impulse Elliott wave structure where Minute wave ((i)), ((ii)) & ((iii)) unfolded in 5 waves structure & wave ((ii)) & ((iv)) unfolded in 3 swings corrective sequence.
Up from $2691.8 low, the rally higher to $2743.26 high ended Minute wave ((i)) in 5 waves. The pullback to $2698.95 ended Minute wave ((ii)) and the rally higher to $2804.53 high ended Minute wave ((iii)) as 5 wave structure. From there, Minute wave ((iv)) pullback ended at $2789.24 low and the rally higher to $2848.03 peak ended Minute wave ((v)) which also completed Minor wave 1.
The Index is now correcting cycle from 6.28.2018 low within wave 2 in 3, 7 or 11 swings before further upside is seen. Near-term focus remains towards $2783.14-$2759.10, which is 100%-161.8% Fibonacci extension area of ((w))-((x)) to end the 3 swings pullback in Minor wave 2. Buyers should appear from the above area either for new highs or for 3 waves reaction higher at least. We don’t like selling it.
SPX 1 Hour Elliott Wave Chart
S&P500 Mini Futures: Extending Higher As Impulse
S&P500 Mini Futures ticker symbol: $ES_F short-term Elliott wave view suggests that the decline to $2803.34 low ended Minor wave 4 pullback. The internals of that pullback unfolded as Elliott wave zigzag correction. The lesser degree Minute wave ((a)) ended in 5 waves at $2820.5 low. Then the bounce to $2843.50 high ended Minute wave ((b)) bounce as a Flat correction. Down from there, the index completed the Minute wave (©) in another 5 waves at $2803.34 low.
Up from there, the rally higher is taking place as impulse structure with lesser degree cycles showing sub-division of 5 waves structure in each leg higher. It’s also important to note here that index is already into new all-time highs & both the sequence & right side tags are calling index for more upside. Above from $2803.34 low, the minute wave ((i)) ended in lesser degree 5 waves structure at $2874 high. The pullback to $2846.25 low ended Minute wave ((ii)). A rally from there unfolding in another 5 waves structure within Minute wave ((iii)) with lesser degree cycles in Minutte wave (i), (iii) & (v) expected to unfold in 5 waves structure. We don’t like selling the index and expect buyers to appear in 3, 7 or 11 swings against $2803.34 low in the first degree.
S&P500 Mini Futures 1 Hour Elliott Wave Chart
The SPX Index is trading within a Blue Box in our system, these boxes are areas in which the Market needs to define whether it will become an Impulsive sequence which runs in 5-9-13 waves or corrective sequence in which runs in 3-7-11 waves. Many traders who follow The Elliott wave Theory understand the idea of 5 waves followed by 3 waves back as shown in the following chart.
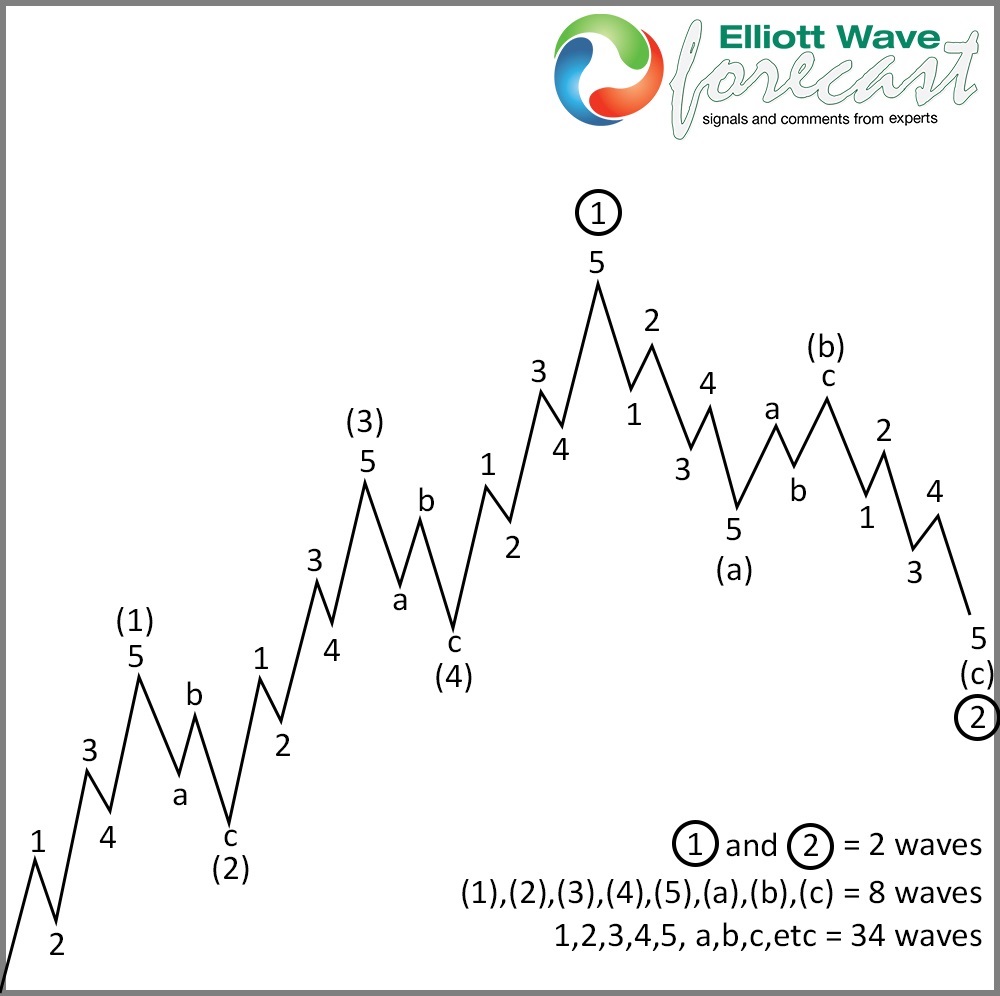
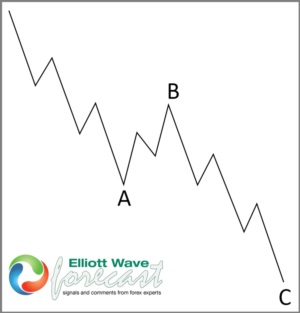
An impulse is 3 advances of 5 waves and 2 pullbacks in 3 waves which make a total of 5 swings. On the other hand, an ABC structure only shows 2 advances of 5 waves and one pullback in 3 waves. It is shown in the following chart.
The difference between an Impulse and ABC is the extension within wave (III) which the SPX Index is not showing at this moment. We are an Elliott Wave Forecasting company but we have developed many other techniques that we use in our analysis and one of them is called the Blue Box system which is based on high-frequency trading. Market is not the same as it was back in 1930’s and hence Elliott Wave needs adjustment in current times. Consequently, we developed a system with rules which we added to the Elliott Wave’s basic rules which are available at our website. For us, it is really simple, as far as price is above the 100% extension of the first leg i.e. (a) / ( ( I ) related to ( b ) / (II ) but below the 1.618 extension of the same two points, the Market is within a twilight area. In this area, either side could end up being a winner. The following chart shows the Grand Supercycle of the S&P 500 Index which is showing a possible ABC structure and the Grand Supercycle Blue Box area.
SPX Quarterly Elliott Wave Analysis 11/27/18
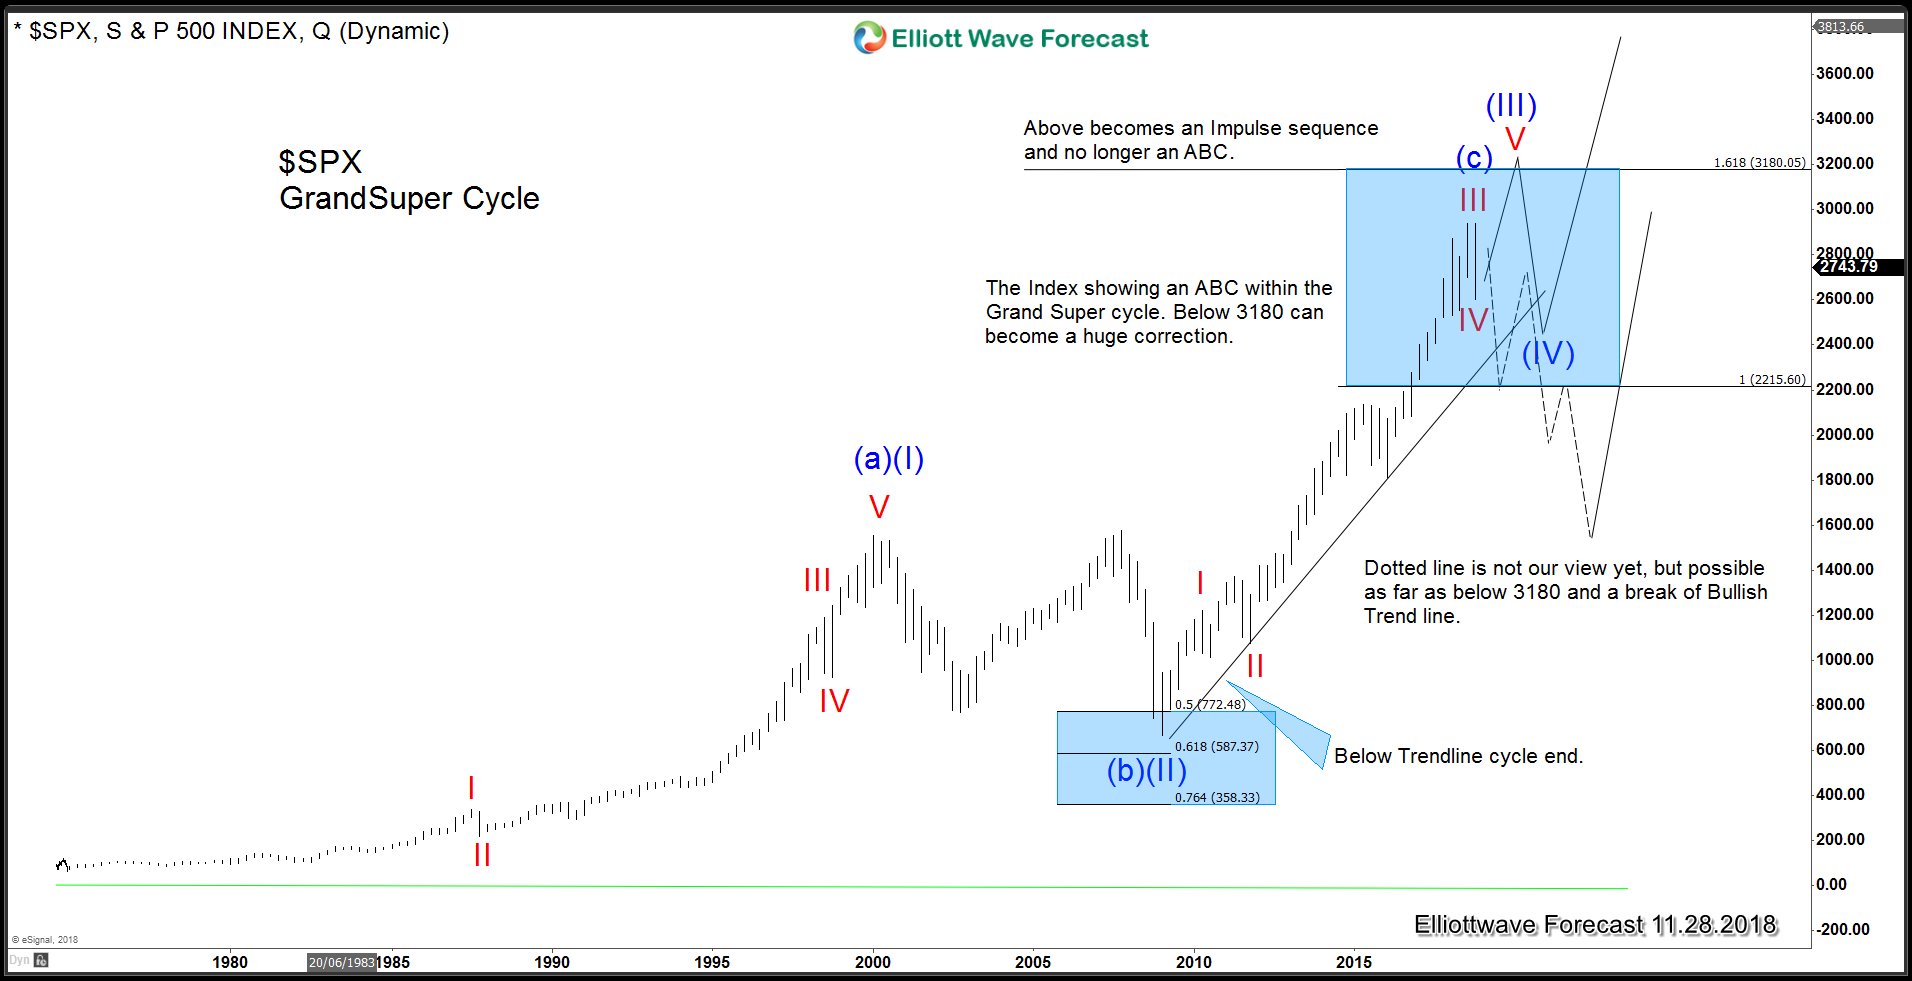
We do understand that the market makers need to decide in which direction we are heading. Whether we are going to trade above the 3180 area or correct the Grand Super cycle which should be a similar correction to the one from 2000-2009. In that case, a huge peak has been reached. At this moment the Index is trading below the 1.618 Fibonacci extension which is at 3180 but still holding above the trend line from 2009 lows which means we can still be within the powerful wave (III) and finally break the Blue Box to the upside, as shown in the following chart and that is our current view as well.
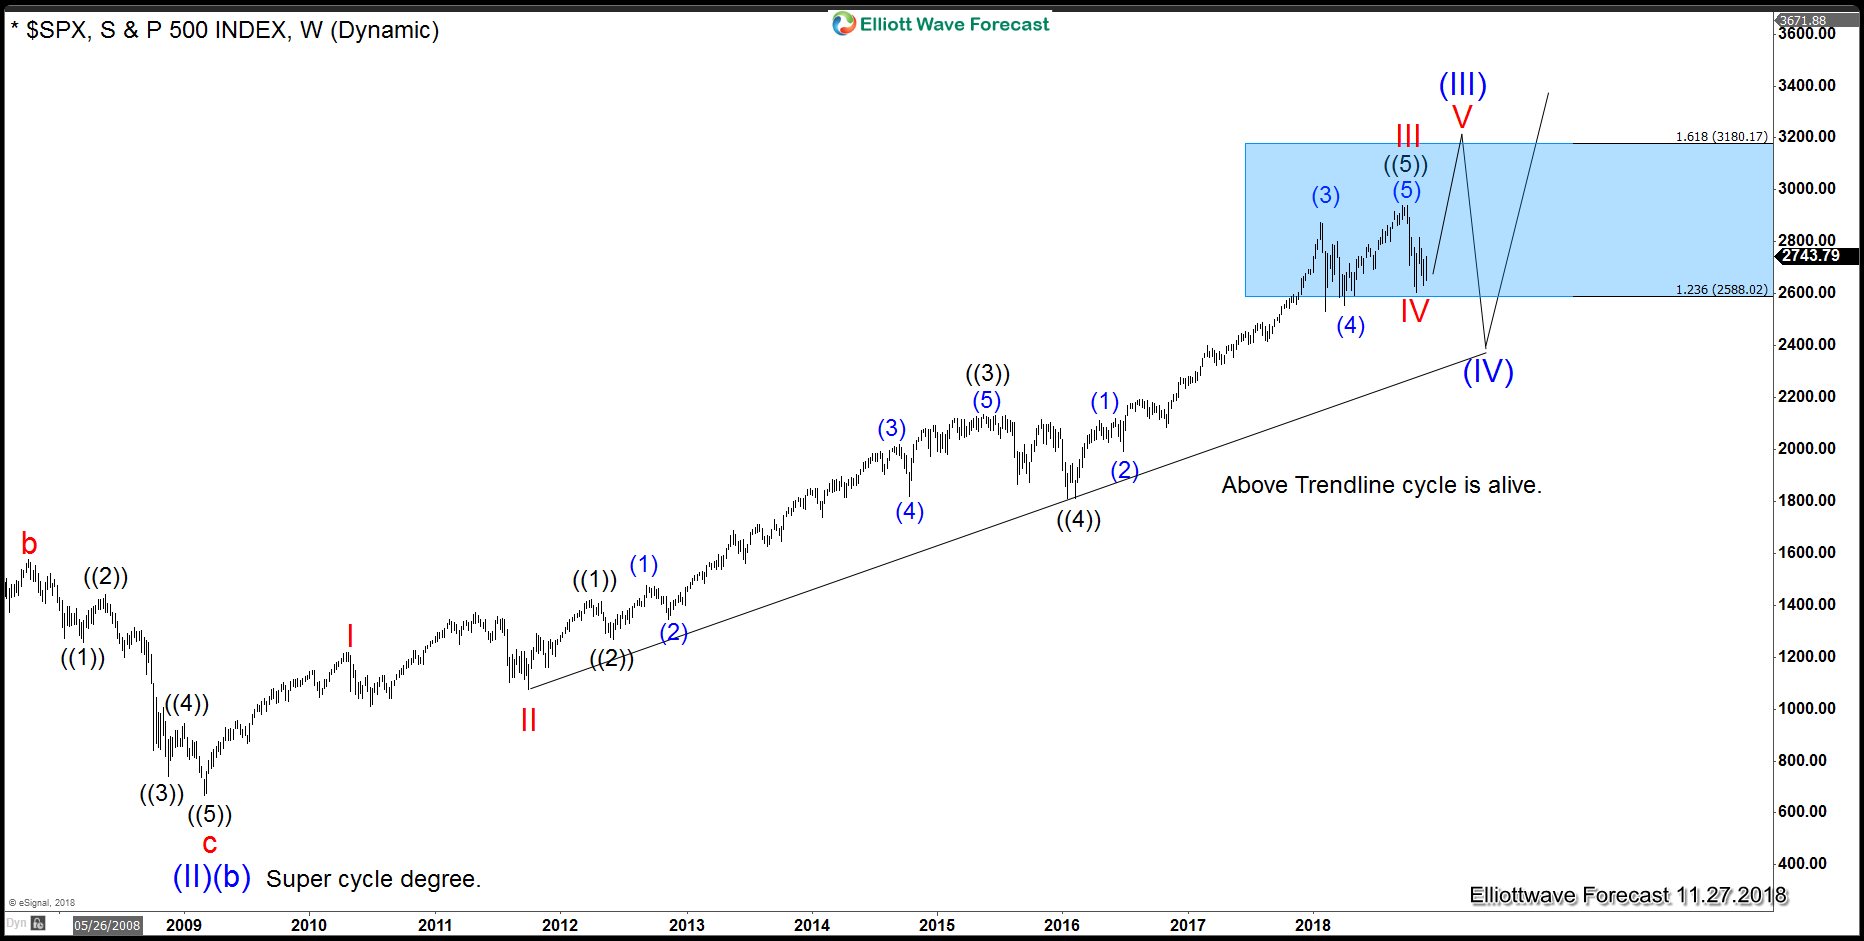
As we always do, we do not forecast tops or bottom at Elliottwave-Forecast but we always understand the areas in which we are trading. We have been recommending trading the long side since 2010 and we still recommend the long. But with caution and always in the sequence of 3-7-11 swings which is the corrective sequence of the Market. All we got is an ABC from the all-time lows into the blue box within the Grand Supercycle and Bulls need to extend the Supercycle degree from 2009 to break the 3180. Then the Market will extend in a series of (IV) and (V). There is no question that we are in dangerous times but knowing the nature will help an investor to navigate in such choppy waters where either side can make the case for a victory. Let’s see who is stronger and will win. So far the bulls are still in control and nothing in price and distribution is calling that the Grand supercycle has ended. As far as it stays above the trendline, it is a 4-hour correction and should be bought in 7 or 11 swings. The Index already did 3 waves from the peak and could continue to new highs from here, if it does 7 swings lower, should be a gift to buy at the next Blue Box area.
SPX has broken below Oct 30 low (2603.54), i.e. Primary wave ((W)), opening further downside with incomplete bearish sequence from Sept 21 high (2940.91). Near term Elliott Wave view suggests the decline to 2603.54 on Oct 30 low ended Primary wave ((W)). Bounce to 2815.6 ended Primary wave ((X)) as a zigzag Elliott Wave structure. Up from 2603.54, Intermediate wave (A) ended at 2756.55, Intermediate wave (B) pullback ended at 2700.44, and Intermediate wave © of ((X)) ended at 2815.62.
SPX has since declined from there and broken below Primary wave ((W)) at 2603.54, confirming the next leg lower has started. Primary wave ((Y)) is unfolding as a zigzag Elliott Wave structure where Intermediate wave (A) ended at 2583.23. Internal of Intermediate wave (A) unfolded as a diagonal where Minor wave 1 ended at 2631.09 and Minor wave 2 ended at 2800.18. Minor wave 3 ended at 2621.53, Minor wave 4 ended at 2708.54, and Minor wave 5 of (A) ended at 2583.23. Intermediate wave (B) is currently in progress to correct cycle from Nov 8 high (2815.62) in 3, 7, or 11 swing before the decline resumes. We expect Index to find sellers once Intermediate wave (B) bounce is complete in 3, 7, or 11 swing as far as pivot at 2815.62 high stays intact.
SPX 1 Hour Elliott Wave Chart

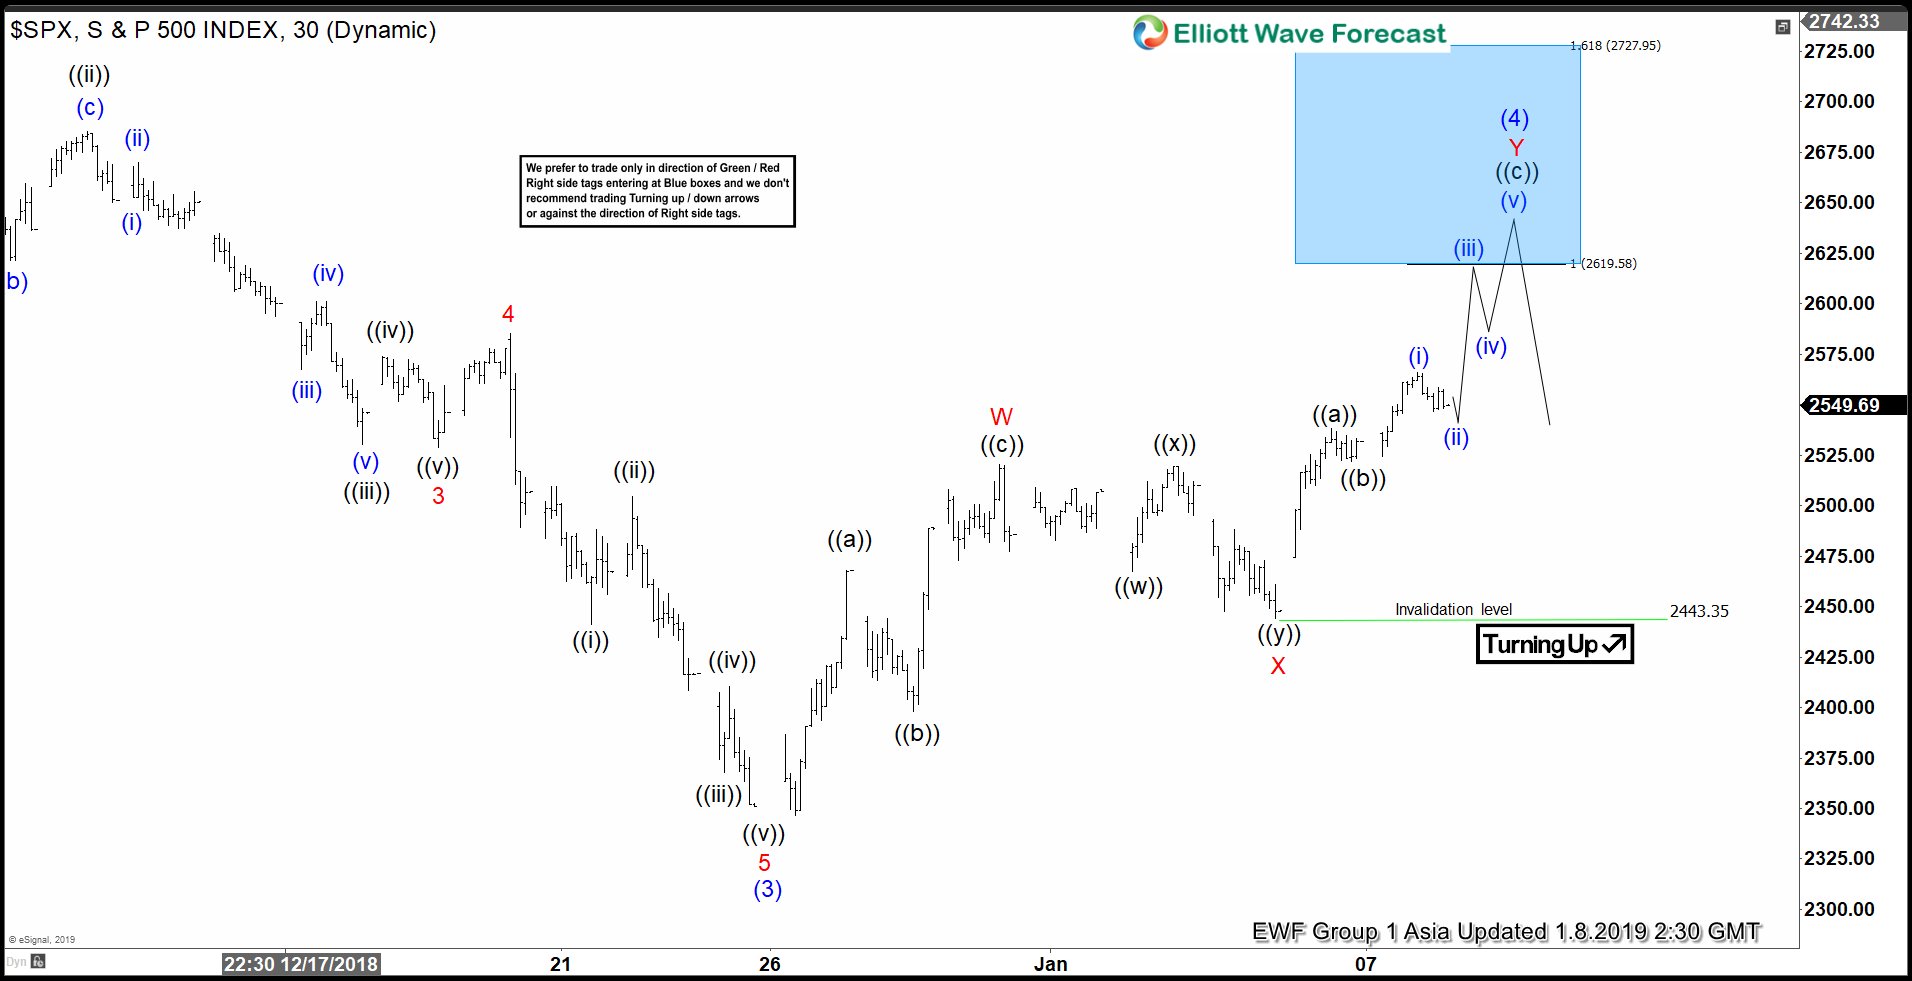
Short term Elliott Wave view in SPX suggests that the decline to 2346.58 ended wave (3). The Index is currently correcting in wave (4) as a double three Elliott Wave structure. Up from 2346.58, wave W ended at 2520.27, wave X ended at 2443.96, and wave Y remains in progress towards 2619.58 - 2727.95 area before Index resumes lower or pullback in 3 waves at least.
A double three Elliott Wave structure is a complex correction in which we have two Elliott Wave corrective structures together. In this case, wave W subdivides as a zigzag Elliott Wave structure where wave ((a)) ended at 2467.76, wave ((b)) ended at 2397.94, and wave (©) of W ended at 2520.27. Wave X subdivides as a double three of lesser degree where wave ((w)) ended at 2467.47, wave ((x)) ended at 2519.49, and wave ((y)) ended at 2443.96.
Wave Y is proposed to be unfolding as a zigzag where wave ((a)) ended at 2538.07, wave ((b)) ended at 2522.13, and wave (©) of Y is in progress towards 2619.58 - 2727.95 before ending the entire wave (4) correction. Expect sellers to appear once wave (4) correction is over at the blue box area for a 3 waves pullback at least.
SPX 1 Hour Asia Elliott Wave Chart