Thank you for your response and I hope others are seeing the potential of this method as you have. I have posted this system and my progression on these forums because it is where I started off as a noobie. I went through the whole Kindergarten to College tutorials offered here and give much credit to this website for that. Knowing the basics is always important in anything you do in life. In addition I strongly believe that with the success of this thread more people will catch on and learn to trade these patterns effectively which can ultimately turn this thread into not just a place for learning how to trade with this method, but to also share patterns that one see throughout the day or upcoming ones with each other (which again I would like to thank sweet pip for giving me the chance in correcting her pattern  I made 30 pips on that). Which in essence can help us all out in gaining some extra pips.
This is do to my account type:
- FXCM is compensated through the bid/ask spread except where otherwise noted. Please note commission charges apply for certain classes of non-standard accounts such as Active Trader. For additional information click here.
Quoted from FXCM.com
Ok then…that explains it 
So next question…lol…how do you handle news releases? Say you see D completing, or you’re already in a trade, and in 5 or 30 mins some news is about to be released.
The beauty of this trading method is that it typically predicts the news along with it or at least the reaction of the traders. What normally happens is that the news speculation pushes the market up towards my D entry when it comes out and then does a full reversal 10-20 mins after the news going towards the patterns favor. In addition, during critical news times, I make sure that we have a concrete pattern waiting for it. If the Divergence I am expecting is not available then I simply to not trade it. I also take note of any other previous pattern that may still be in “play” some times a pattern might develop during the news time but a much bigger one is still trying to reach its first or second target. So I simply wait to see which one looks more concrete. The last trade I made last week was such a case. Remember I said that price might fake out in the pattern I was trading (Euro Dollar) and it did. In fact it made me 40 pips, but then it went up to a higher D. And as a matter of fact, there was US News during that time.
Hi Tmoney,
I found this thread on Thursday or so and I think this method is very powerful. I had be trading with ABCDs and Gartleys for a long time now so I learnt it pretty quickly. Also I currently, trade candlestick patterns aided by STARC bands, learnt from Tymen1’s thread, which I tweaked a bit, and when combined with this its a bomb. Very powerful!!! You are right about limiting yourself to control the greed. The fact is, if you want more out of the trade all you have to do is to be consistent and increase the lot sizes. No need to prove anything else. Great Thread and thanks for making such a powerful contribution!!!
Hope you can see the GREEN butterfly below…

Simone
-Edit-
Oh and that’s a Gartley btw A butterfly must be above X for a bearish Butterfly and Bellow X for a Bullish Butterfly.
Thank you Bank for the response, also can you post the link to Tymen1’s thread? I’d like to try that out  it sounds interesting. Oh, and it looks like it hit its target 2 great pattern.
You are Welcome Tmoney…Tymen’s thread is at http://forums.babypips.com/newbie-island/19339-joy-candlestick-trading-part-2-a.html
I may have to look back at your vids again to appreciate what you are saying here.
Thanks again!
Simone
Originally Posted by TMoneyBags View Post
Oh and that’s a Gartley btw A butterfly must be bellow the 100% of XA at least at the 1.272 fib levelThank you Bank for the response, also can you post the link to Tymen1’s thread? I’d like to try that out it sounds interesting. Oh, and it looks like it hit its target 2 great pattern.
Sorry My Mistake!
In order for a pattern to be considered a Butterfly, the D must be bellow or above X. To clarify, A bullish butterfly’s D is bellow X (Buy Pattern) and a bearish butterfly’s D is above X (Sell pattern).
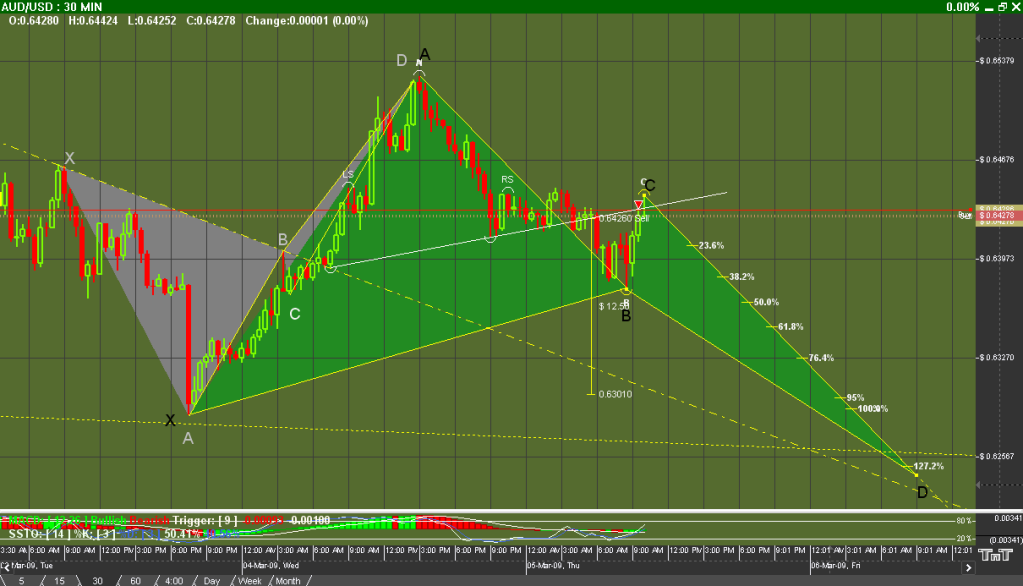
Take note of this on the images bellow:
The gray pattern bellow Is a Bearish Butterfly, and the Green pattern was the prediction of a Bullish Butterfly.
The Image bellow contains prediction of a Bullish Gartley in gray and a Bearish gartley in gold.
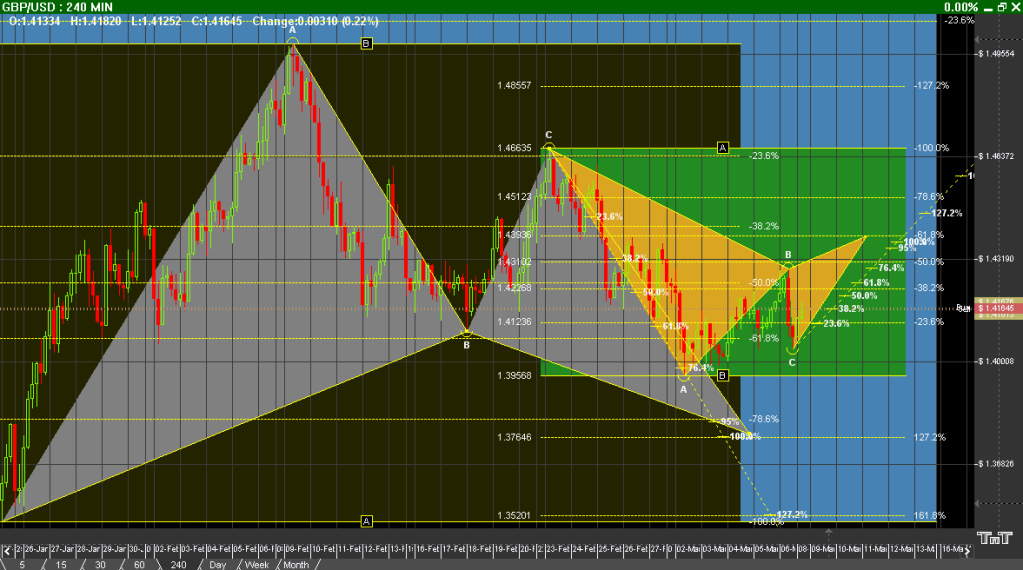
I hope this gives you a bit more clarity.
*please note that the fibs on these images where not all included I will post clearer examples when the market opens. Also the time when these images where taken of the market was around the 9th of March this year.
Hi TMB! I see you’re having a busy weekend here. Thanks for the video tutorials they’re really helpful.
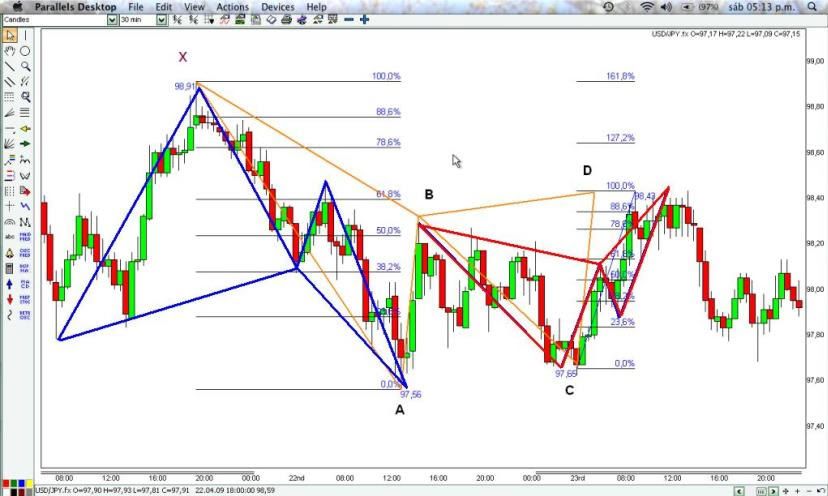
I’m doing some practice to recognise patterns. I want to ask for your opinion (if possible) on what I think is a bearish gartley pattern.
I found it on a 30min usd�jpy chart on april 21st, and X point is at 98.91 at 14:00 hrs est. I drew my D point as if I had not seen the final result and that’s what I got. I hope I’d attached all the information that is needed in order for you to make an opinion, and hopefully you can tell me what’s wrong or right with it.
Thanks!!

Good gartley you have there  too bad we didn’t trade that one it would have probably limited us out at 30 pips within 2 bars. What I would like you to do though is to make sure that when you draw your percentage for CD that 0.00 is right at the tip of of the wick at C you seem to have it in between its base price and the tip of the wick.
Also take notice bellow, I spotted 2 other trades. A bullish butterfly (Blue) which had its first target hit right where your D formed (Confirmation for retracement) and a bearish butterfly (Red) within your gartley which adds even greater confirmation. So now you have 3 patterns indicating that their is resistance at that area along with the 100% convergence of CD with the .618 of XA. That indeed was a beautiful setup and i wish i would have traded it
I need you to spot more trades like that heh the more people we get seeing these patterns the more pips for all!
Aand I post other pattern. The result is kind of weird, I think I’m wrong but I want to know your opinions,
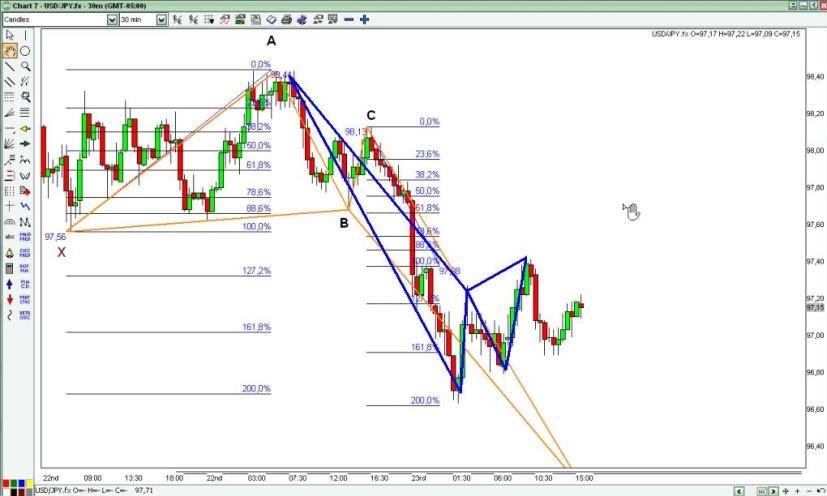
Same pair (usd/jpy) same timeframe (30min) I just turned last chart AD points into a new XA and the result is a bullish butterfly.
The only convergence that I found to determine my D point was at 2.618 fib. Is that possible? Point D can’t even be seen in the chart!
My possible D point is at 96.15 and profit target (.500 fib) at 97.29. I attached the chart. We don`t know the result since it’s not developed yet but If I’m right it should work by monday right?
Another question. Even if I’m wrong with the pattern recognition, is this the way we look after them? If so, can we identify what the market is gonna do and make a set and forget trade?
Thank you so much for your time!
Regards!

Thank you for your answer! I didn’t see it because I was busy writing my last post. they overlaped.
I’ll keep trying to find good quality patterns thank you for your guidance!
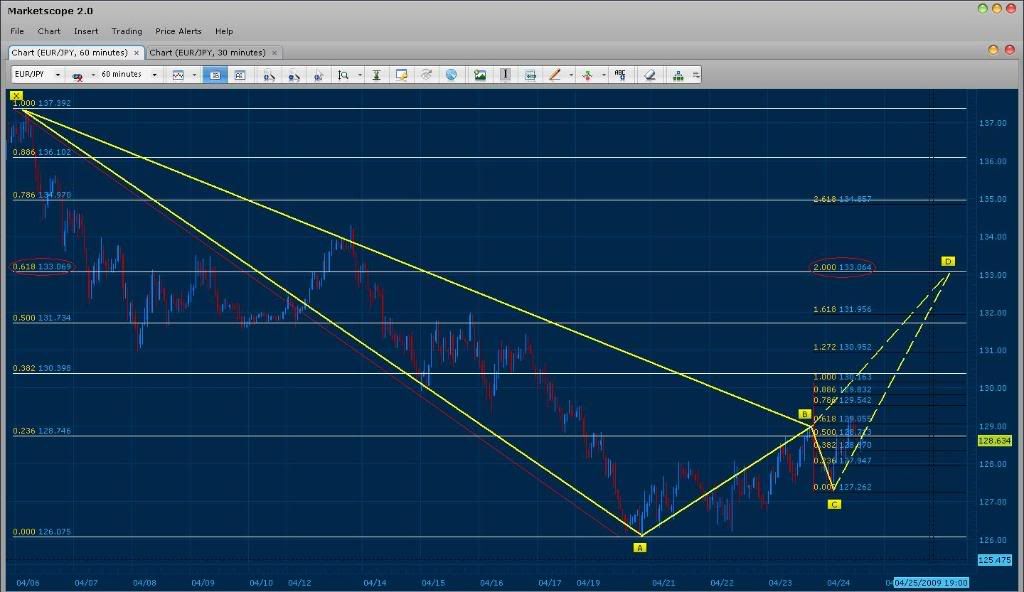
Look at the gartley bellow and see that it adds extra confirmation to the trade going downwards and possibly reaching that 2.618 convergence you are waiting for. In addition the 200% convergence at 2.000 of XA was a good trade aswell.
Oh and yes, heh you are catching on. This is how we do predict them as you can see in a previous reply:
Click on the blue image next to my name to jump to the post
The second image there shows an upcoming trade for the Euro/Dollar and on that same page I have an upcoming trade for the Euro Yen also. Both patterns seem to be heading up to that point b4 the pairs reverse and start a real down trend.
Thanks TmB! I’ve been learning so much this afternoon I’m on fire!! Last thursday I had no idea such a way of trading exists.
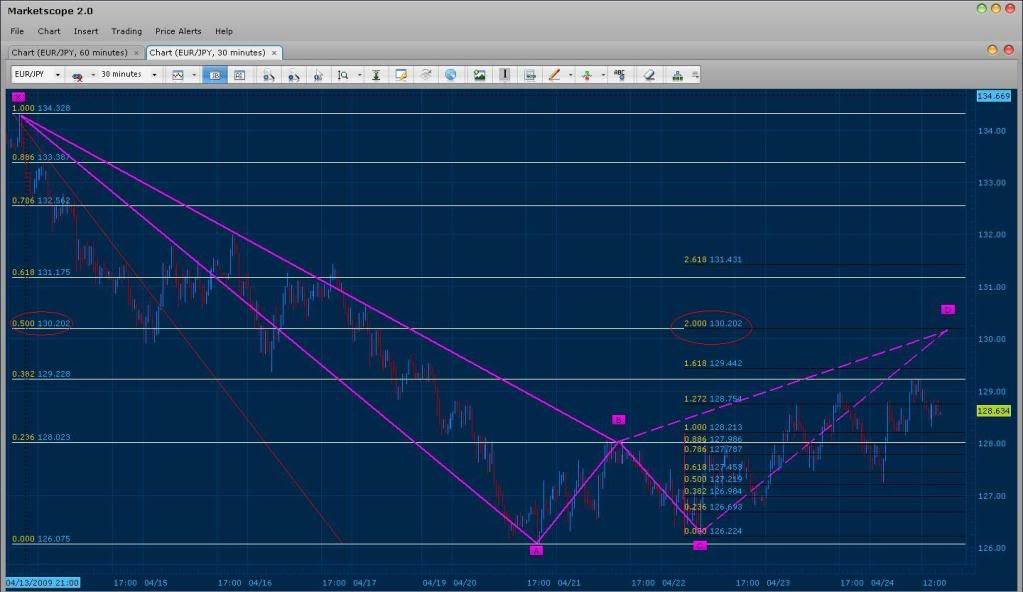
I’ve been looking for patterns in yesterday’s session. I’ve found a D point that was ignored by price action and instead of reversing at the convergence with XA-CD fin .500 it went to the .618 and a little beyond. Eventually It did reverse but If I had set my entry point at D, it would have hit my stop loss.
What did I do wrong?
It’s a 30 min eur�jpy chart. Point x starts at 16:00 est on april 23rd.
Thanks for your time!

I’m sorry but that is not a D. A CD must be at least 100% of AD and your D point seems to be only at 65% of AD. In addition, the BC leg is a .382 retracement meaning that D will most likely reach the extensions of your XA and definitely 127% of CD. On the other hand, your close to predicting a very good pattern which I will post above.
Ok Got It!!!
Thank you.
Bellow is the Correct way to draw a pattern from the XA you have chosen. Also note that It is actually an upcoming pattern with great potential! Take note of that area and make sure you see what happens at it heh… I will personally trade that point when the market opens, TY for pointing it out.
Bellow you will notice that CD at 168% converges perfectly with the 2.000 Fib level of XA. It looks like a Beautiful upcoming Butterfly (don’t miss it).
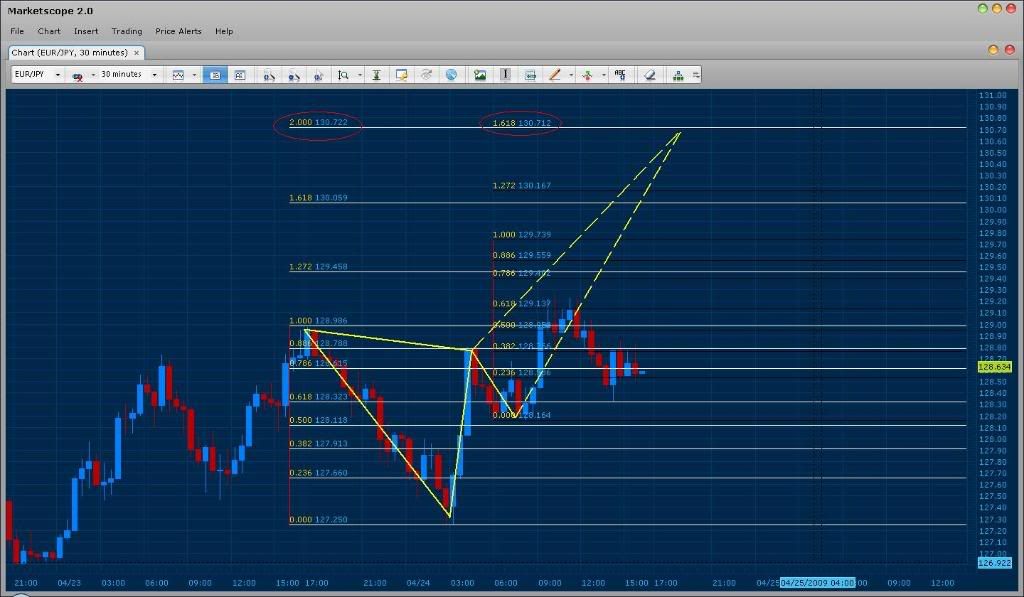
Bellow is now a gartley 222 with great potential as well. The 200 of CD convergence on point with the .500 of XA. This is the pattern I have been waiting for and hopefully it will complete this week.
And last Bellow we have a Huge pattern that may end up forming it self with a more symmetrical BC within 2 weeks. This trade does though have the potential of coming through. It has convergence at CD 200% with the .618 fib level of XA (X is at the peak of the daily and this may be the zone that will return us to the downtrend).
Great thread TMoneyBags. I’m hitting a critical point in my trading and I’m hoping I can grasp these patterns and apply them to my trading. I almost thought of giving up recently but I think I’m just too stubborn. Numerous books and hours upon hours of reading and practicing will not be for nothing! Plus, I’ve only been at it for 6 months or so…
Anyway, I’m sick of indicators, it just always seems like I’m too late to the party. I love the idea of recognizing patterns and anticipating, instead of seeing a light go green and hoping I can jump in before the train stops and changes direction again. My only concern is with the fib stuff. I’ve used them to some degree in the past, but never with the attention to detail you employ. How long did it take to grasp all these patterns fully? I just ordered the pattern recognition book you suggested (adding it to the plethora of Wiley books I’ve read in the past 6 months) so hopefully that will help.
Thanks again, I’ll be following this one.
Thank you for the response Lava and I’m glad this thread reached you at such a critical moment. I as well wanted to give up numerous times but I hung in there and finally I am seeing results. Again I highly stress the fact that once you learn this method you will need to overcome your emotions, especially that of greed because this will indeed be what will hold you back after you are able to predict price movement. Also take note that I started out just like any one here on the forums. I Did all the tutorials presented by baby pips (again great for understanding the basics) and went through a variety of methods. The whole pattern recognition took me about 2-3 months to fully grasps and trade the patterns correctly. One thing most beginners do is try to make “price fit”. In other words, they draw the pattern in a way that might make them right. For example instead of drawing XA starting at the peak of price, I would move X to the most recent leg so that I could make convergence happen. A big NONO and I wish for all of you to avoid this. Keep looking at the patterns I post to get an example of what a real pattern is and in addition, post what ever patterns you find so I can correct them for you or trade them with you :). If you are still dependent on extra confirmation and scared to get into a trade with the pattern (most people run scared because the D of a bullish butterfly would usually start right after a Nice bearish candle and then the trader hesitates and looses the best opportunity of price) is to use the SSD indicator. When the SSD crosses on the 5-15-30, their are at times D’s set up. Also once you read the book you ordered, then you will see the true power of Fibonacci and be ready to “unleash” it with your patterns. It is by far the most important tool you will ever see on any trading platform. The use of the Fibs and these patterns allow me to predict price movement in any market at any given time. This allows me to not trade Forex but to be able to expand my self to any market of my choosing (but why would I give up such leverage at the moment heh… :rolleyes:).
Also the use of the Mac D indicator is not bad as well. When I began trading this way the knowledge that there was Positive or Negative divergence in favor of my trade, did help me become better at execution. I don’t use indicators now because they just feel like clutter on my screen preventing to fully grasp what the market is “saying” (candle sticks talk lol… you will notice this once you learn to read them well). Every movement a candle stick makes is the result of fear and greed from traders as our selves. All in all, use the indicators 'till you feel like they are of no use for you any more. Think of them as training wheels on a bike. Once you learn to ride a bike with out them, you will never need them again. 