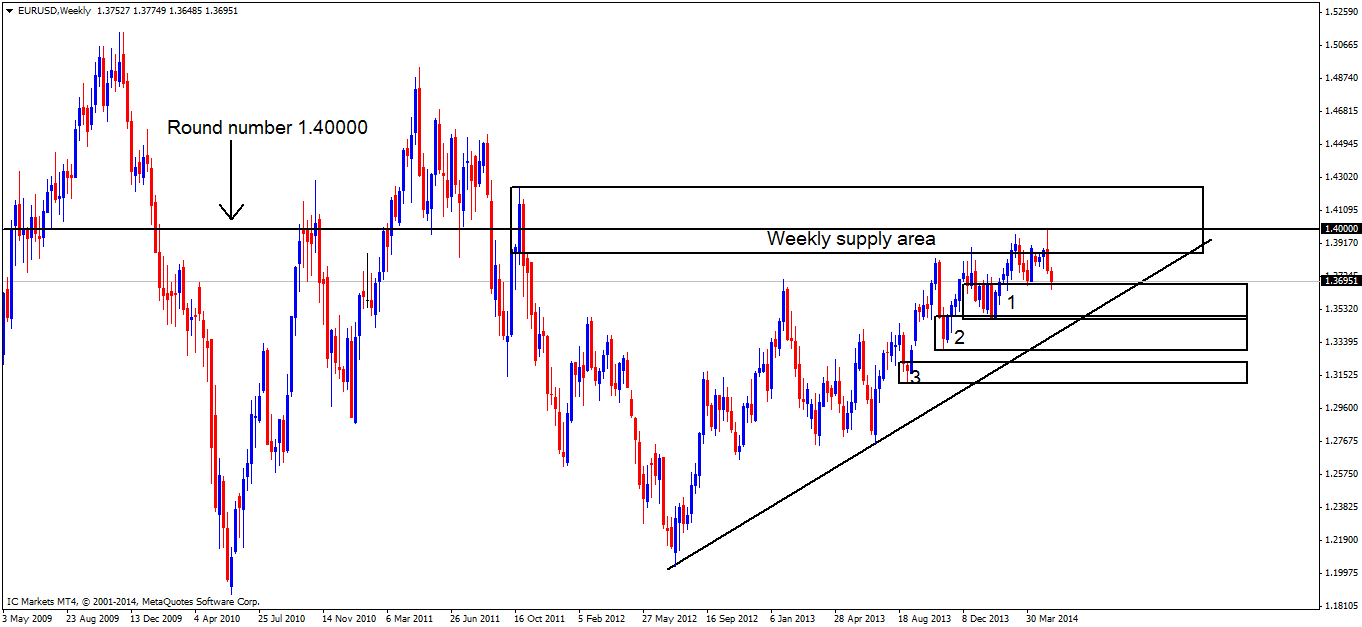
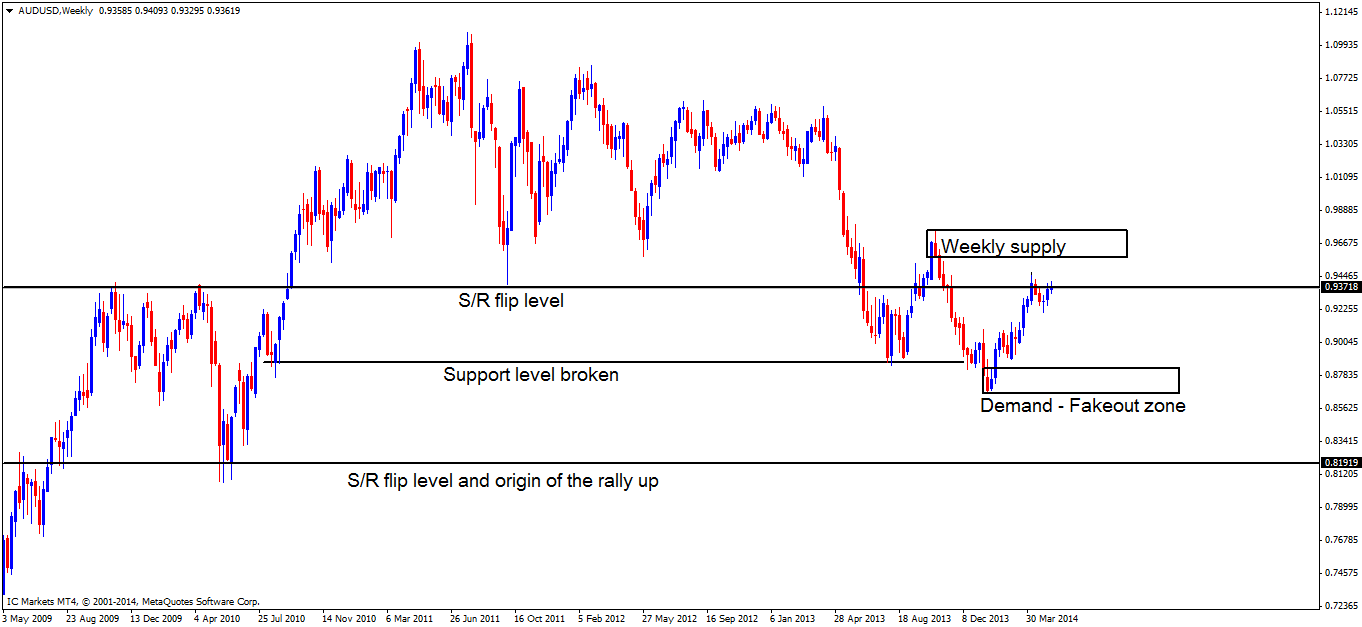
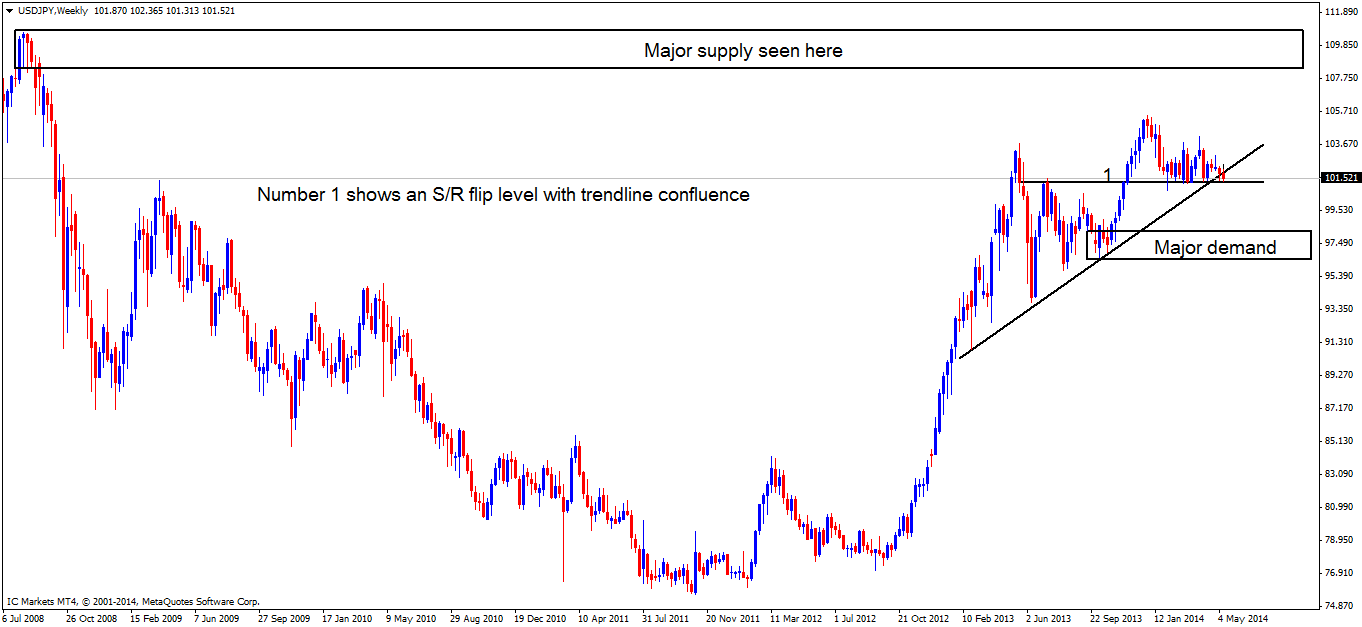
Daily Market Analysis by IC Markets

USD/JPY

4hr TF.

At present this pair is seen to be reacting off of the S/R flip level at 102.128 as was reported may happen in the last analysis.

The selling pressure was no match for buyers yesterday at the round number 102.000 which was just within the supply/demand flip area at 102.017 – 101.865.

For the sellers to take over, demand below has to first be consumed at the round number - supply/demand flip area (levels above), the next area of demand should be quite obvious at 101.536 as per the chart below.

A break above the S/R flip area where price is currently trading at would see price enter into a price void, basically meaning, there is room for price to move until the next S/D zone, which in this case is upper supply area number 2 at 103.055 – 102.742.


[ul]
[li]Areas to watch for buy orders: 102.000, 102.017 – 101.865, 101.536.
[/li][li]Areas to watch for sell orders: 102.128, 103.055 – 102.742.
[/li][li]Most likely scenario: Price has so far done as expected. We will likely see a retrace from the S/R flip level at 102.128 and begin work on consuming near-term demand areas (102.000, 102.017 – 101.865, 101.536) until price hits the BIG ONE – the weekly S/R flip level B[/B] seen at the lower end of current daily demand (101.207 – 101.754). However, a spike/fakeout into the price void above the S/R flip level is not out of the question before a drop is seen.
[/li][/ul]

The charts levels and zones will be color coded for the benefit of readers as follows:
Weekly TF = [B]Black[/B]. Daily TF = Gold. 4hr TF = Brown

[B]EUR/USD:[/B]
[B]4hr TF.[/B]
Price reacted beautifully off of supply (2) at [B]1.37941 – 1.37712[/B] and broke through demand (3) at [B]1.37374 – 1.37487. [/B]The Euro has responded nicely to a small 4hr demand area marked with a check sign at [B]1.36973 – 1.37035[/B] coupled with a round number B[/B] providing additional support. The reason this area was not highlighted during the last analysis was because of the two tails just before the demand area was formed, these tails indicated price was able get below the level at that time, portraying selling strength, and was not worth the risk, but on this occasion it was proved wrong.

image url

[ul]
[li]Areas to watch for buy orders: N/A
[/li][li]Areas to watch for sell orders: N/A
[/li][li]Most likely scenario: For buyers to move price successfully from this current area of demand, they need to consume oncoming supply. Previous demand area (3) [B]1.37374 – 1.37487[/B] which is now acting supply, needs to be consumed before price can rally any further, just because we are seeing buying strength, it does not mean it will continue. Our best bet is to WAIT! Not to initiate any long trades until some or all of the first supply area (mentioned above) is consumed as we do not want to get caught out with a possible fake out below to an even higher- timeframe weekly demand (shown on Monday’s weekly analysis) at [B]1.34470 – 1.36837.[/B] If we see a positive break north of the first supply/demand flip area (3) (levels above), then start looking for buying opportunities. If price breaks below demand at [B]1.36973 – 1.37035[/B] then watch how price reacts at or around the weekly demand base-line area just below (levels mentioned above).
[/li][/ul]

[B]GBP/USD[/B]
[B]4hr TF.[/B]

Taking into account the last analysis, which reported price may fake near-term demand at 1.68333 – 1.68513 to stop out any traders buying there. This fakeout did occur and a reaction was seen at the demand area just below at [B]1.68072 – 1.68260 [/B]as expected.


image url
With all that being considered, we have just reacted off of a very strong 4hr supply area at [B]1.70410 – 1.69840 [/B]as well as being surrounded by a daily supply area at [B]1.70410 – 1.68880,[/B] and only 30-40 pips away from a weekly supply area at [B]1.76290 – 1.70490[/B] (as shown on Monday’s weekly analysis), so sell orders are most viable for now.

Price is currently capped between demand at [B]1.68072 – 1.68260[/B] and acting supply at the round number [B]1.69000.[/B]


image url
[ul]
[li]Areas to watch for buy orders: [B]1.68072 – 1.68260, 1.68000, and 1.67202.[/B]
[/li][li]Areas to watch for sell orders: [B]1.69000.[/B]
[/li][li]Most likely scenario: Price will likely trade in between temporary consolidation (demand: [B]1.68072 – 1.68260 [/B]supply: [B]1.69000)[/B] for a while, especially within the lower-volume sessions today until a decision is made to break. Range traders may see lower timeframe opportunities trading the limits, but caution is advised. A break below is more likely, if sellers manage to consume buyers at the round number [B]1.68000 [/B]below the demand area just mentioned, we then could see a nice drop due to previous price action to the left. Take a look at the small bold trendline, this area of price action indicates consumed demand, so in theory price should be able to drop freely here, until we see the demand area at around the low of [B]1.67202.[/B]
[/li][/ul]

[B]AUD/USD:[/B]
[B]4hr TF.[/B]

A beautiful reaction has been seen at the base of a 4hr minor demand zone [B](0.93186 – 0.93345)[/B]. Price still remains capped between supply at[B] 0.94253 – 0.94040[/B] and demand at [B]0.93186 – 0.93345[/B].

Again, as recommended in the last analysis, we are currently within a weak daily supply area at [B]0.94468 – 0.93758[/B] due to a spike consuming sellers seen on the 10/04/14, it may be a good idea to be cautious executing short orders unless absolutely confident in your methodology.


image url
[ul]
[li]Areas to watch for buy orders: [B]0.93186 – 0.93345[/B]
[/li][li]Areas to watch for sell orders: [B]0.94253 – 0.94040[/B]
[/li][li]Most likely scenario: Similar to yesterday, price will likely be confined between supply at [B]0.94253 – 0.94040 [/B]and demand at [B]0.93186 – 0.93345[/B] during the lower-volume sessions. Once volatility picks up, we will likely see an attempt to break either supply or demand (levels above) which will provide more information on where price may be heading next. According to the daily timeframe analysis, current daily supply appears weak and going short should be initiated with caution, however, 4hr supply at [B]0.94253 – 0.94040[/B] looks like a great area for a bounce trade, with the minor demand area (levels above) set as a near-term target.
[/li][/ul]

[B]USD/JPY:[/B]
[B]4hr TF.[/B]

The USD/JPY pair is seen as being bullish, contrary to the last analysis where a retracement was expected from the S/R flip level B.[/B]

A new demand area has formed at [B]101.851 – 102.048[/B] which incorporates the round number [B]102.000[/B].

Part of the last analysis mentioned price breaking the S/R flip level (level above) north, which recently happened. As a result a price void was entered into (a price void is an area where there is room for profit until the nest S/D area – in this case it is supply). A reaction off of the newly formed demand area (levels above) is currently taking place, notice how price faked through the S/R flip level to get to demand, taking stops (sell stops) from traders attempting to buy there, thus giving pro money liquidity to buy into. However, it is too early to tell today if this is a true fakeout at the time of writing.


image url
[ul]
[li]Areas to watch for buy orders: [B]101.851 – 102.048.[/B]
[/li][li]Areas to watch for sell orders: [B]102.365, 103.055 – 102.742.[/B]
[/li][li]Most likely scenario: Price will likely become calm around the new current demand area at [B]101.851 – 102.048[/B] accumulating more buy orders. Once the more volatile sessions open up today, price will likely attack sellers waiting at the high B[/B], if a break is successful, we can be pretty sure price may reach upper supply area 2 at [B]103.055 – 102.742[/B].
[/li][/ul]

The charts levels and zones will be color coded for the benefit of readers as follows:
Weekly TF = Black. Daily TF = Gold. 4hr TF = Brown

EUR/USD:
4hr TF.

Price still remains deep within a daily demand area at 1.36727 – 1.37313. It was reported in the last analysis that we should wait, as no positive direction had been confirmed. Any traders who could not wait were more than likely stopped out by the spike below at the demand area marked with a check at 1.36973 – 1.37035 assuming traders went long around this area.

At the time of writing it does not look good for the buyers, price did not even manage to hit supply area number 3 at 1.37487 – 1.37374 as selling pressure was seen to come in to the market at around the high of 1.37309.

Remember, it’s always good to keep the bigger picture in mind, no matter what timeframe you trade. Price is still seen within a daily timeframe consolidation with a supply area at 1.39669 – 1.39342 and a demand area at 1.36727 – 1.37313. The weekly timeframe shows that a long- term uptrend is in place, however remain aware price is currently trading in and around a weekly supply area at 1.42470 – 1.38580.


[ul]
[li]Areas to watch for buy orders: N/A
[/li][li]Areas to watch for sell orders: N/A
[/li][li]Most likely scenario: It is very difficult to give a likely scenario on this pair. We have two probable outcomes: 1. A rally is seen and price consumes supply (3) at 1.37487 – 1.37374, that is when going long becomes more high probability, or 2. Price breaks the daily demand area at 1.36727 – 1.37313 south, and we enter into a weekly demand area at 1.34770 – 1.36837 in which case, deeper analysis would be needed inside the weekly demand area… Until then, waiting is the best trade to take right now. We can do further analysis when a positive break is seen.
[/li][/ul]

GBP/USD:
4hr TF.

The fakeout between the ‘dummy’ demand area marked with an x at 1.68333 – 1.68513 to the demand area below at 1.68072 – 1.68260 gave a possible 2R winning trade, not too bad considering higher -timeframe analysis is emphasizing short trades at the moment.

The last analysis reported price being capped between a demand area at 1.68072 – 1.68260 and the round number 1.69000 as acting supply. The demand area just mentioned was recently broken, breaking a bullish daily trendline in the process, using a small supply area above at 1.68824 – 1.68714. One can see how easy the most recent drop in price sliced through previous price action to the left marked with a bold trendline, the reason being was most of the buyers were already consumed by pro money making the drop look effortless.


[ul]
[li]Areas to watch for buy orders: 1.67622 – 1.67783
[/li][li]Areas to watch for sell orders: 1.68260 – 1.68072
[/li][li]Most likely scenario: Price is currently showing some buying strength at around 1.67622 – 1.67783 area which is the bottom of the previously consumed price action area. However, the most we are likely to see here at this temporary demand zone is a small rally up to supply which was previous demand at 1.68260 – 1.68072 with a round number (1.68000) just below, then a push down to the next fresh demand area at around the 1.67236 level. This will be the next trouble area for sellers to contend with
[/li][/ul]

AUD/USD:
4hr TF.

This pair still remains capped between supply at 0.94253 – 0.94040 and a minor demand area at 0.93186 – 0.93345. We have seen a beautiful reaction to the supply area just mentioned as reported may likely happen in the last analysis. Near-term targets for traders short here are at a new minor demand area marked with an x at 0.93462 – 0.93575 and the final target around the lower minor demand area at 0.93186 – 0.93345 supported with an S/R flip level at 0.93167. The reason why targets are so close is due to the daily supply area at 0.94468 – 0.93758 being so weak due to a spike marked with a circle to the left consuming most of the higher-timeframe sellers on the 10/04/14.


[ul]
[li]Areas to watch for buy orders: 0.93186 – 0.93345, 0.93462 – 0.93575 (minor demand area marked with an X)
[/li][li]Areas to watch for sell orders: 0.94253 – 0.94040, 0.95434 – 0.94862 (Fresh daily supply area above)
[/li][li]Most likely scenario: Price will likely meander within this minor consolidation (minor demand: 0.93186 – 0.93345 supply: 0.94253 – 0.94040) possibly testing either supply or demand today. A break the upper 4hr supply at 0.94253 – 0.94040 is likely to happen soon, due to being in a weak daily supply area at 0.94468 – 0.93758 which in turn will likely see a break also. This break may not happen today, but do be on the lookout for it in the near future. A positive break above will see price touching base with a fresh daily supply area at 0.95434 – 0.94862.
[/li][/ul]

USD/JPY
4hr TF.

Taking the last analysis into consideration reporting price was likely to attack sellers at the high 102.365, we did see this happen, but selling pressure was too strong and price dropped and dropped hard! Consuming a newly formed demand area (1) at 101.851 – 102.048, and now touching base at the daily demand area at 101.207 – 101.754, confirming that the circled area is indeed a fakeout on the 4hr timeframe as reported may likely happen in Tuesday’s analysis.


[ul]
[li]Areas to watch for buy orders: 101.536, 101.328.
[/li][li]Areas to watch for sell orders: 102.129 – 102.365.
[/li][li]Most likely scenario: Price has now confirmed a fakeout on this timeframe marked with a circle by consuming the newly-formed demand area (1) below at 101.851 – 102.048. We will likely begin seeing pro money consuming lower demand areas. The first logical area that may cause problems is at 101.536, and then of course, just below this, the sellers have the weekly S/R flip level at 101.328 to contend with. However, this does not mean price will just drop through these levels; we are likely to see some retracements from buyers around those levels. The most likely place for a retracement to reach is the fakeout zone (supply) at 102.129 – 102.365 marked with a circle, so do make sure to keep a close eye on these levels today.
[/li][/ul]

The chart levels and zones will be color coded for the benefit of readers as follows:
Weekly TF = Black. Daily TF = Gold. 4hr TF = Brown

EUR/USD
Daily TF.

At last some action to get excited about! The circled area shows price breaking a daily demand zone at 1.36727 – 1.37313 consuming most of the buy orders. A break of this demand area was expected as price had recently hit and reacted bearishly at a weekly supply area (1.42470 – 1.38580), possibly triggering long-term sell orders. However, any sellers who sold the breakout may see trouble ahead today as we have yet to see a break of the low 1.36432, once this happens we can be pretty sure price will hit the next demand area below marked with a gold thumbs-up sign at 1.34770 – 1.35557.

4hr TF.
Here, the picture becomes much clearer, above it was said we should essentially wait for the daily low of 1.36432 to be consumed, here is why: notice there’s a sneaky 4hr demand area marked with an arrow at 1.36434 – 1.36696 hiding just below the daily demand area (levels above), this 4hr demand area is currently supporting the market, and will do until price consumes it.


The Euro, one again is capped between a newly formed supply area (1) at 1.37309 – 1.36890 and a demand area which was just mentioned at 1.36434 – 1.36696.


[ul]
[li]Areas to watch for buy orders: 1.34770 – 1.35557 (Daily demand area), 1.36434 – 1.36696.
[/li][li]Areas to watch for sell orders: 1.37309 – 1.36890.
[/li][li]Most likely scenario: We are likely to see a move today out of where price is currently capped (Supply: 1.37309 – 1.36890, Demand: at 1.36434 – 1.36696). The limits of these two areas may be nice trading limits for the lower timeframes, do be on your guard though for possible fakeouts! If we see price break the demand area just mentioned south, this will confirm lower prices will likely happen. For price to break north, we need to see a positive close above the supply area just mentioned, this will put it into question as to whether the area marked with a circle below was a fakeout or not? Once again, to be on the safe side, it may be best to hold on trading this pair until an area breaks and gives some confirmation on possible direction.
[/li][/ul]

GBP/USD
4hr TF.

According to the last analysis conducted on this pair, price was expected to rally up to a supply area which was previous demand at 1.68260 – 1.68072 with a round number B[/B] just below. We did see this happen, however, not expecting price to drop so low before doing so. Buyers have been completely consumed at the minor demand area (1.67622 – 1.67783) shown on the chart below.

The demand level still to watch and remains fresh with likely buy orders waiting to be filled is around the 1.67236 area.


[ul]
[li]Areas to watch for buy orders: 1.67236.
[/li][li]Areas to watch for sell orders: 1.68260 – 1.68072, 1.68000.
[/li][li]Most likely scenario: Price will likely continue to react off of supply consuming sellers at 1.68260 – 1.68072 as there’s extra selling pressure with the round number 1.68000 located just below. We will likely see a push down south for the fresh demand level just below at the 1.67236 area. Why will this likely happen? Pro money has cleared out any potential demand areas until the fresh area just mentioned. Lower-timeframe traders will likely buy the momentum jumping on what appears to be a small uptrend forming. Pro money sells in small chunks to all these buy orders consuming each and every one of them until the buy orders dry up, leaving price little choice but to drop where the buyers outweigh sellers (fresh demand).
[/li][/ul]

AUD/USD:
4hr TF.

This pair depicts beautiful price action that is so often easy on the eye. Any trader who got in short at the supply area (0.94253 – 0.94040) would have had their targets hit already as reported in the last analysis.

We recently saw the minor demand area marked with an x at 0.93462 – 0.93575 be consumed, and price reacting to the minor demand area below at 0.93186 – 0.93345 which is supported with an S/R flip level at 0.93167. Price has clearly used the demand area marked with an x (levels above) as a ‘dummy’ demand zone to entice traders to buy there with their stops just below the zone. These stops (sell orders) were gladly gobbled up by pro money as liquidity to buy into.

At the time of writing, price still remains capped between supply at 0.94253 – 0.94040 and demand at 0.93186 – 0.93345.


[ul]
[li]Areas to watch for buy orders: 0.93186 – 0.93345.
[/li][li]Areas to watch for sell orders: 0.94253 – 0.94040, 0.95434 – 0.94862 (Fresh daily supply area above).
[/li][li]Most likely scenario: Very similar to the last analysis conducted, the consolidation area (Demand: 0.93186 – 0.93345 Supply: 0.94253 – 0.94040) has yet to see a positive break. Price will likely consolidate within the range area just mentioned, possibly testing either supply or demand today. A break of the upper 4hr supply area at 0.94253 – 0.94040 is likely to happen soon, due to being near a weak daily supply area at 0.94468 – 0.93758 which in turn will likely see a break above also. This break may not happen today, but do be on the lookout for it in the near future. A positive break above will see price touching base with a fresh daily supply area at 0.95434 – 0.94862.
[/li][/ul]

USD/JPY:
4hr TF.

The last analysis it was noted the following may happen:

[ul]
[li]Likely to begin seeing pro money consume lower demand areas.
[/li][li]To expect some retracements as they consumed the buying pressure.
[/li][li]The most likely place to see a retrace to would be the circled-fakeout zone at 102.129 – 102.365 that nearly reacted to the pip.
[/li][/ul]
Price did exactly as above, consuming a demand level (101.536) in the process before reaching the weekly S/R flip level with weekly trendline confluence at 101.328. If the sellers manage to overwhelm the buyers at the S/R weekly flip level with a positive close below, be prepared for the possibility of even lower prices, as of now though, a slight bullish reaction is being seen.


[ul]
[li]Areas to watch for buy orders: 101.328.
[/li][li]Areas to watch for sell orders: 102.129 – 102.365.
[/li][li]Most likely scenario: Considering a reaction is being seen off of the weekly S/R flip level at 101.328, we can expect the possibility of higher prices today, at least until around the fakeout zone (supply) marked with a circle at 102.129 – 102.365. The reasoning behind this is the heavy selling seen on the most recent 4hr candle; this takes a lot of capital to move the market like this. Generally, traders on the lower timeframes will see this selling momentum and believe it will go on forever, without even considering who they are selling to! The answer, more often than not is they are selling to well-funded and well-informed traders who happily accepts these orders to help fill theirs to push price back up to an area of fresh supply where sell orders overcome their buy orders very much like our fakeout zone supply (levels above), so this enables the bigger traders to be able to liquidate their positions as the much-needed liquidity is there.
[/li][/ul]

The chart levels and zones will be color coded for the benefit of readers as follows:
Weekly TF = Black. Daily TF = Gold. 4hr TF = Brown

U.S Dollar index for correlation purposes:

EUR/USD:
Weekly TF.

Taking into consideration the last weekly technical forecast, it was reported that price may reach a near-term weekly demand area (1) at 1.34770 – 1.36837. A small reaction was seen last week at the upper limit of this demand area, resulting in price being capped between supply at 1.42470 – 1.38580, and the demand area that was just mentioned above. The market closed at 1.36951 closing below 11 prior weekly candles.

Does last week’s price action seal the deal for the bears? A deeper push south into demand is very likely, but be aware, even though this demand area is not fresh, active buyers may still be waiting deeper within the demand area, so a retracement may be seen sometime this week. So be on your guard! (Levels above).

Daily TF.

Friday’s forecast saw a daily demand area (1.36727 – 1.37313) be consumed with a spike down, taking out most of the buyers’ stops and triggering breakout sellers’ orders who were attempting to sell beneath the zone. The reaction we have seen so far may be due to the buyers’ sell stops getting triggered, allowing the fresh buyers at the low 1.36432 to take advantage of this available liquidity (Sell stops – Breakout sells) to buy into. Also, bear in mind, we have over a week’s worth of selling from above, this is the perfect opportunity for pro money to liquidate some their sell positions (They need sell orders to achieve this as they will need to buy back their position).

Notice how on the USDX above, fresh supply at 80.65 – 80.49 is holding price down nicely, conversely on the Euro we have seen a spike below the daily demand area (levels above) at the same time. This means we may see a retracement on the Euro very soon due to the USDX not breaking supply as the Euro did the demand area.


4hr TF.

A spike above 4hr supply at 1.37309 – 1.36890 marked with a brown circle was seen, despite that, just above there’s a 4hr demand/supply flip area marked number (3) at 1.37487 – 1.37374 meaning the wick above could easily have been a fakeout to this supply to move prices lower. If a positive close above the supply area (1.37309 – 1.36890) happens, this likely means the black circled area below was a fakeout of the daily demand zone (1.36727 – 1.37313) as discussed during Friday’s analysis. This coming week we should have more answers as to where the probable direction is.


[ul]
[li]Areas to watch for buy orders: 1.36434 – 1.36696.
[/li][li]Areas to watch for sell orders: 1.37309 – 1.36890.
[/li][li]Most likely scenario: In light of the recent wick above 4hr supply (1.37309 – 1.36890) on Friday, price still remains capped between the supply area just mentioned and a demand area at 1.36434 – 1.36696. There’s not much reported data due out today, so do not expect anything drastic. Price will likely meander within where price is capped testing either supply or demand. If we do happen to see a positive break of either area, all the better, as we will have a more confirmed direction.
[/li][/ul]

GBP/USD
Weekly TF.

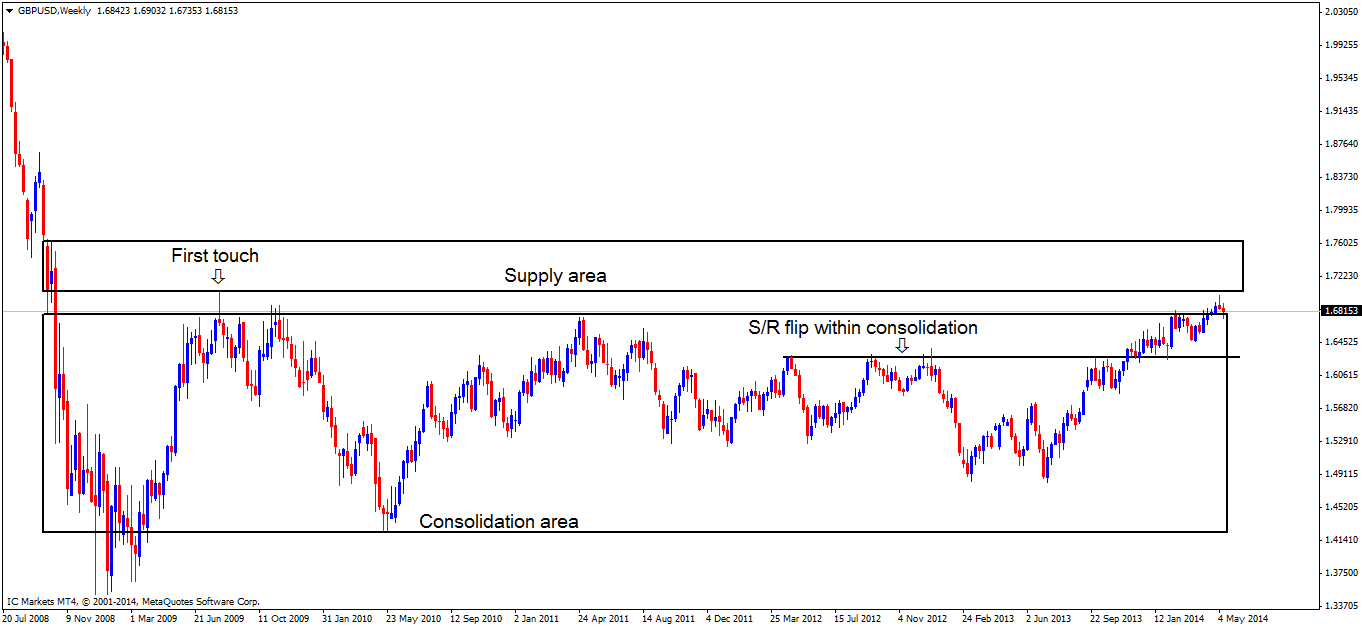
Considering the bearish reaction seen two weeks ago with buyers failing to reach the weekly supply area at 1.76290 – 1.70490, more bearish price action was seen with last week’s candle closing below the previous week’s close at 1.68153. Price is now seen trading at support which was prior long-term resistance to the weekly consolidation zone (1.67980 – 1.42273). Over the next coming weeks, it will become more apparent as to whether current price action is merely a fakeout above the consolidation area (levels above) similar to back in 2009 (first touch) or a continuation move higher.

Lower-timeframe analysis may provide more details.
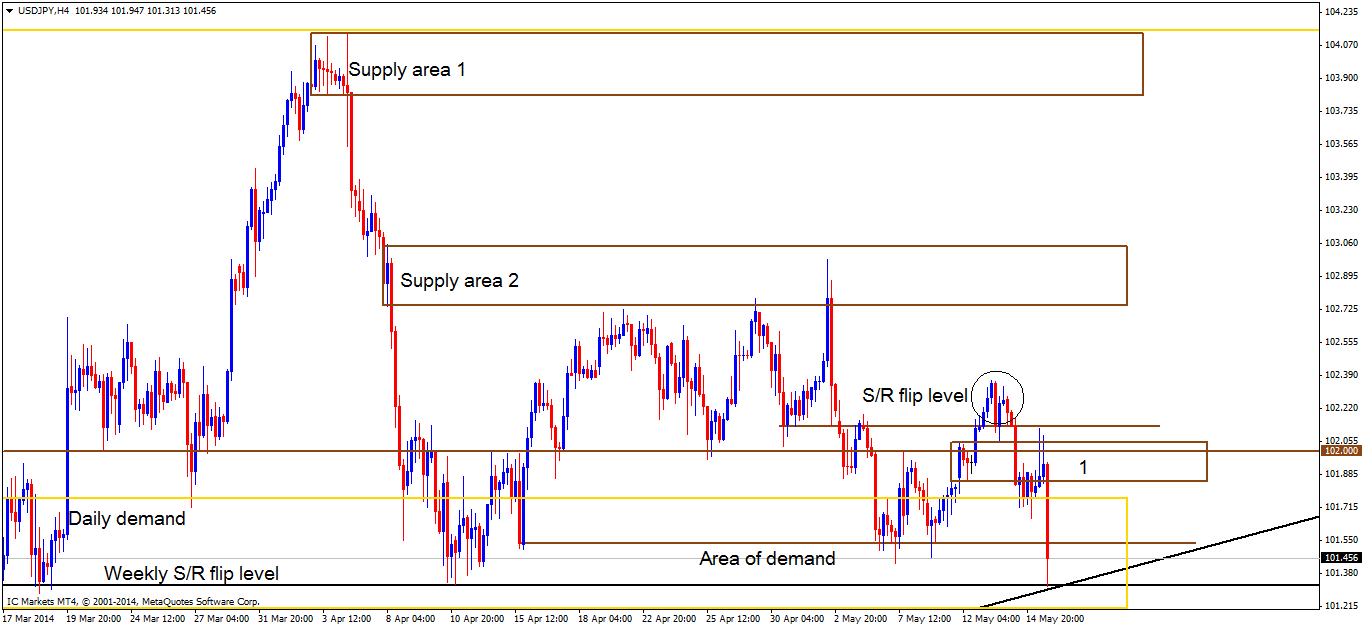
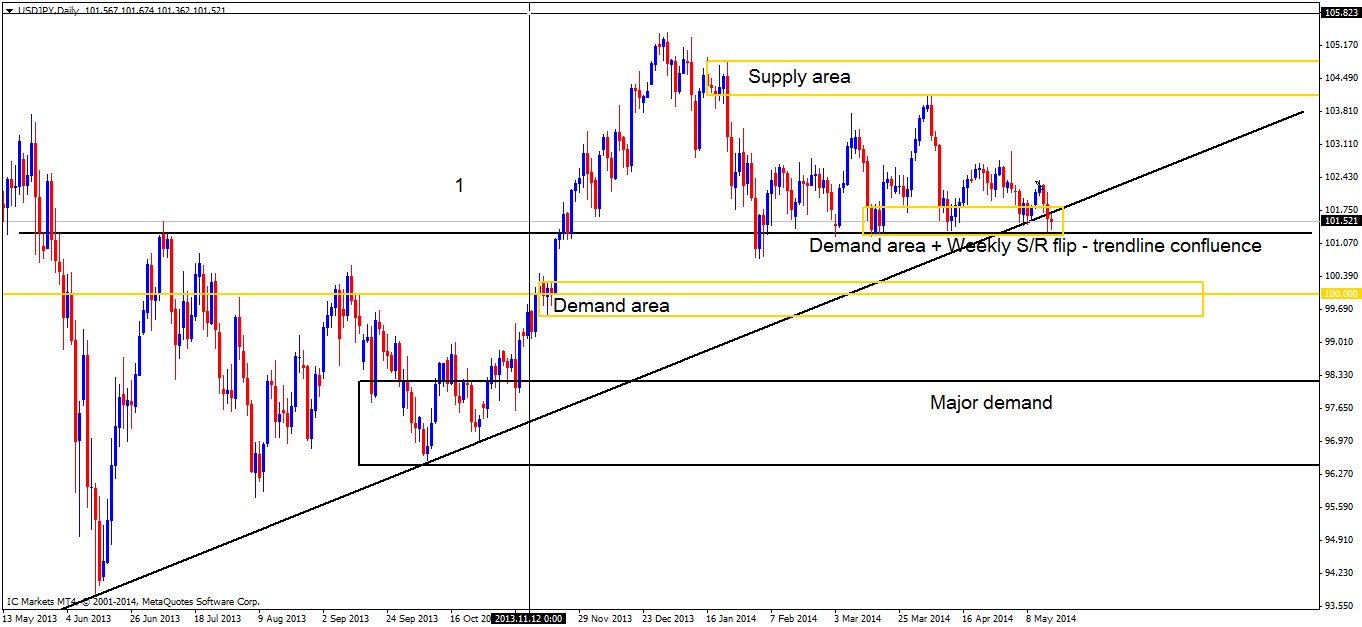
Daily TF.

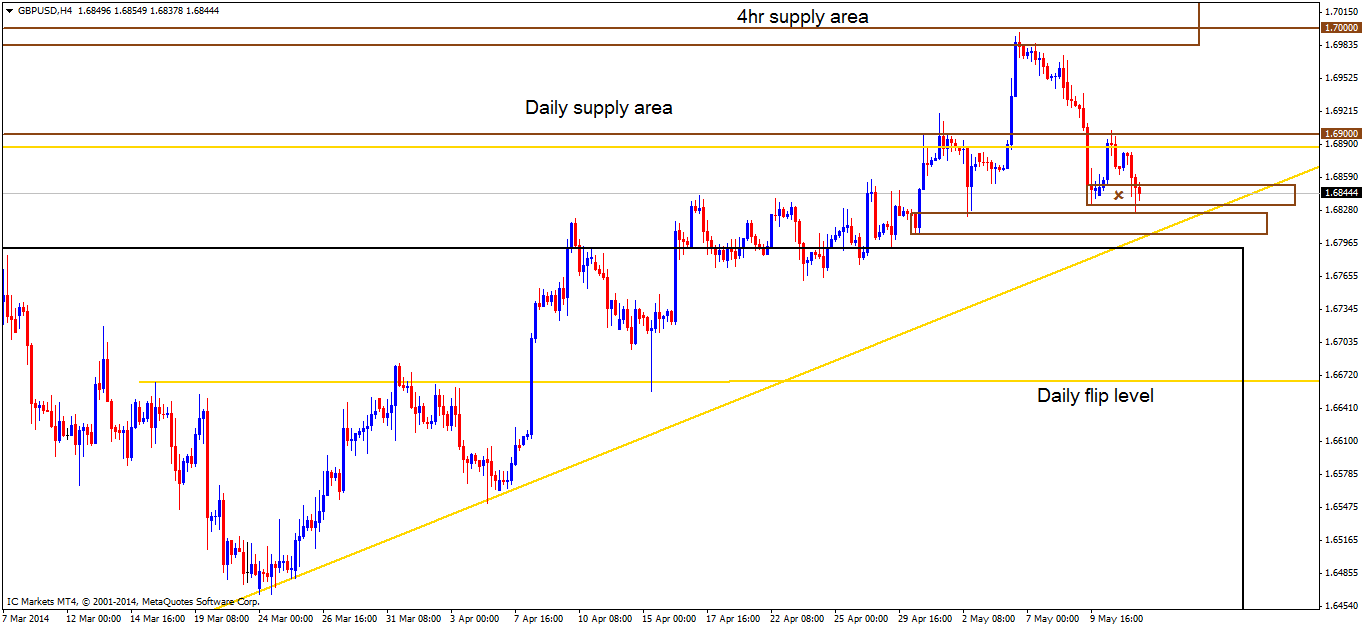
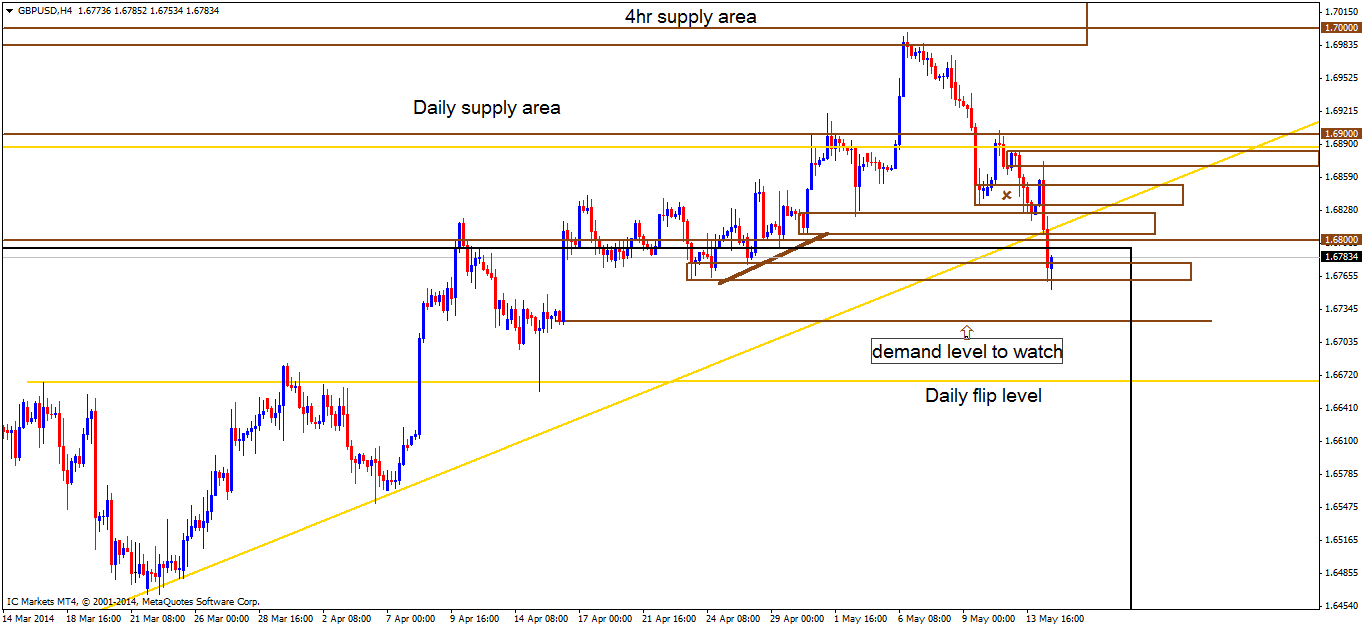
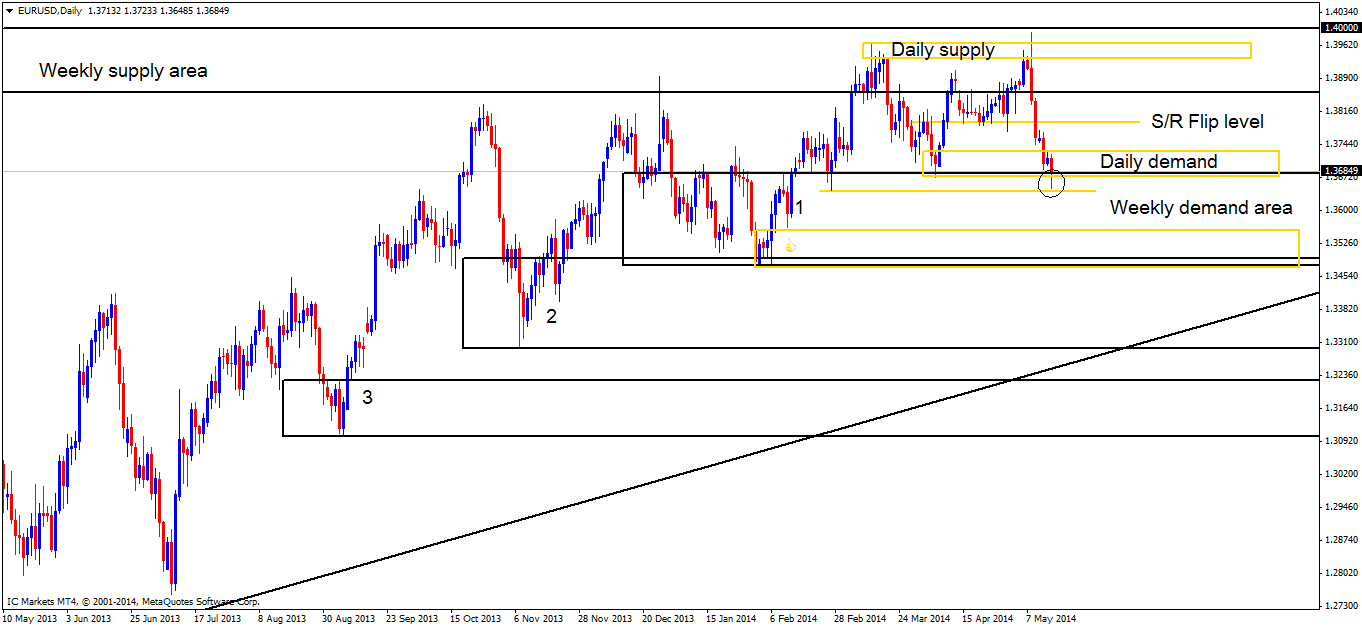
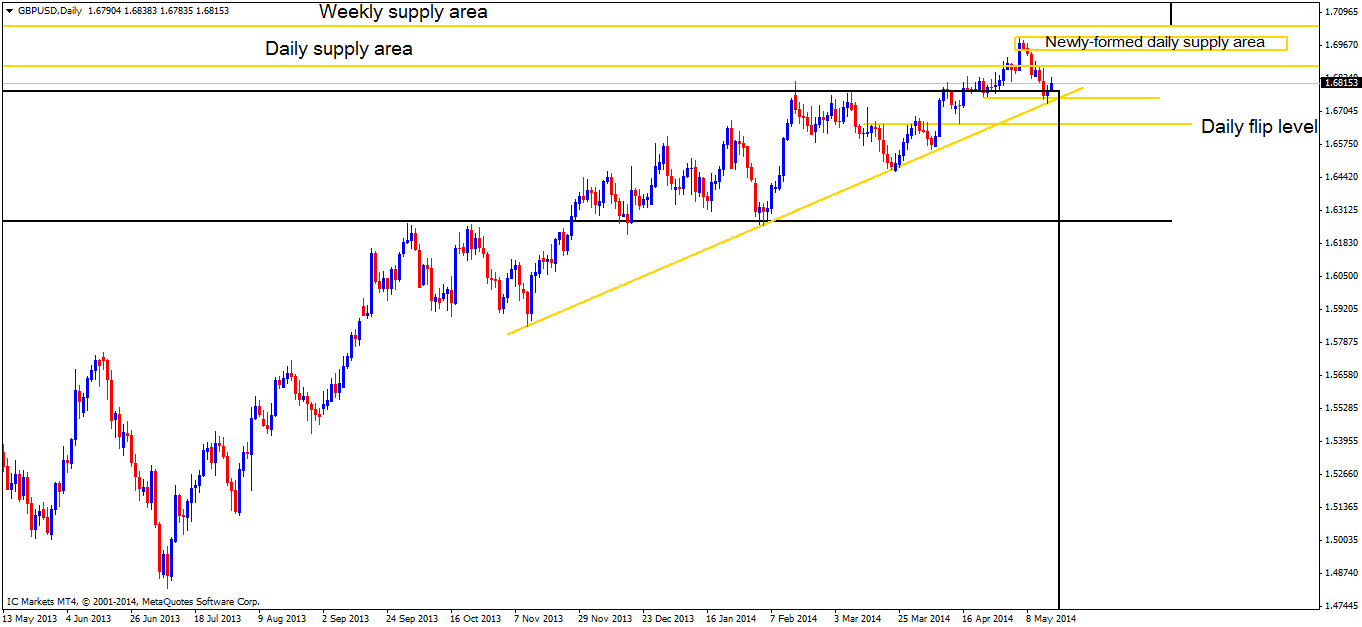
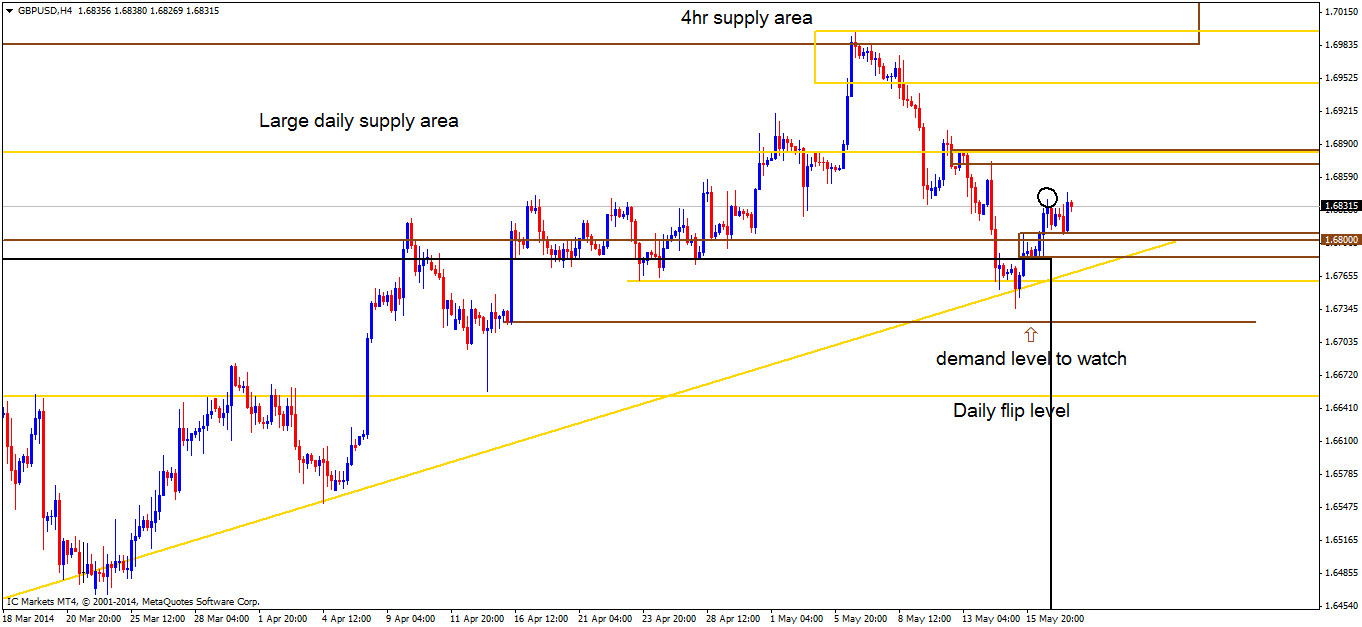
This timeframe shows price dropped from a daily supply area at 1.70410 – 1.68880 and has seen a ‘standard’ reaction thus far. The low 1.67622 provided support to the market along with daily trendline confluence. A newly-formed supply area at 1.69963 – 1.69514 has been spotted within current daily supply (levels above).

The low just mentioned (1.67622) has cleared out the majority of buyers around this area with a sneaky spike down. A per this timeframe, price may rally up to the newly-formed supply area (levels above) to collect liquidity for a further push down to the S/R flip level at 1.66630.

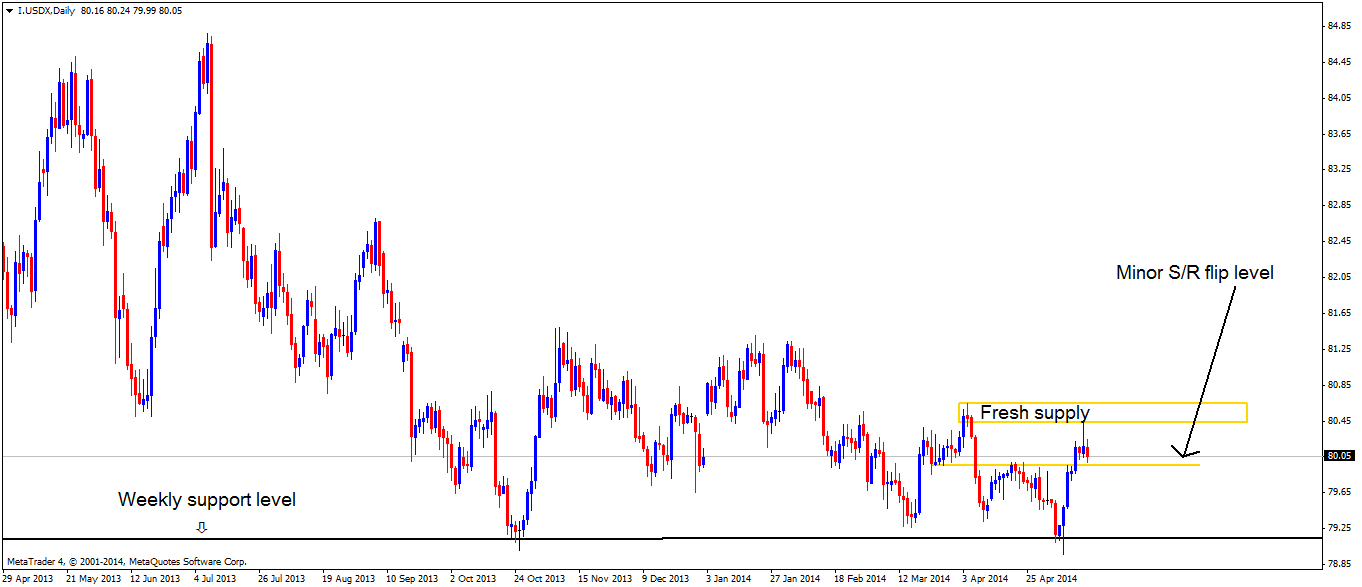
Very similar to the Euro, the Pound has reacted at a recent demand area B[/B] whilst the USDX reacted to a recent supply area at 80.65 – 80.49. For added confidence with your trading, look for the Pound to be in some sort of demand area and the USD to be in a supply zone.
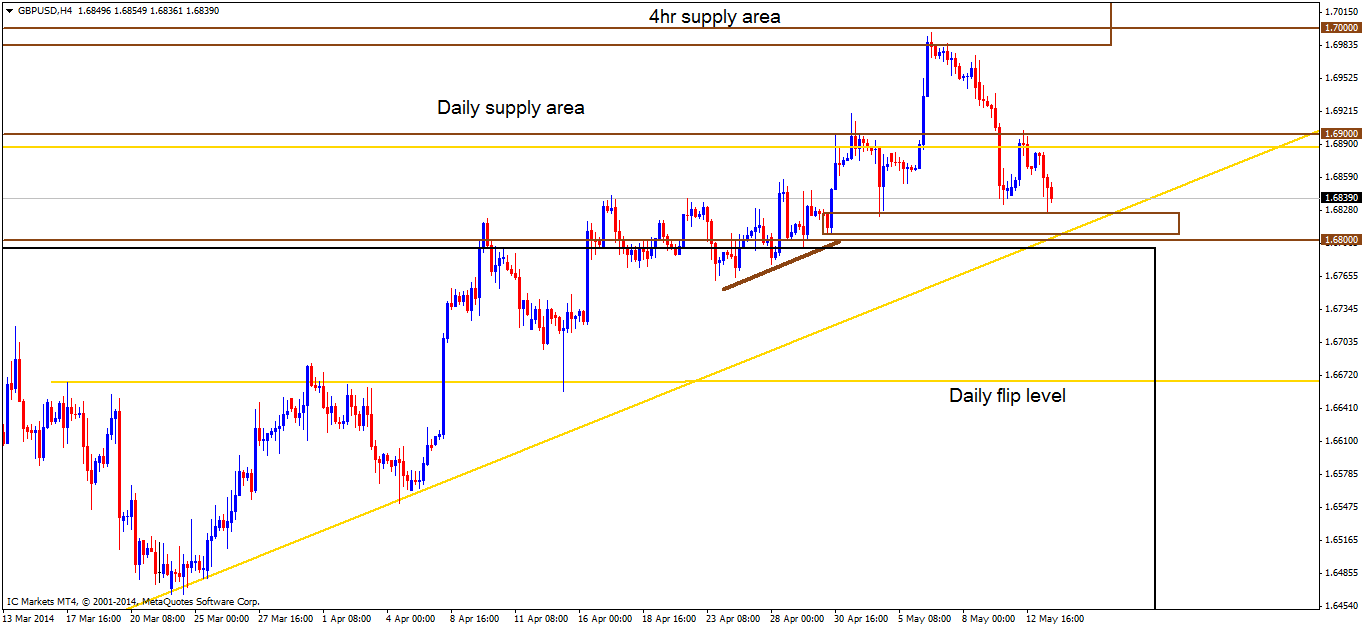
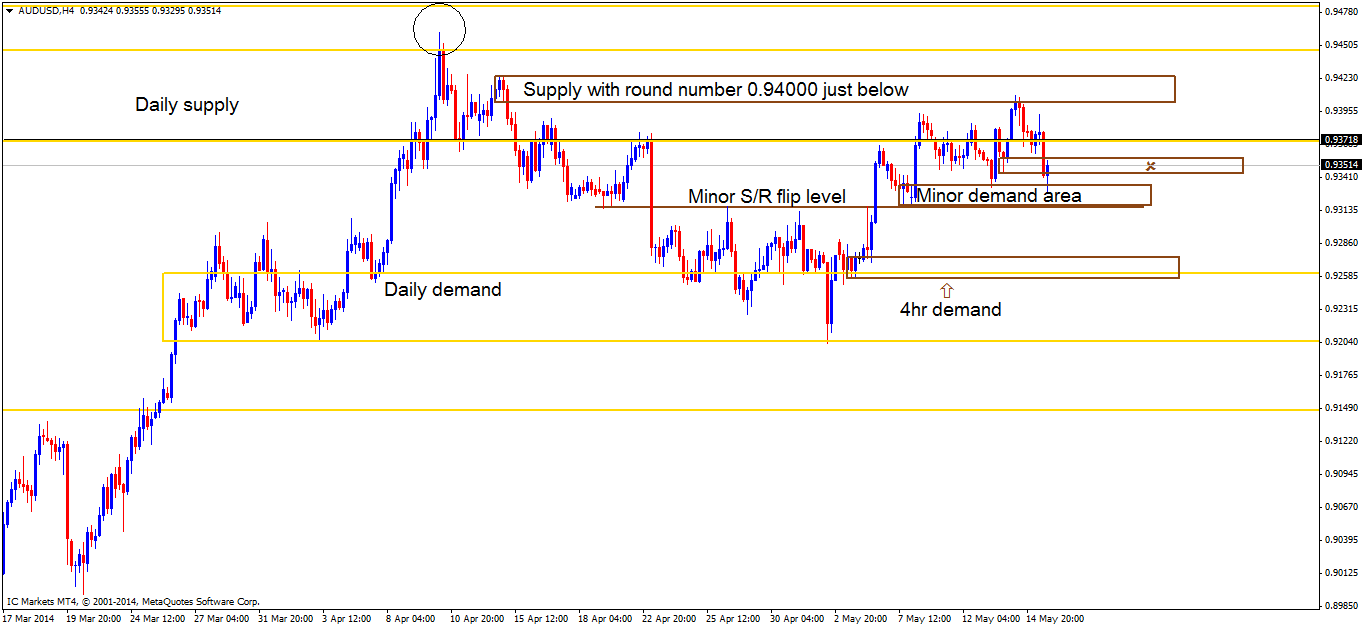
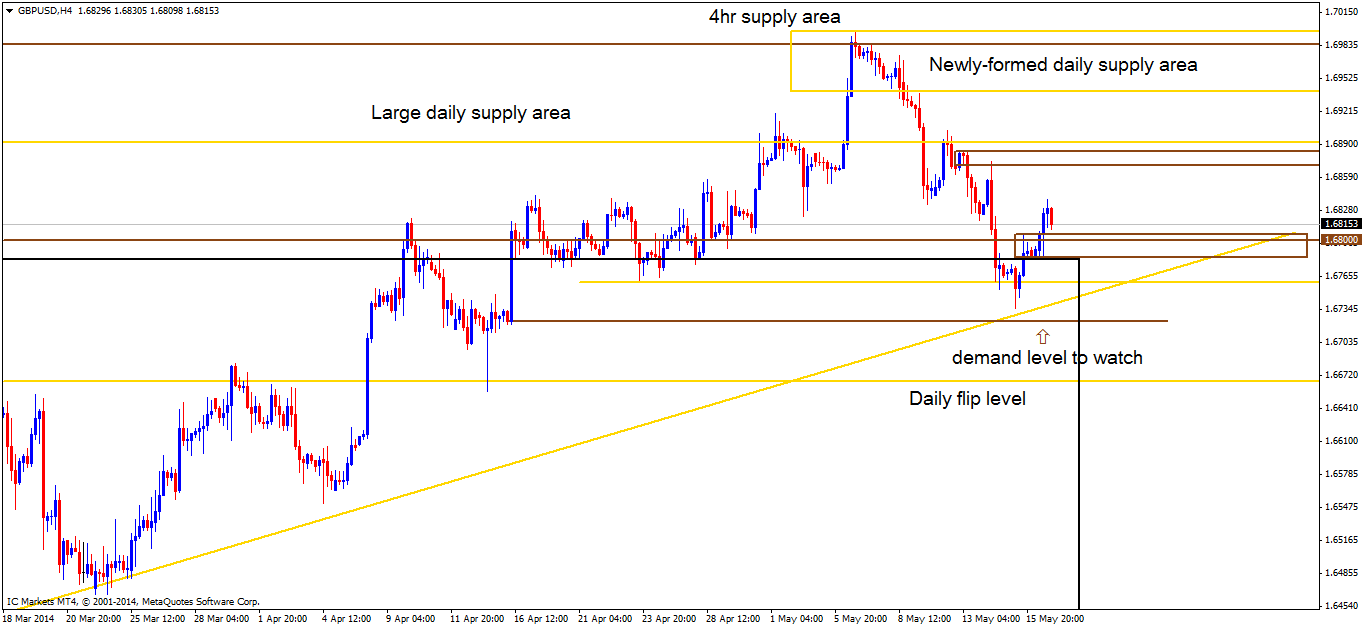
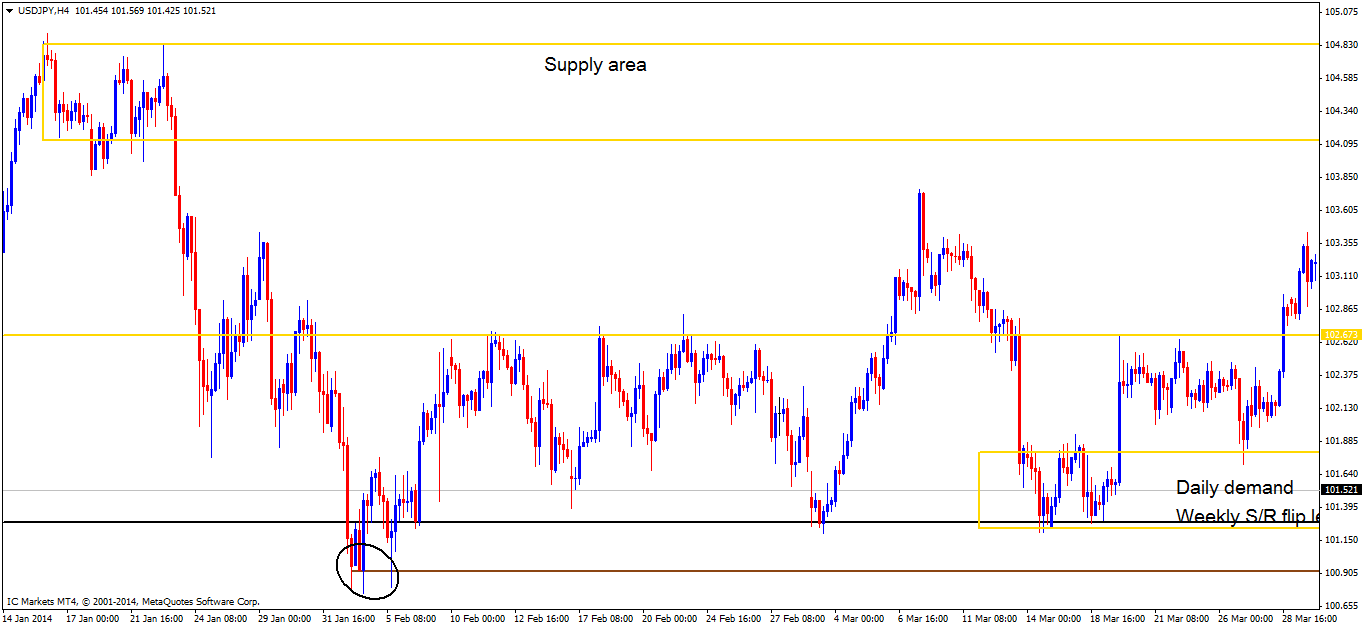
4hr TF.

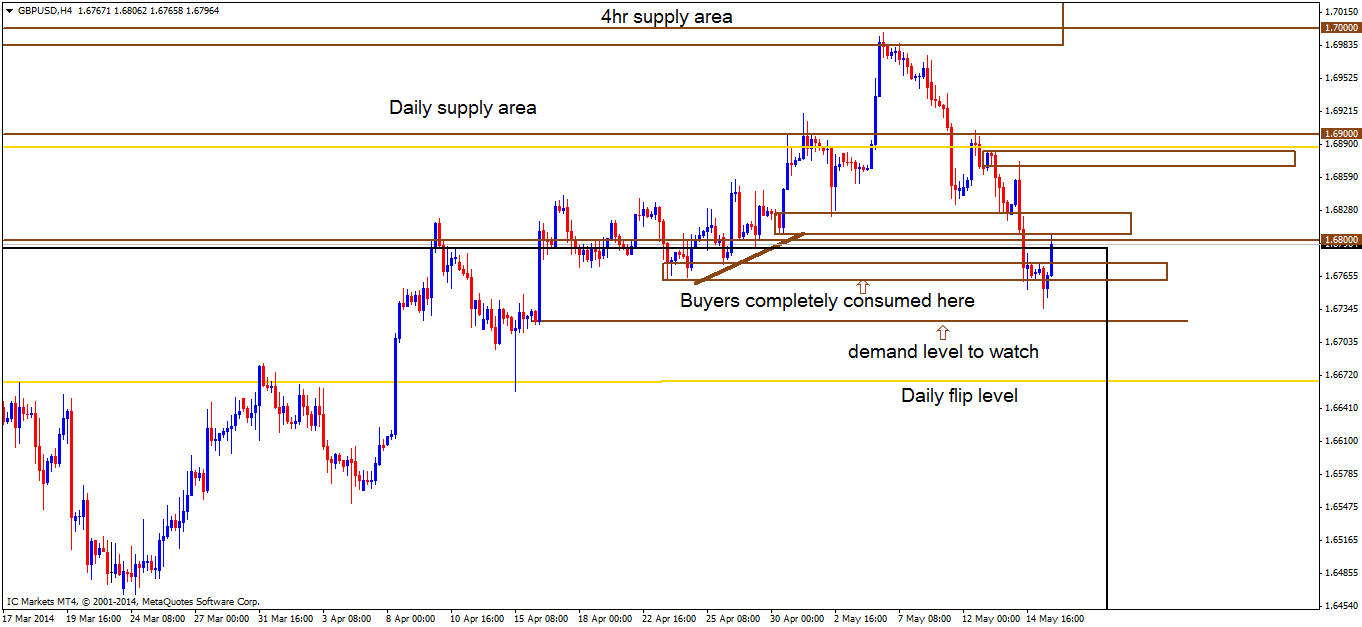
Price completely consumed the demand/supply flip area at 1.68260 – 1.68072 shown in the chart below.

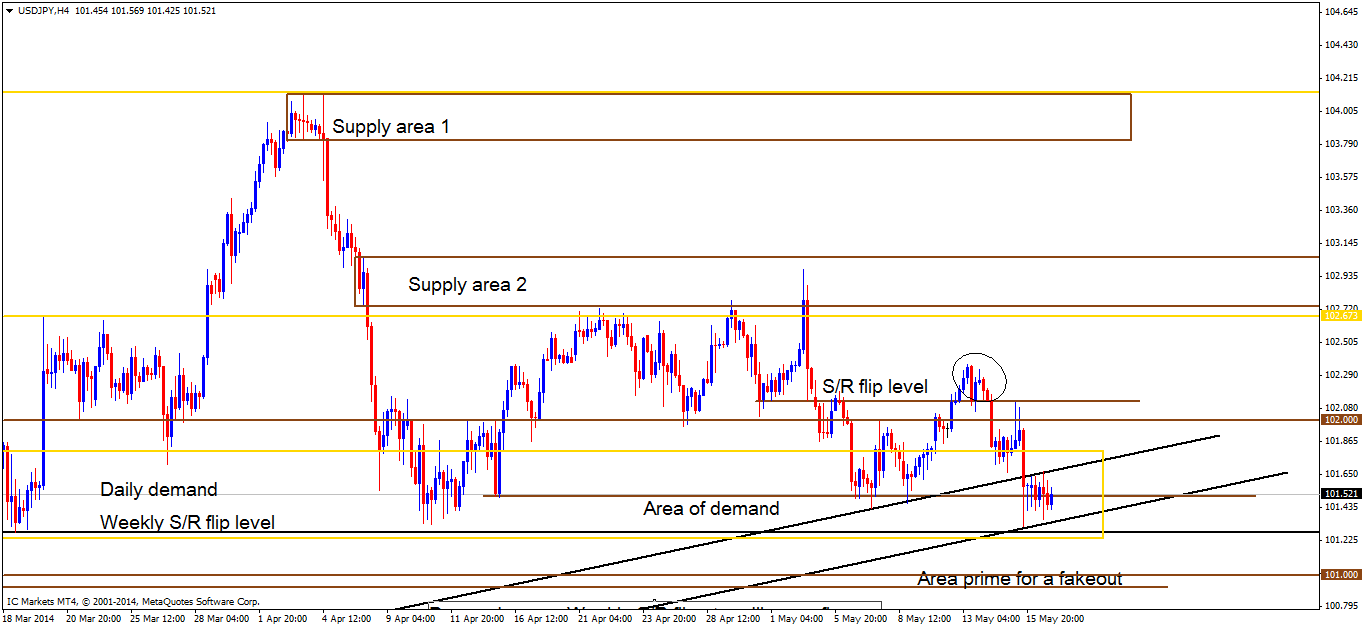
From price consuming this supply area mentioned above, a new demand area has been created at 1.67835 – 1.68062 incorporating the round number 1.68000 within as shown on the chart below. It is doubtful this area will carry much weight, as momentum from the base was very weak. Near-term supply remains at 1.68824 – 1.68714, and is a zone which may be weak due to a spike consuming sellers was seen recently.


[ul]
[li]Areas to watch for buy orders: 1.67835 – 1.68062, 1.68000.
[/li][li]Areas to watch for sell orders: 1.68824 – 1.68714.
[/li][li]Most likely scenario: A quick recap is in order – The weekly timeframe has seen a break above long-term consolidation (1.67980 – 1.42273) and we are now seeing a retest. The daily timeframe shows support in the market around the low of 1.67622 with trendline confluence. Fresh supply is seen above at 1.69963 – 1.69514. The 4hr timeframe shows a minor demand area at 1.67835 – 1.68062 with a logical-fresh demand area below at 1.67236, near-term supply is seen at 1.68824 – 1.68714 which has seen a touch already so it’s not a fresh zone.
[/li][/ul]

Taking all of this into consideration, we are likely to see higher prices this week, however do not discount the possibility of a retrace before this happens. Today’s action will likely not be too volatile due to weak data, so price will likely trade between supply at 1.68824 – 1.68714 and demand at 1.67835 – 1.68062.

AUD/USD:
Weekly TF.

Technically, not much has changed with this pair over the previous week. Price is currently trading around resistance at 0.93718 (weekly S/R flip level). Last week, a close above the prior week’s close by around 3 pips or so! Depicting what some traders call an ‘indecision candle’.

We still have to consider where would be the likely profit targets for pro money. It is doubtful it would be above to supply as the R:R is not big enough from where price is currently. The demand – fakeout zone below is more reasonable at 0.86601 – 0.88258.

Daily TF.

This timeframe resembles ‘frustrating’ price action moving in and around weak daily supply (0.94468 – 0.93758) totaling about 80 pips range movement for the entire week!

Very similar to last week’s weekly forecast, Current daily supply (levels above) is very weak due to a spike through the zone consuming sellers made on 10/04/14. If a break is seen above, the likely area to be hit next is fresh daily supply just above at 0.95434 – 0.94862.

Taking into account we are currently at a weekly resistance level at 0.93718 (S/R flip level) and the bigger profit target is below, it makes logical sense for pro money to fakeout above the week daily supply area to the fresh supply orders above (levels above) to collect liquidity for a possible drop down. Remember, pro money cannot move the market if they have no one to buy and sell to, hence the need for stop runs/fakeouts etc…

4hr TF.

On this timeframe, more information can be seen regarding what areas are actually containing price. The minor demand area at 0.93186 – 0.93345 has proved to be an area the market respects, similar to the supply area above at 0.94253 – 0.94040 which are both still currently capping price either side.

[ul]
[li]Areas to watch for buy orders: 0.93186 – 0.93345, 0.92570 – 0.92745.
[/li][li]Areas to watch for sell orders: 0.94253 – 0.94040, 0. 95434 – 0.94862.
[/li][li]Most likely scenario: Price still remains capped either side of the market by a supply area at 0.94253 – 0.94040 and a demand zone at 0.93186 – 0.93345. These two areas are presently proving to be nice short-term opportunities. However, a break of either area is imminent. If, today a break above is seen, watch the fresh daily supply area above at 0.95434 – 0.94862 for a possible bearish reaction. Likewise, if a break below happens, look for likely buyers to come into the market at the demand area highlighted below at 0.92570 – 0.92745 as mentioned in last Monday’s weekly outlook.
[/li][/ul]

Nonetheless, a break is highly unlikely today due to minimal market news being released; trading the limits between where price is capped could provide short-term returns, if entering on the lower timeframes.

USD/JPY:
Weekly TF.

A close below the weekly trendline has been seen, but as of yet, no close below the S/R flip level at 101.328. As per this timeframe, if we see a positive close below the S/R flip level (level above); be prepared for the possibility price may drop to a major weekly demand area at 96.564 – 98.231.

Daily TF.

With the close below the weekly trendline, and price very deep within a daily demand area at 101.207 – 101.754, a break to the downside is looking very possible at the moment, but always remain aware of possible fakeouts!

Following a possible break below the demand area mentioned above, the next area of demand seen on this timeframe is 99.571 – 100.132 incorporating the huge round number: 100.000 which always attracts a lot of attention.

At the time of writing, price still remains capped between supply above at 104.842 – 104.174 and a weak-looking demand area at 101.207 – 101.754.

4hr TF.

On this timeframe (chart 2) a buffer trendline has been added to show clearly where the break south occurred. Friday’s price action was quite disappointing as a bigger reaction was expected due to being at the weekly S/R flip level (101.328). A clear break of the 4hr demand area at 101.536 happened in the process of price dropping to the weekly S/R flip level. Price will have to make a decision soon as we are currently seeing serious weakness concerning the bulls.

Even though weakness is seen, do be prepared for a possible fakeout as mentioned above when analyzing the daily timeframe. To facilitate a fakeout the low at 100.927 with a round number (101.000) above for extra support marked with a black circle (chart 1), seems an ideal area to assist pro money with a possible fakeout just below the daily demand area at 101.207 – 101.754


[ul]
[li]Areas to watch for buy orders: 101.328, 100.927, and 101.000.
[/li][li]Areas to watch for sell orders: 102.000, 102.129 – 102.365.
[/li][li]Most likely scenario: Price will likely not be too active today as not much high-impacting data is being released today. A push down may be seen to further test the buying strength at the weekly S/R flip area (101.328) Price may make an attempt up to the round number 102.000 as the supply/fakeout zone is seen just above at 102.129 – 102.365. If in the unlikely event a break of the daily demand area (101.207 – 101.754) is seen today, be prepared for buyers to come into the market at around the 100.927/101.000 area.
[/li][/ul]

The chart levels and zones will be color coded for the benefit of readers as follows:
Weekly TF = Black. Daily TF = Gold. 4hr TF = Brown

EUR/USD:
4hr TF.

Regarding this pair, there is not much to add, technically not much has changed which was expected due to lack of high-impacting data released yesterday. We are still at somewhat of a crossroads with the Euro. Price spiked above (marked with a brown circle) supply (1) at 1.37309 – 1.36890, but is very difficult to tell the real intentions of this spike at this time. For the above spike to be considered a fakeout, price would need to consume the 4hr demand area below at 1.36434 – 1.36696 which was mentioned in last Friday’s analysis.

Conversely, the same applies for the area marked with a black circle below, was this area a fakeout of daily demand at 1.36727 – 1.37313? The only way to know with high probability is for us to wait and see which area gets consumed first, be it supply (1), or 4hr demand below (levels above).


[ul]
[li]Areas to watch for buy orders: 1.36434 – 1.36696
[/li][li]Areas to watch for sell orders: 1.37309 – 1.36890, 1.37487 – 1.37374.
[/li][li]Most likely scenario: Like yesterday, today is very quiet. However, be prepared for price to fakeout above supply area (1) at 1.37309 – 1.36890 to the demand/supply flip area above at 1.37487 – 1.37374. Price remains capped between supply (levels above), and a demand area below at 1.36434 – 1.36696 which could provide short-term buying opportunities if price reaches this level.
[/li][li]
[/li][/ul]

GBP/USD
4hr TF.

Near-term demand at 1.67835 – 1.68062 was hit, with price not even dropping down to the round number 1.68000 to collect liquidity before taking off north. The reaction seen so far looks fair considering the demand area is not the best looking. For price to show us we are going higher for a possible visit to the supply area above at 1.68824 – 1.68714, the high of 1.68383 would need to see a positive close above.

At the time of writing, price remains capped between demand at 1.67835 – 1.68062 and supply at 1.68824 – 1.68714.


[ul]
[li]Areas to watch for buy orders: 1.67835 – 1.68062, 1.68000.
[/li][li]Areas to watch for sell orders: 1.68824 – 1.68714.
[/li][li]Most likely scenario: Price will likely drop from where price is currently trading, it seems buyers may have run out of opposing traders to sell to! The drop will likely bring price back to the demand area just below at 1.67835 – 1.68062, but this time trading deeper into the zone to collect liquidity from the round number 1.68000, that way pro money might have enough liquidity locked in to move prices north to near-term supply seen at 1.68824 – 1.68714.
[/li][/ul]

AUD/USD:
4hr TF.

Similar to the Euro, technically not much has changed since Monday’s analysis. Pro money has yet to take a shot at either minor demand below at 0.93186 – 0.93345 or supply above at 0.94253 – 0.94040, which are both presently capping price either side.


[ul]
[li]Areas to watch for buy orders: 0.93186 – 0.93345, 0.92570 – 0.92745.
[/li][li]Areas to watch for sell orders: 0.94253 – 0.94040, 0. 95434 – 0.94862.
[/li][li]Most likely scenario: Exactly the same as the last analysis conducted. Price still remains capped either side of the market by a supply area at 0.94253 – 0.94040 and a demand zone at 0.93186 – 0.93345. These two areas have been giving nice short-term trading opportunities. However, a break of either area is imminent. If, today a break above is seen, watch the fresh daily supply area above at 0.95434 – 0.94862 for a possible bearish reaction. Likewise, if a break below happens, look for likely buyers to come into the market at the demand area highlighted below at 0.92570 – 0.92745 as mentioned in last Monday’s weekly outlook.
[/li][/ul]