[B]FxGrow Daily Technical Analysis – 22nd Feb, 2016[/B]
[I]By FxGrow Research & Analysis Team[/I]
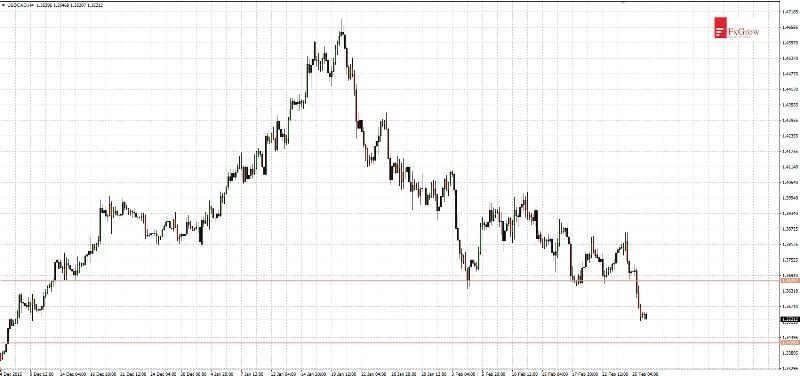
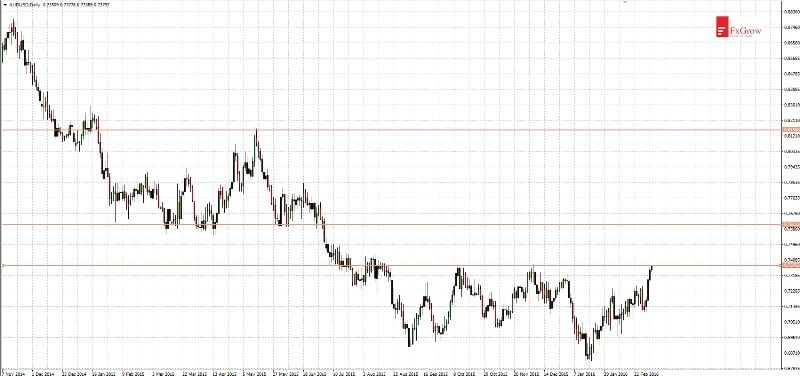
[B]USDCHF – appreciation of the dollar pushes the price towards resistance[/B]
The currency pair USD CHF been declining since the beginning of February, a dynamic drop led to a break of the trend line conducted since the one-day landslide associated with the release of the EURCHF exchange rate, as well as support around the 0.9797 level.
[B][I]To read this Full in depth Analysis please visit FxGrow.[/I][/B]
[I][B]Note:[/B] This analysis is intended to provide general information and does not constitute the provision of INVESTMENT ADVICE. Investors should, before acting on this information, consider the appropriateness of this information having regard to their personal objectives, financial situation or needs. We recommend investors obtain investment advice specific to their situation before making any financial investment decision.[/I]
[B]FxGrow Daily Technical Analysis – 23rd Feb, 2016[/B]
[I]By FxGrow Research & Analysis Team[/I]
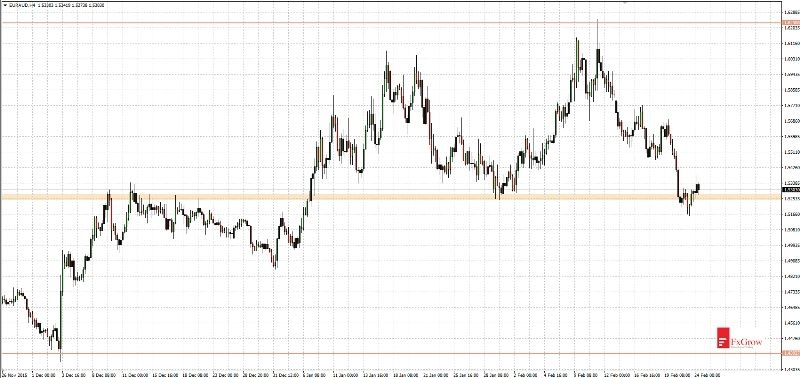
[B]EURUSD - nearest supply target 1.0980, support at 1.1100 was broke below[/B]
In the last Wednesday there were an attempt of breaking below support 1.1100, it hasn’t succeed and price moved around that region. At last support was broken yesterday and today EURUSD is continuing its declines.
[B][I]To read this Full in depth Analysis please visit FxGrow.[/I][/B]
[I][B]Note:[/B] This analysis is intended to provide general information and does not constitute the provision of INVESTMENT ADVICE. Investors should, before acting on this information, consider the appropriateness of this information having regard to their personal objectives, financial situation or needs. We recommend investors obtain investment advice specific to their situation before making any financial investment decision.[/I]
[B]FxGrow Daily Technical Analysis – 23rd Feb, 2016[/B]
[I]By FxGrow Research & Analysis Team[/I]
[B]GBPCAD - new 8-months low[/B]
Last week’s analysis was profitable for traders. I wrote: “current goal for bears is 1.9480 level” and “if price tests 1.9480 level, rebound will occur. After rebound resistances are at levels: 1.9730, 1.9890”.
[B][I]To read this Full in depth Analysis please visit FxGrow.[/I][/B]
[I][B]Note:[/B] This analysis is intended to provide general information and does not constitute the provision of INVESTMENT ADVICE. Investors should, before acting on this information, consider the appropriateness of this information having regard to their personal objectives, financial situation or needs. We recommend investors obtain investment advice specific to their situation before making any financial investment decision.[/I]
FxGrow Daily Technical Analysis – 24th Feb, 2016
By FxGrow Research & Analysis Team
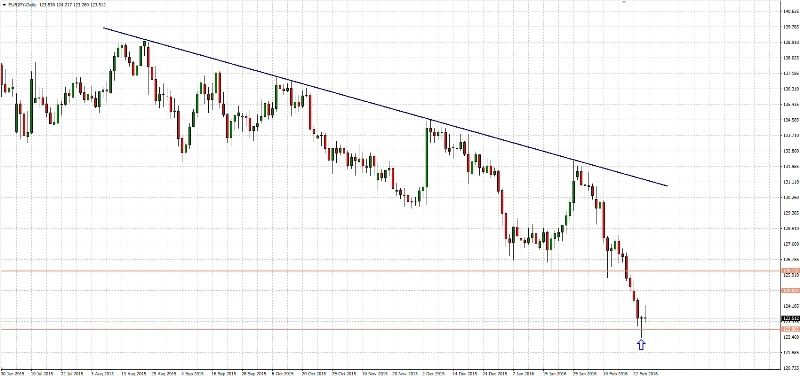
EURAUD - support at 1.5270 was defended so far
EURAUD is at the interesting level. Price already reached support at 1.5270 and that level was in game many times since December 2014. Yesterday rebound occurred, but right now it is indicating demand’s weakness. If supply breaks this level next supports will be located at 1.5000, 1.4880. However if rebound is successful nearest resistance will be located at 1.5480.
To read this Full in depth Analysis please visit FxGrow.
Note: This analysis is intended to provide general information and does not constitute the provision of INVESTMENT ADVICE. Investors should, before acting on this information, consider the appropriateness of this information having regard to their personal objectives, financial situation or needs. We recommend investors obtain investment advice specific to their situation before making any financial investment decision.
[B]FxGrow Daily Technical Analysis – 24th Feb, 2016[/B]
[I]By FxGrow Research & Analysis Team[/I]
[B]GBPUSD - forecast of brexit plunges the bulls[/B]
This week is a bulls’ nightmare. Since Monday we observe fall at GBP/USD, despite the recommendations of British Prime Minister David Cameron. He will be urging to stay in the E.U.
[B][I]To read this Full in depth Analysis please visit FxGrow.[/I][/B]
[I][B]Note:[/B] This analysis is intended to provide general information and does not constitute the provision of INVESTMENT ADVICE. Investors should, before acting on this information, consider the appropriateness of this information having regard to their personal objectives, financial situation or needs. We recommend investors obtain investment advice specific to their situation before making any financial investment decision.[/I]
FxGrow Daily Technical Analysis – 25th Feb, 2016
By FxGrow Research & Analysis Team
EURJPY - PIN BAR candle on the support
In accordance to the last week analysis declines were continued to indicated support. I wrote: “It is likely that declines will proceed. Next strong support at W1 TF could be found at 122.90”.
Time-frame D1:
To read this Full in depth Analysis please visit FxGrow.
Note: This analysis is intended to provide general information and does not constitute the provision of INVESTMENT ADVICE. Investors should, before acting on this information, consider the appropriateness of this information having regard to their personal objectives, financial situation or needs. We recommend investors obtain investment advice specific to their situation before making any financial investment decision.
[B]FxGrow Daily Technical Analysis – 25th Feb, 2016[/B]
[I]By FxGrow Research & Analysis Team[/I]
[B]EURUSD - support at 1.0980 stopped declines, it is likely that 1.1100 will be tested[/B]
Declines at EURUSD were stopped by support at 1.0980. At this level you can clearly see the support reaction. Now area 1.1100 should be tested and there we will see in which direction price wants to move in the nearest future. Return above 1.1100 will lead price to last high at 1.1380.
[B][I]To read this Full in depth Analysis please visit FxGrow.[/I][/B]
[I][B]Note:[/B] This analysis is intended to provide general information and does not constitute the provision of INVESTMENT ADVICE. Investors should, before acting on this information, consider the appropriateness of this information having regard to their personal objectives, financial situation or needs. We recommend investors obtain investment advice specific to their situation before making any financial investment decision.[/I]
FxGrow Daily Technical Analysis – 26th Feb, 2016
By FxGrow Research & Analysis Team
USDCAD - 1.3670 support broke, potential 300 pips decline
Yesterday USDCAD broke below support which has been stopping declines since the beginning of February. Nearest target for falls is located at 1.3420. If rebound occurs at indicated level nearest important resistance will be at 1.3670. Despite the current declines it’s too early to talk about new down trend which I will show at weekly time-frame.
To read this Full in depth Analysis please visit FxGrow.
Note: This analysis is intended to provide general information and does not constitute the provision of INVESTMENT ADVICE. Investors should, before acting on this information, consider the appropriateness of this information having regard to their personal objectives, financial situation or needs. We recommend investors obtain investment advice specific to their situation before making any financial investment decision.
FxGrow Daily Technical Analysis – 26th Feb, 2016
By FxGrow Research & Analysis Team
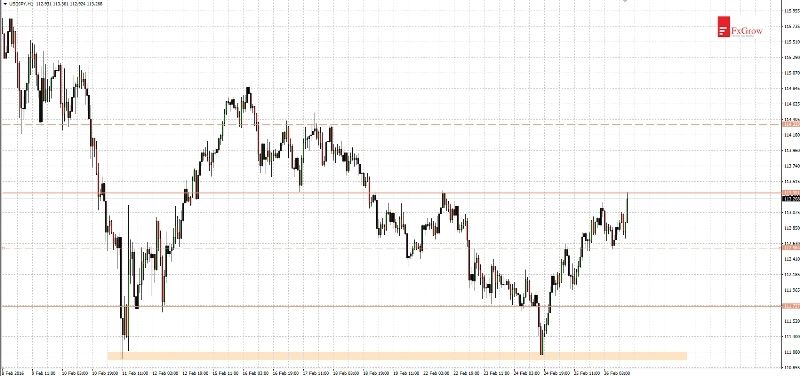
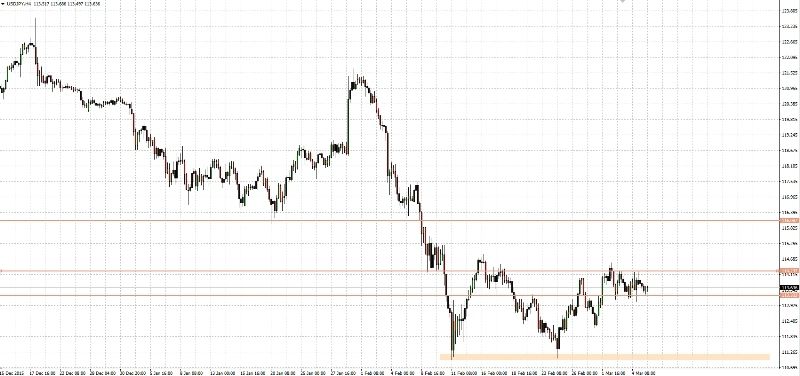
USDJPY - dollar appreciated after macroeconomic data
After Friday’s macroeconomic data (US GDP) publication dollar sharply appreciated versus other currencies. EURUSD dynamically reached support at 1.0980 and USDJPY tested resistance at 113.35.
Situation at USDJPY is very interesting because after double bottom pattern, current upward movement began. Nearest resistances are at levels: 113.35, 114.50, 116.10.
To read this Full in depth Analysis please visit FxGrow.
Note: This analysis is intended to provide general information and does not constitute the provision of INVESTMENT ADVICE. Investors should, before acting on this information, consider the appropriateness of this information having regard to their personal objectives, financial situation or needs. We recommend investors obtain investment advice specific to their situation before making any financial investment decision.
[B]FxGrow Daily Technical Analysis – 29th Feb, 2016[/B]
[I]By FxGrow Research & Analysis Team[/I]
[B]GBPNZD - demand reaction at very interesting level[/B]
Last week analysis was profitable. I wrote: “Today support was broken (it stopped declines for 2 months) and right now there is a clear path for bears to test 2.0800”. In the area 2.0800 there is an equal A=B of current correction. This level is strengthened by important support.
[B][I]To read this Full in depth Analysis please visit FxGrow.[/I][/B]
[I][B]Note:[/B] This analysis is intended to provide general information and does not constitute the provision of INVESTMENT ADVICE. Investors should, before acting on this information, consider the appropriateness of this information having regard to their personal objectives, financial situation or needs. We recommend investors obtain investment advice specific to their situation before making any financial investment decision.[/I]
[B]FxGrow Daily Technical Analysis – 29th Feb, 2016[/B]
[I]By FxGrow Research & Analysis Team[/I]
[B]AUDCAD - reached lower limit of bearish channel[/B]
Friday brought huge selloff at AUDCAD. Falls ranging almost 200 pips during just one session certainly isn’t a common picture. Bears broke three important supports 0.9820, 0.9730, 0.9650. Today’s rebound started by bulls finished with a long upper shadow on the chart.
[B][I]To read this Full in depth Analysis please visit FxGrow.[/I][/B]
[I][B]Note:[/B] This analysis is intended to provide general information and does not constitute the provision of INVESTMENT ADVICE. Investors should, before acting on this information, consider the appropriateness of this information having regard to their personal objectives, financial situation or needs. We recommend investors obtain investment advice specific to their situation before making any financial investment decision.[/I]
[B]FxGrow Daily Technical Analysis – 01st March, 2016[/B]
[I]By FxGrow Research & Analysis Team[/I]
[B]EURUSD - on the way to 1.0810 [/B]
On last Friday price broke below support at 1.0980 and downward movement is continuing. Period of low volatility at EURUSD should has been already finished, because in next three weeks there will be important macro events which should cause higher volatility (US non-farm payrolls, ECB meeting, FED meeting).
[B][I]To read this Full in depth Analysis please visit FxGrow.[/I][/B]
[I][B]Note:[/B] This analysis is intended to provide general information and does not constitute the provision of INVESTMENT ADVICE. Investors should, before acting on this information, consider the appropriateness of this information having regard to their personal objectives, financial situation or needs. We recommend investors obtain investment advice specific to their situation before making any financial investment decision.[/I]
[B]FxGrow Daily Technical Analysis – 01st March, 2016[/B]
[I]By FxGrow Research & Analysis Team[/I]
[B]EURCAD - 80 pips left to important support[/B]
Downward movement at EURCAD is continuing after broke below support in last week. It is likely that today’s session will bring fifth downward candle in a row. Supply should test 1.4520 area, where price need only 80 pips to achieve that level. That level is the nearest strong support and 40 pips lower there is a 78.6% Fibonacci retracement of previous upward movement.
[B][I]To read this Full in depth Analysis please visit FxGrow.[/I][/B]
[I][B]Note:[/B] This analysis is intended to provide general information and does not constitute the provision of INVESTMENT ADVICE. Investors should, before acting on this information, consider the appropriateness of this information having regard to their personal objectives, financial situation or needs. We recommend investors obtain investment advice specific to their situation before making any financial investment decision.[/I]
[B]FxGrow Daily Technical Analysis – 02nd March, 2016[/B]
[I]By FxGrow Research & Analysis Team[/I]
[B]EURAUD - lowest since two months [/B]
Declines accelerated after EURAUD broke below support at 1.5270. Today price tested next support at 1.5000, but currently there are no signs that declines may end. Next weak supports are located at: 1.4890, 1.4730. Nearest strong support is 600 pips below current level at 1.4400.
[B][I]To read this Full in depth Analysis please visit FxGrow.[/I][/B]
[I][B]Note:[/B] This analysis is intended to provide general information and does not constitute the provision of INVESTMENT ADVICE. Investors should, before acting on this information, consider the appropriateness of this information having regard to their personal objectives, financial situation or needs. We recommend investors obtain investment advice specific to their situation before making any financial investment decision.[/I]
[B]FxGrow Daily Technical Analysis – 03rd March, 2016[/B]
[I]By FxGrow Research & Analysis Team[/I]
[B]GBPUSD - upward movement reached first resistance [/B]
After huge selloff during last week, GBPUSD reached 1.3850 support. At this area we observe lows from 2009 and since the beginning of current week area caused a rebound. The goal for market demand side won’t be easy because price is in downtrend, however after so big selloff rebound’s range might be big.
[B][I]To read this Full in depth Analysis please visit FxGrow.[/I][/B]
[I][B]Note:[/B] This analysis is intended to provide general information and does not constitute the provision of INVESTMENT ADVICE. Investors should, before acting on this information, consider the appropriateness of this information having regard to their personal objectives, financial situation or needs. We recommend investors obtain investment advice specific to their situation before making any financial investment decision.[/I]
[B]FxGrow Daily Technical Analysis – 03rd March, 2016[/B]
[I]By FxGrow Research & Analysis Team[/I]
[B]AUDCAD - dynamic rebound from lower limit of a bearish channel [/B]
Monday’s analysis was very profitable. Rebound that occurred was much faster and more dynamic than it was expected after last weeks’ weakness of demand. I wrote on Monday: ‘Potential test of channel lower limit gives a chance for a rebound. Support located at area 0.9600 - 0.9650 may also help with the rebound move’.
[B][I]To read this Full in depth Analysis please visit FxGrow.[/I][/B]
[I][B]Note:[/B] This analysis is intended to provide general information and does not constitute the provision of INVESTMENT ADVICE. Investors should, before acting on this information, consider the appropriateness of this information having regard to their personal objectives, financial situation or needs. We recommend investors obtain investment advice specific to their situation before making any financial investment decision.[/I]
FxGrow Daily Technical Analysis – 04th March, 2016
By FxGrow Research & Analysis Team
AUDUSD - third test of important resistance
AUDUSD reached to resistance at area 0.7380. Last time price was so high three months ago and it finished new low. If demand breaks above current support, next target will be located at 0.7610. However only break above level 0.8160 will be a strong signal to trend reversal. At current level it is likely that rebound occurs and will be a new downtrend wave because of the main train, what I will show at time-frame weekly.
To read this Full in depth Analysis please visit FxGrow.
Note: This analysis is intended to provide general information and does not constitute the provision of INVESTMENT ADVICE. Investors should, before acting on this information, consider the appropriateness of this information having regard to their personal objectives, financial situation or needs. We recommend investors obtain investment advice specific to their situation before making any financial investment decision.
FxGrow Daily Technical Analysis – 07th March, 2016
By FxGrow Research & Analysis Team
USDJPY side trend after rebound from support and double bottom pattern
Since a week USDJPY moves between 113.30 - 114.20. Side trend occurred after dynamic rebound from area 111.00. There was a support strenghtened by double bottom pattern. If indicated level 113.30 brakes successfully it is likely that third test of 111.00 will occur. It have to be noted that main trend at USDJPY is downward one and it is more likely that there will be a new wave of falls than new uptrend movement.
Time-frame H4
To read this Full in depth Analysis please visit FxGrow.
Note: This analysis is intended to provide general information and does not constitute the provision of INVESTMENT ADVICE. Investors should, before acting on this information, consider the appropriateness of this information having regard to their personal objectives, financial situation or needs. We recommend investors obtain investment advice specific to their situation before making any financial investment decision.
[B]FxGrow Daily Technical Analysis – 08th March, 2016[/B]
[I]By FxGrow Research & Analysis Team[/I]
[B]EURUSD - nearest target for demand 1.1070 [/B]
After huge EURUSD volatility last saw on Friday (just after US non-farm payrolls data), yesterday’s session was similar. At the beginning supply broke below support at 1.0980 but in the afternoon failed to move further and demand was on the top. Today EURUSD is continuing upward movement and price achived new local high. Nearest important resistance is located at 1.1070.
[B][I]To read this Full in depth Analysis please visit FxGrow.[/I][/B]
[I][B]Note:[/B] This analysis is intended to provide general information and does not constitute the provision of INVESTMENT ADVICE. Investors should, before acting on this information, consider the appropriateness of this information having regard to their personal objectives, financial situation or needs. We recommend investors obtain investment advice specific to their situation before making any financial investment decision.[/I]