Daily Technical Analysis by FxGrow

[B]FxGrow Daily Technical Analysis – 15th Aug, 2016[/B]
[I]By FxGrow Research & Analysis Team[/I]
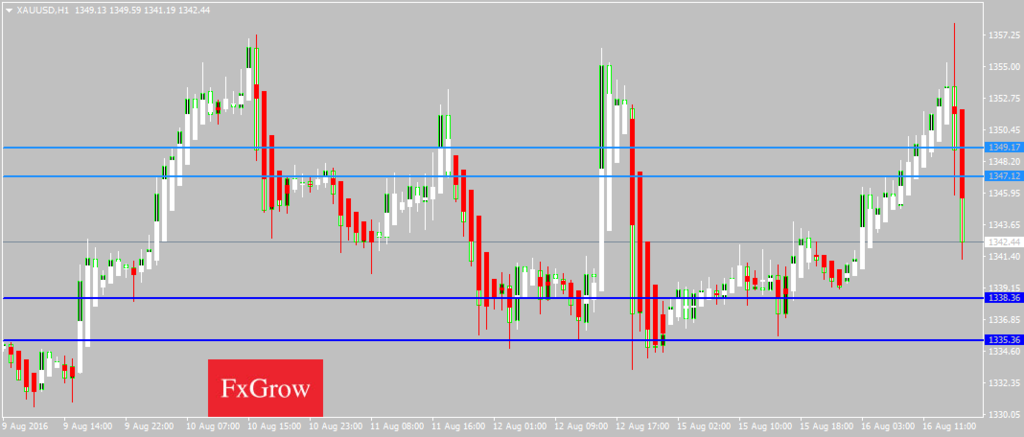
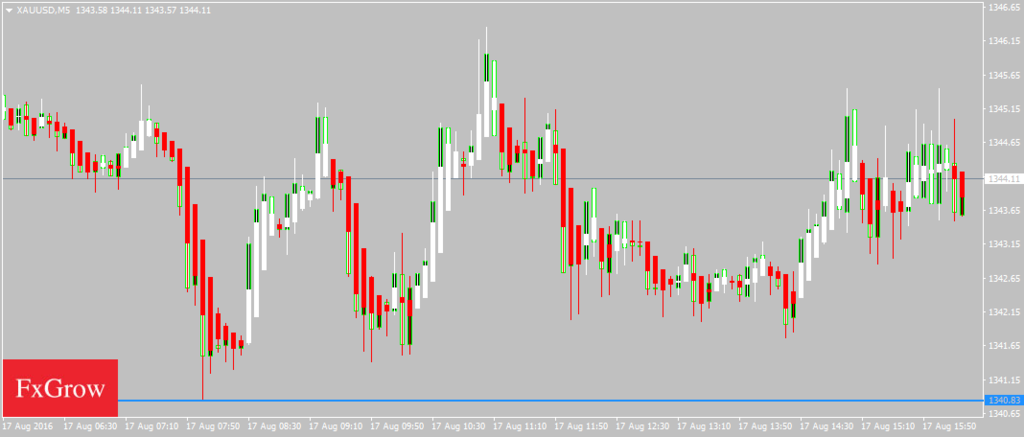
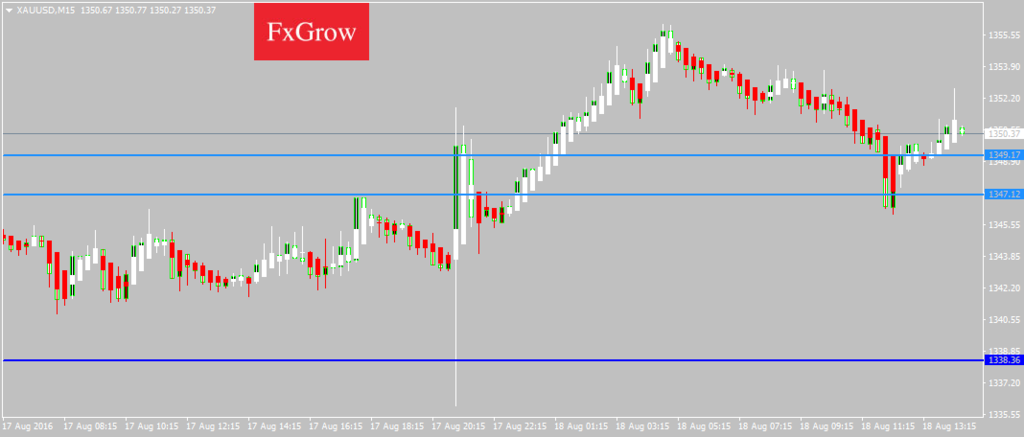
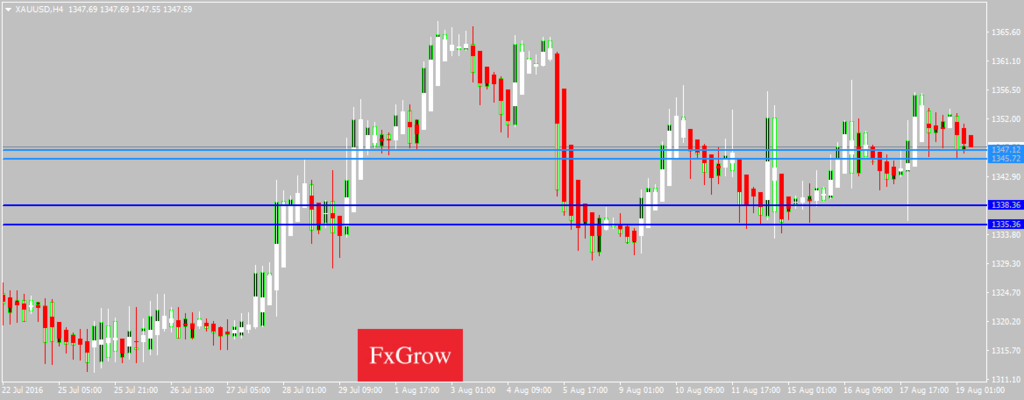
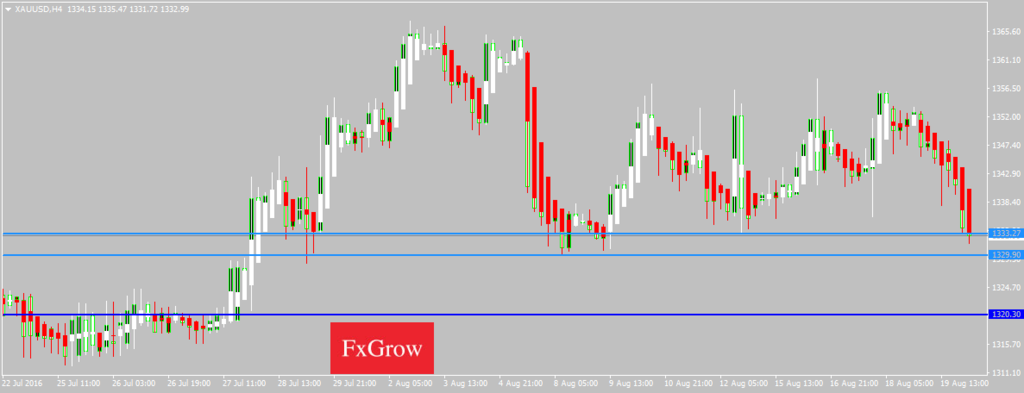
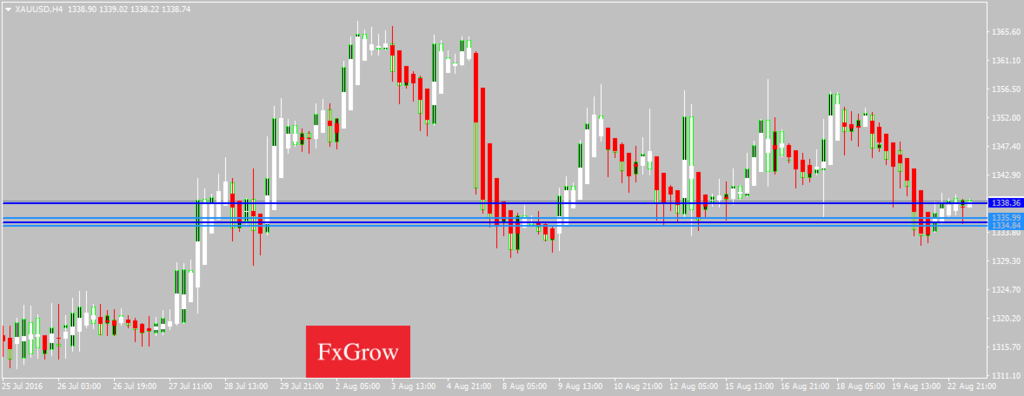
[B]XAUUSD[Gold][/B]

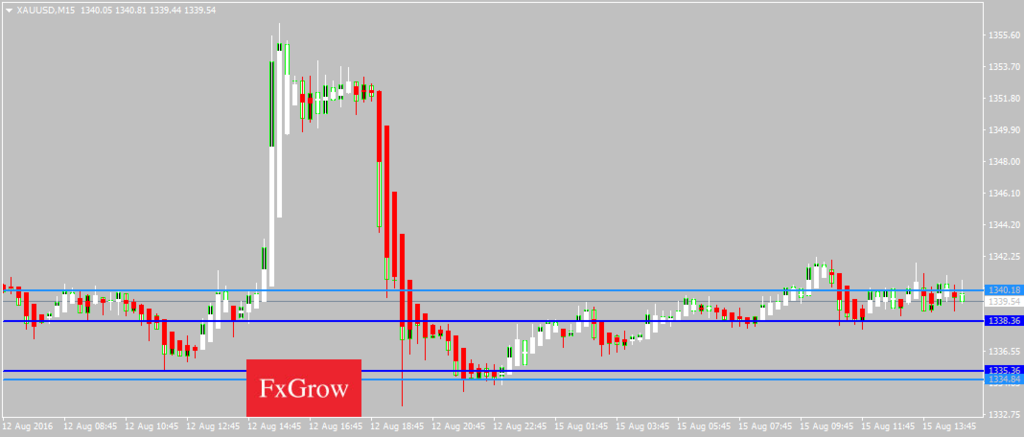
XAUUSD was indecisive last week as it touched a low of 1329.99 and a high of 1356.67 towards the end of the closing session. Gold is moving in a consolidation phase today and is now trading below its 100day SMA of 1348.31 in the European trading session. [B]The near term bias is Neutral with sideways moves expected[/B].

Support is at 1333.96 while Resistance is at 1346.45 and 1348.65

[B][I]15th Aug 2016 – 12:15AM (UTC)[/I][/B]

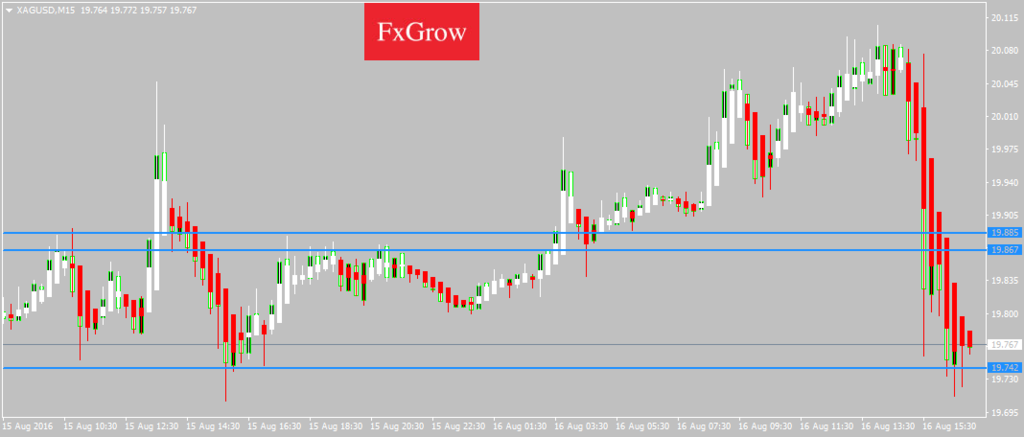
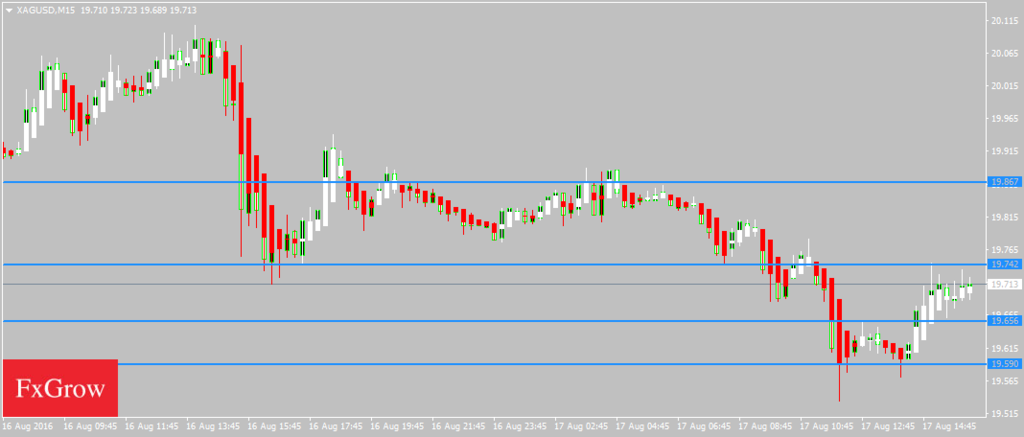
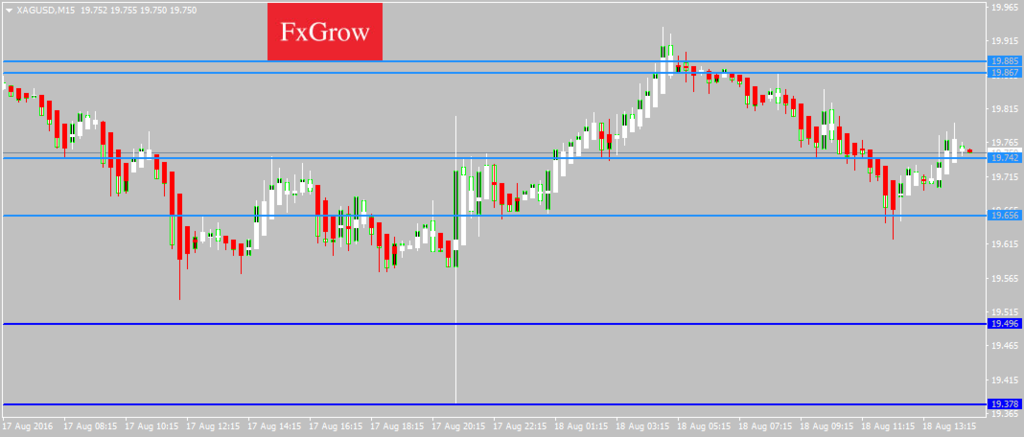
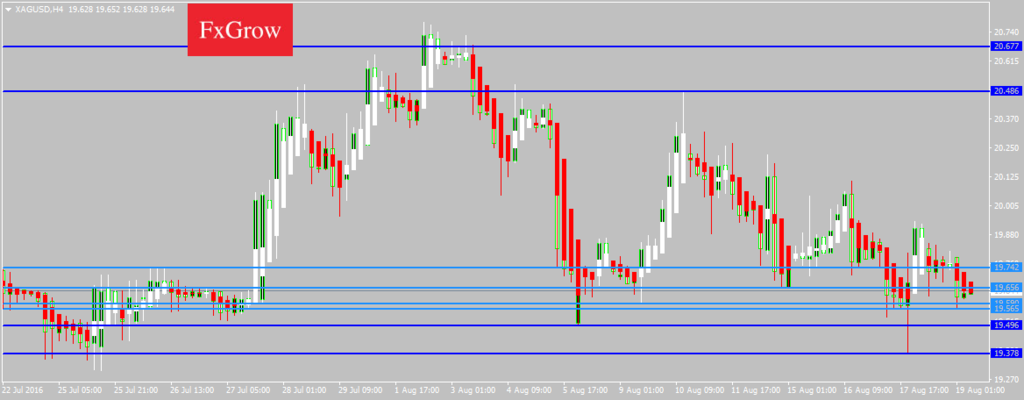
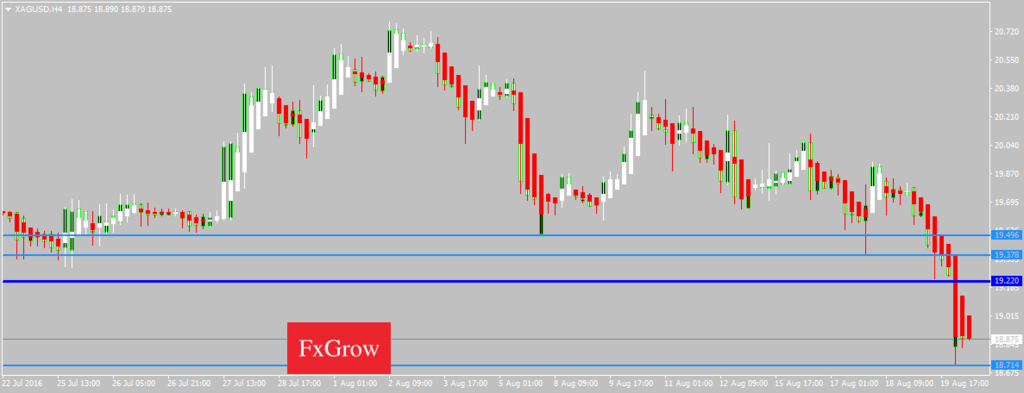
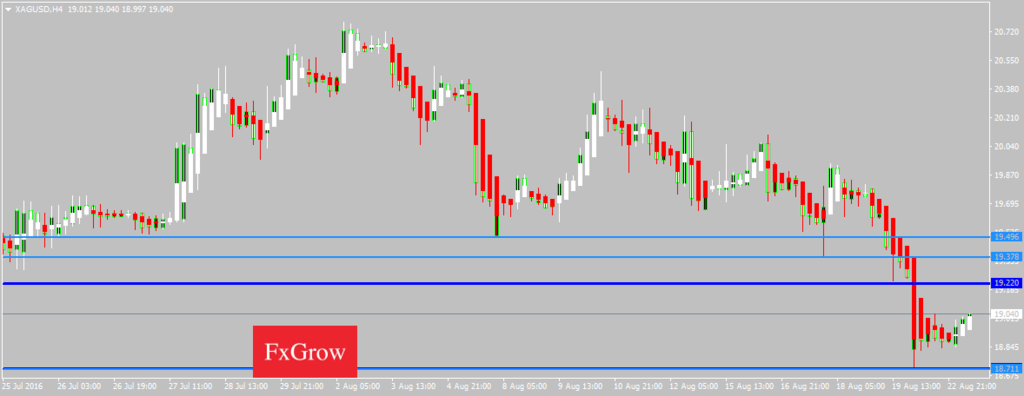
[B]XAGUSD[Silver][/B]

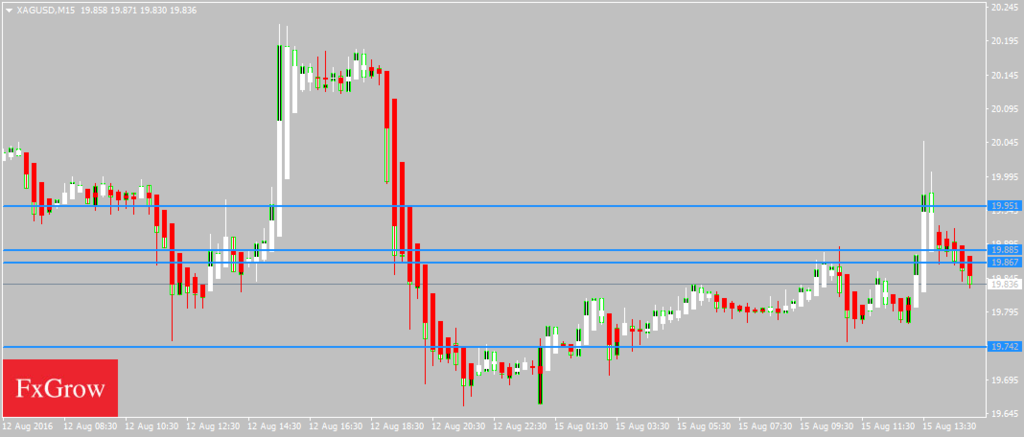
XAGUSD was indecisive last week as it touched a low of 19.58 and a high of 20.48 coming down towards the end of the closing session. Silver is moving in a consolidation phase today and is now trading below its 100day SMA of 19.99 in the European trading session. [B]The near term bias is Neutral[/B]

Support is at 19.65 while Resistance is at 19.86 and 20.00

[B][I]15th Aug 2016 – 12:18AM (UTC)[/I][/B]
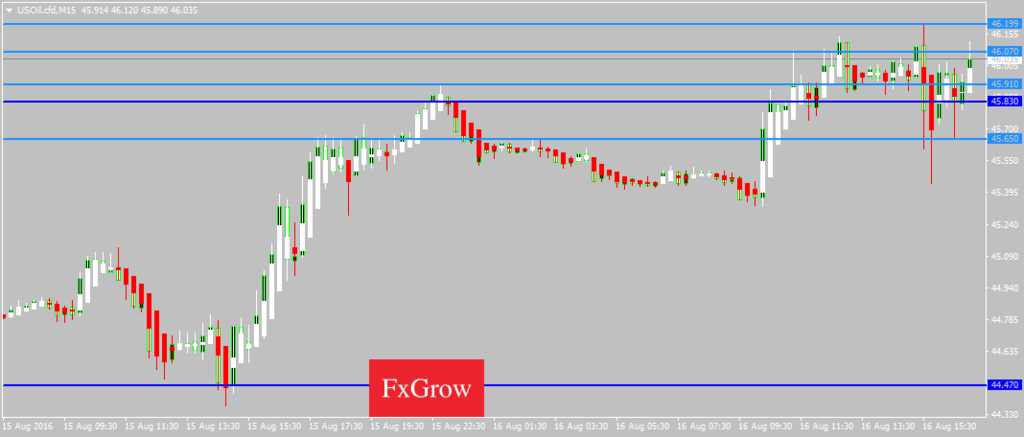
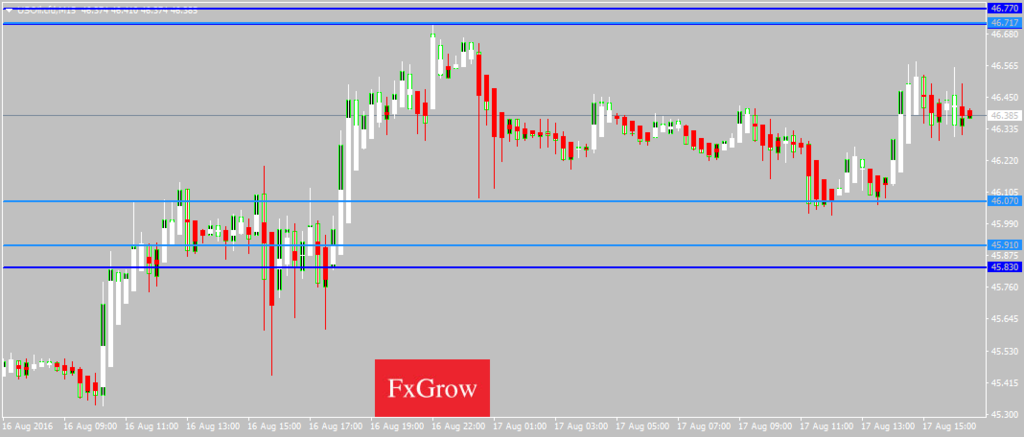
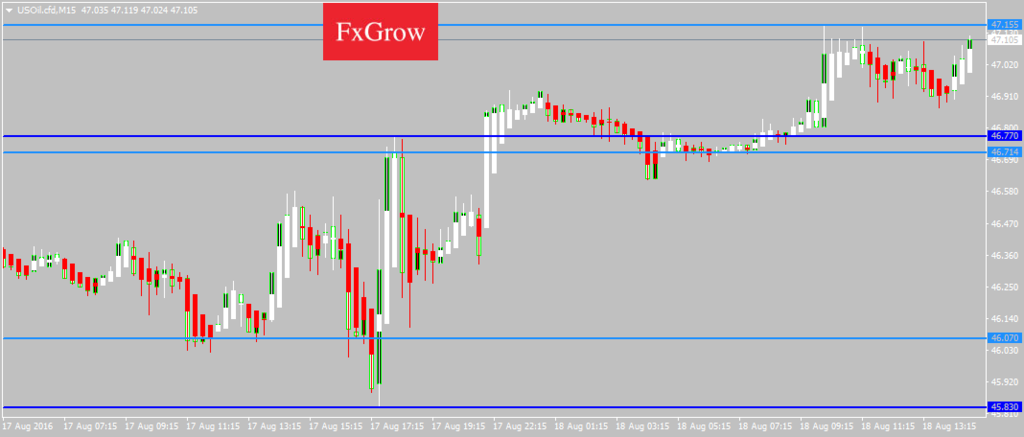
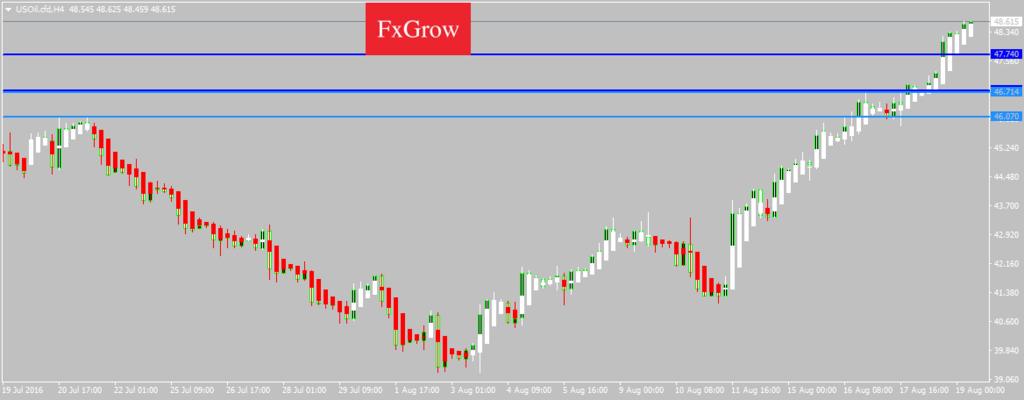
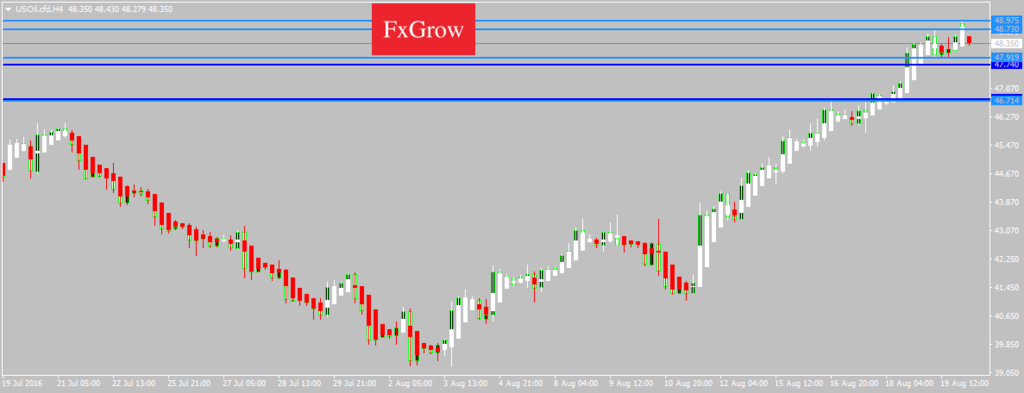
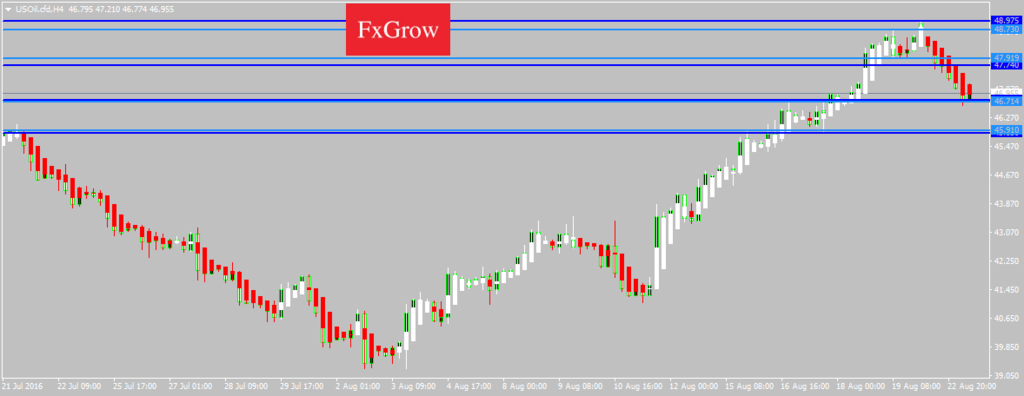
[B]USOil.cfd[/B]

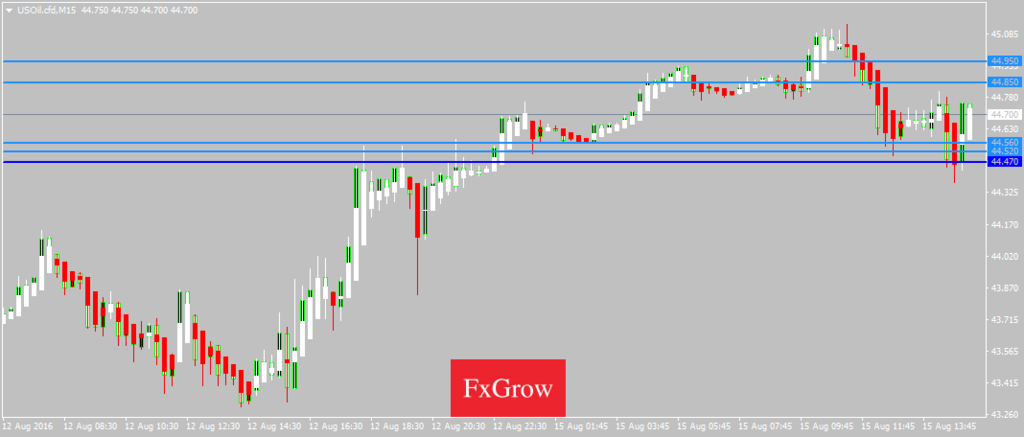
US Oil was bullish last week as it crossed the 44 handle and remained strong towards the closing session. US Oil is moving in a consolidation phase today and is now trading above its 100day SMA of 43.10 in the European trading session. [B]The near term bias is Neutral[/B]

Support is at 44.47 while Resistance is at 44.85 and 44.95

[B][I]15th Aug 2016 – 12:23AM (UTC)[/I][/B]

[B][I]For more in depth Research & Analysis please visit FxGrow.[/I][/B]

[I][B]Note:[/B] This analysis is intended to provide general information and does not constitute the provision of INVESTMENT ADVICE. Investors should, before acting on this information, consider the appropriateness of this information having regard to their personal objectives, financial situation or needs. We recommend investors obtain investment advice specific to their situation before making any financial investment decision.[/I]

FxGrow Daily Technical Analysis – 16th Aug, 2016
By FxGrow Research & Analysis Team

EURUSD

EURUSD was in a consolidation phase yesterday and remained above the 1.1150 handle towards the end of the trading session. Euro is moving in a strong bullish momentum having touched a top of 1.1322 and is now trading above its 100day SMA of 1.1175 in the European trading session. The near term bias is Bullish with targets of 1.1350

RSI (14), STOCH (9, 6), MACD (12, 26), ADX (14), CCI (14), Ultimate Oscillator, ROC indicate a BUY; while Average True Range (14) indicates High Volatility.

Support is at 1.1197 while Resistance is at 1.1322 and 1.1326

16th Aug 2016 – 13:34AM (UTC)

GBPUSD

GBPUSD was bearish yesterday as it touched a low of 1.2866 and remained weak towards the end of the trading session. Cable is moving in a bullish tone today having already crossed 1.2980 levels and is now trading above its 100day SMA of 1.2952 in the European trading session. The near term bias is Bullish with targets of 1.3030

RSI (14), STOCH (9, 6), MACD (12, 26), ADX (14), CCI (14), MA100 indicate a BUY; STOCHRSI (14) is Overbought; while Average True Range (14) indicates High Volatility.

Support is at 1.2865 while Resistance is at 1.3011 and 1.3075

16th Aug 2016 – 13:37AM (UTC)

For more in depth Research & Analysis please visit FxGrow.

Note: This analysis is intended to provide general information and does not constitute the provision of INVESTMENT ADVICE. Investors should, before acting on this information, consider the appropriateness of this information having regard to their personal objectives, financial situation or needs. We recommend investors obtain investment advice specific to their situation before making any financial investment decision.

FxGrow Daily Technical Analysis – 16th Aug, 2016
By FxGrow Research & Analysis Team

AUDUSD

AUDUSD was mildly bullish yesterday as it touched a top of 0.7690 and remained firm towards the end of the trading session. AUDUSD is moving in a mild bearish tone after having touched an intraday high of 0.7729 and is now trading just below its 100day SMA of 0.7691 in the European trading session. The near term bias is Neutral

ADX (14), CCI (14) are Neutral; while Average True Range (14) indicates High Volatility.

Support is at 0.7670 while Resistance is at 0.7744 and 0.7792

16th Aug 2016 – 13:50AM (UTC)

USDJPY

USDJPY was indecisive yesterday as it remained flat towards the end of the trading session. Dollar-Yen had a strong bearish momentum today as it touched a low of 99.54 but has since then recovered and is now trading below its 100day SMA of 101.26 in the European trading session. The near term bias is Bearish with targets of 99.50

RSI (14), STOCH (9, 6), MACD (12, 26), ADX (14), Ultimate Oscillator, ROC indicate a SELL; STOCHRSI (14) is Overbought; while Average True Range (14) indicates High Volatility.

Support is at 99.54 while Resistance is at 100.68 and 100.83

16th Aug 2016 – 13:55AM (UTC)

For more in depth Research & Analysis please visit FxGrow.

Note: This analysis is intended to provide general information and does not constitute the provision of INVESTMENT ADVICE. Investors should, before acting on this information, consider the appropriateness of this information having regard to their personal objectives, financial situation or needs. We recommend investors obtain investment advice specific to their situation before making any financial investment decision.

FxGrow Daily Technical Analysis – 16th Aug, 2016
By FxGrow Research & Analysis Team

XAUUSD[Gold]

XAUUSD was indecisive yesterday and remained flat towards the end of the trading session. Gold is moving in a bearish tone after having touched an intraday high of 1358 and is now trading below its 100day SMA of 1349.08 in the European trading session. The near term bias is Bearish with targets of 1330

RSI (14), CCI (14), Ultimate Oscillator, MA100 indicate a SELL; STOCHRSI (14) is Oversold; STOCH (9, 6) is Neutral; while Average True Range (14) indicates High Volatility.

Support is at 1334.84 while Resistance is at 1361.71 and 1373.96

16th Aug 2016 – 14:00AM (UTC)

XAGUSD[Silver]

XAGUSD was indecisive yesterday as it touched a low of 19.70 and a high of 20.04 towards the end of the trading session. Silver is moving in a strong bearish momentum after having touched an intraday high of 20.10 and is now trading below its 100day SMA of 19.99 in the European trading session. The near term bias is Bearish with targets of 19.50

RSI (14), CCI (14), Ultimate Oscillator, ROC, MA100 indicate a SELL; STOCHRSI (14) is Oversold; ADX (14) is Neutral; while Average True Range (14) indicates High Volatility.

Support is at 19.51 while Resistance is at 19.87 and 20.06

16th Aug 2016 – 14:07AM (UTC)

USOil.cfd

US Oil was bullish yesterday as it crossed the 45.50 handle and remained firm towards the end of the trading session. US Oil is moving in a bullish tone as it touched an intraday high of 46.14 and is now trading above its 100day SMA of 43.82 in the European trading session. The near term bias is Bullish with targets of 46.50

RSI (14), STOCH (9, 6), STOCHRSI (14), MACD (12, 26), CCI (14) indicate a BUY; ADX (14) is Neutral; while Average True Range (14) indicates High Volatility.

Support is at 45.55 while Resistance is at 46.07 and 46.43

16th Aug 2016 – 14:13AM (UTC)

For more in depth Research & Analysis please visit FxGrow.

Note: This analysis is intended to provide general information and does not constitute the provision of INVESTMENT ADVICE. Investors should, before acting on this information, consider the appropriateness of this information having regard to their personal objectives, financial situation or needs. We recommend investors obtain investment advice specific to their situation before making any financial investment decision.

FxGrow Daily Technical Analysis – 17th Aug, 2016
By FxGrow Research & Analysis Team

EURUSD

EURUSD was bullish yesterday as it touched a high of 1.1322 and remained firm towards the end of the trading session. Euro is moving in a consolidation phase today and is now trading above its 100day SMA of 1.1198 in the European trading session. The near term bias is Neutral to Bullish with targets of 1.1350

RSI (14), MACD (12, 26), ADX (14), MA100 indicate a BUY; STOCH (9, 6), STOCHRSI (14), CCI (14) are Neutral; while Average True Range (14) indicates Less Volatility.

Support is at 1.1233 while Resistance is at 1.1322 and 1.1326

17th Aug 2016 – 13:02AM (UTC)

GBPUSD

GBPUSD was bullish yesterday as it touched a high of 1.3050 and remained firm towards the end of the trading session. Cable is moving in a bullish tone today as it touched an intraday high of 1.3068 and is now trading above its 100day SMA of 1.2956 in the European trading session. The near term bias is Neutral to Bullish with targets of 1.3100

RSI (14), MACD (12, 26), ADX (14), MA100 indicate a BUY; CCI (14) is Neutral; while Average True Range (14) indicates High Volatility.

Support is at 1.2955 while Resistance is at 1.3056 and 1.3064

17th Aug 2016 – 13:07AM (UTC)

For more in depth Research & Analysis please visit FxGrow.

Note: This analysis is intended to provide general information and does not constitute the provision of INVESTMENT ADVICE. Investors should, before acting on this information, consider the appropriateness of this information having regard to their personal objectives, financial situation or needs. We recommend investors obtain investment advice specific to their situation before making any financial investment decision.

FxGrow Daily Technical Analysis – 17th Aug, 2016
By FxGrow Research & Analysis Team

AUDUSD

AUDUSD was indecisive yesterday as it touched a low of 0.7654 and a high of 0.7738 towards the end of the trading session. AUDUSD is moving in a bearish tone and is now trading below its 100day SMA of 0.7681 in the European trading session. The near term bias is Bearish with targets of 0.7580

RSI (14), STOCHRSI (14), MACD (12, 26), ADX (14), Ultimate Oscillator, ROC indicate a SELL; STOCH (9, 6) is Oversold; while Average True Range (14) indicates High Volatility.

Support is at 0.7615 while Resistance is at 0.7676 and 0.7680

17th Aug 2016 – 13:14AM (UTC)

USDJPY

USDJPY was bearish yesterday as it touched a low of 99.58 after which it recovered towards the end of the trading session. Dollar-Yen is moving in a consolidation phase after having touched an intraday high of 101.16 and is now trading below its 100day SMA of 101.08 in the European trading session. The near term bias is Neutral

Support is at 99.98 while Resistance is at 100.83 and 100.86

17th Aug 2016 – 13:18AM (UTC)

For more in depth Research & Analysis please visit FxGrow.

Note: This analysis is intended to provide general information and does not constitute the provision of INVESTMENT ADVICE. Investors should, before acting on this information, consider the appropriateness of this information having regard to their personal objectives, financial situation or needs. We recommend investors obtain investment advice specific to their situation before making any financial investment decision.

FxGrow Daily Technical Analysis – 17th Aug, 2016
By FxGrow Research & Analysis Team

XAUUSD[Gold]

XAUUSD was indecisive yesterday as it touched a high of 1358 and a low of 1341 towards the end of the trading session. Gold is moving in a zigzag pattern and is now trading below its 100day SMA of 1348.49 in the European trading session. The near term bias is Neutral to Bearish with targets of 1330

STOCH (9, 6), MACD (12, 26), ADX (14), Ultimate Oscillator, ROC indicate a SELL; RSI (14), CCI (14) are Neutral; while Average True Range (14) indicates Less Volatility.

Support is at 1345.19 while Resistance is at 1350.39 and 1352.99

17th Aug 2016 – 13:25AM (UTC)

XAGUSD[Silver]

XAGUSD was indecisive yesterday as it touched a high of 20.10 and a low of 19.73 towards the end of the trading session. Silver is moving in a bearish momentum after having touched an intraday low of 19.53 and is now trading below its 100day SMA of 19.90 in the European trading session. The near term bias is Neutral to Bearish with targets of 19.50

RSI (14), STOCH (9, 6), MACD (12, 26), Ultimate Oscillator, ROC, MA100 indicate a SELL; ADX (14), CCI (14) are Neutral; while Average True Range (14) indicates High Volatility.

Support is at 19.59 while Resistance is at 19.74 and 19.86

17th Aug 2016 – 13:30AM (UTC)

USOil.cfd

US Oil was bullish yesterday as it touched a high of 46.71 and remained firm towards the end of the trading session. US Oil is moving in a bullish tone as it touched an intraday high of 46.55 and is now trading below its 100day SMA of 44.80 in the European trading session. The near term bias is Bullish with targets of 47.10

RSI (14), STOCHRSI (14), MACD (12, 26), CCI (14), Ultimate Oscillator, ROC indicate a BUY; STOCH (9, 6), ADX (14) is Neutral; while Average True Range (14) indicates Less Volatility.

Support is at 45.83 while Resistance is at 46.71 and 46.77

17th Aug 2016 – 13:35AM (UTC)

For more in depth Research & Analysis please visit FxGrow.

Note: This analysis is intended to provide general information and does not constitute the provision of INVESTMENT ADVICE. Investors should, before acting on this information, consider the appropriateness of this information having regard to their personal objectives, financial situation or needs. We recommend investors obtain investment advice specific to their situation before making any financial investment decision.

FxGrow Daily Technical Analysis – 18th Aug, 2016
By FxGrow Research & Analysis Team

EURUSD

EURUSD was bullish yesterday as it touched a high of 1.1315 but came down to touch a low of 1.1277 towards the end of the trading session. Euro is moving in a bullish tone today and is now trading above its 100day SMA of 1.1233 in the European trading session. The near term bias is Bullish with targets of 1.1400

RSI (14), STOCH (9, 6), MACD (12, 26), CCI (14), Ultimate Oscillator, ROC, MA100 indicate a BUY; ADX (14) is Overbought; while Average True Range (14) indicates Less Volatility.

Support is at 1.1240 while Resistance is at 1.1326 and 1.1331

18th Aug 2016 – 11:12AM (UTC)

GBPUSD

GBPUSD was bullish yesterday as it crossed the 1.3050 handle to touch a high of 1.3084 and remained firm towards the end of the trading session. Cable is moving in a bullish tone today as it touched an intraday high of 1.3171 and is now trading above its 100day SMA of 1.2977 in the European trading session. The near term bias is Bullish with targets of 1.3200

RSI (14), STOCH (9, 6), MACD (12, 26), ADX (14), CCI (14), Ultimate Oscillator, ROC indicate a BUY; STOCHRSI (14) is Overbought; while Average True Range (14) indicates High Volatility.

Support is at 1.3126 while Resistance is at 1.3177 and 1.3186

18th Aug 2016 – 11:19AM (UTC)

For more in depth Research & Analysis please visit FxGrow.

Note: This analysis is intended to provide general information and does not constitute the provision of INVESTMENT ADVICE. Investors should, before acting on this information, consider the appropriateness of this information having regard to their personal objectives, financial situation or needs. We recommend investors obtain investment advice specific to their situation before making any financial investment decision.

FxGrow Daily Technical Analysis – 18th Aug, 2016
By FxGrow Research & Analysis Team

AUDUSD

AUDUSD was indecisive yesterday as it touched a high of 0.7703 and a low of 0.7612 towards the end of the trading session. AUDUSD is moving in a bullish tone today as it touched an intraday high of 0.7722 and is now trading above its 100day SMA of 0.7675 in the European trading session. The near term bias is Bullish with targets of 0.7750

RSI (14), MACD (12, 26), ADX (14), ROC, MA100 indicate a BUY; STOCH (9, 6), CCI (14) is Neutral; while Average True Range (14) indicates Less Volatility.

Support is at 0.7676 while Resistance is at 0.7699 and 0.7723

18th Aug 2016 – 11:25AM (UTC)

USDJPY

USDJPY was indecisive yesterday as it touched a high of 101.16 and a low of 100.08 towards the end of the trading session. Dollar-Yen is moving in a mild bullish tone today and is now trading below its 100day SMA of 100.71 in the European trading session. The near term bias is Neutral to Bullish with targets of 100.75

STOCH (9.6), ADX (14), CCI (14), ROC indicate a BUY; RSI (14), Ultimate Oscillator is Neutral; STOCHRSI (14) is Overbought; while Average True Range (14) indicates High Volatility.

Support is at 99.64 while Resistance is at 100.68 and 100.83

18th Aug 2016 – 11:30AM (UTC)

For more in depth Research & Analysis please visit FxGrow.

Note: This analysis is intended to provide general information and does not constitute the provision of INVESTMENT ADVICE. Investors should, before acting on this information, consider the appropriateness of this information having regard to their personal objectives, financial situation or needs. We recommend investors obtain investment advice specific to their situation before making any financial investment decision.

FxGrow Daily Technical Analysis – 18th Aug, 2016
By FxGrow Research & Analysis Team

XAUUSD[Gold]

XAUUSD was mild bullish yesterday as it touched a high of 1350.45 towards the end of the trading session. Gold is moving in a bullish tone as it touched an intraday high of 1355.94 and is now trading just above its 100day SMA of 1349.85 in the European trading session. The near term bias is Neutral to Bullish with targets of 1365

MACD (12, 26), ADX (14), ROC, MA100 indicate a BUY; RSI (14), CCI (14) are Neutral; STOCHRSI (14) is Oversold; while Average True Range (14) indicates Less Volatility.

Support is at 1338.36 while Resistance is at 1356.15 and 1358.45

18th Aug 2016 – 11:42AM (UTC)

XAGUSD[Silver]

XAGUSD was indecisive yesterday as it touched a high of 19.88 and a low of 19.53 towards the end of the trading session. Silver is moving in a bullish tone as it touched an intraday high of 19.93 and is now trading below its 100day SMA of 19.83 in the European trading session. The near term bias is Neutral to Bullish with targets of 20.00

ADX (14), ROC indicate a BUY; RSI (14), CCI (14) are Neutral; while Average True Range (14) indicates Less Volatility.

Support is at 19.49 while Resistance is at 19.86 and 19.88

18th Aug 2016 – 11:55AM (UTC)

USOil.cfd

US Oil was bullish yesterday as it touched a high of 46.93 and remained firm towards the end of the trading session. US Oil is moving in a bullish tone as it touched an intraday high of 47.15 and is now trading above its 100day SMA of 45.64 in the European trading session. The near term bias is Bullish with targets of 47.55

RSI (14), STOCH (9, 6), MACD (12, 26), ADX (14), CCI (14), Ultimate Oscillator, ROC indicate a BUY; STOCHRSI (14) is Overbought; while Average True Range (14) indicates Less Volatility.

Support is at 46.07 while Resistance is at 47.15 and 47.32

18th Aug 2016 – 12:00AM (UTC)

For more in depth Research & Analysis please visit FxGrow.

Note: This analysis is intended to provide general information and does not constitute the provision of INVESTMENT ADVICE. Investors should, before acting on this information, consider the appropriateness of this information having regard to their personal objectives, financial situation or needs. We recommend investors obtain investment advice specific to their situation before making any financial investment decision.

FxGrow Daily Technical Analysis – 19th Aug, 2016
By FxGrow Research & Analysis Team

EURUSD

EURUSD was bullish yesterday as it touched a high of 1.1365 and remained firm towards the end of the trading session. Euro is moving in a bullish tone and is now trading above its 100day SMA of 1.1138 in the Asian trading session. The near term bias is Bullish with targets of 1.1425

RSI (14), STOCH (9, 6), MACD (12, 26), CCI (14), Ultimate Oscillator, ROC, MA100 indicate a BUY; ADX (14) is Overbought; while Average True Range (14) indicates Less Volatility.

Support is at 1.1240 while Resistance is at 1.1358 and 1.1366

19th Aug 2016 – 05:34AM (UTC)

GBPUSD

GBPUSD was bullish yesterday as it crossed the 1.3150 handle to touch a high of 1.3171 and remained firm towards the end of the trading session. Cable is moving in a bullish tone today as it touched an intraday high of 1.3185 and is now trading above its 100day SMA of 1.3099 in the Asian trading session. The near term bias is Bullish with targets of 1.3225

RSI (14), STOCH (9, 6), STOCHRSI (14), MACD (12, 26), ADX (14), CCI (14), Ultimate Oscillator, ROC indicate a BUY; while Average True Range (14) indicates High Volatility.

Support is at 1.3094 while Resistance is at 1.3173 and 1.3230

19th Aug 2016 – 05:40AM (UTC)

For more in depth Research & Analysis please visit FxGrow.

Note: This analysis is intended to provide general information and does not constitute the provision of INVESTMENT ADVICE. Investors should, before acting on this information, consider the appropriateness of this information having regard to their personal objectives, financial situation or needs. We recommend investors obtain investment advice specific to their situation before making any financial investment decision.

FxGrow Daily Technical Analysis – 19th Aug, 2016
By FxGrow Research & Analysis Team

AUDUSD

AUDUSD was indecisive yesterday as it touched a low of 0.7648 and a high of 0.7722 towards the end of the trading session. AUDUSD is moving in a bearish tone today and is now trading above its 100day SMA of 0.7607 in the Asian trading session. The near term bias is Bearish with targets of 0.7600

RSI (14), MACD (12, 26), CCI (14), Ultimate Oscillator, ROC indicate a SELL; STOCHRSI (14) is Oversold; ADX (14) is Neutral; while Average True Range (14) indicates High Volatility.

Support is at 0.7545 while Resistance is at 0.7675 and 0.7680

19th Aug 2016 – 05:50AM (UTC)

USDJPY

USDJPY was indecisive yesterday as it touched a low of 99.65 and a high of 100.45 towards the end of the trading session. Dollar-Yen is moving in a bearish tone and is now trading below its 100day SMA of 102.36 in the Asian trading session. The near term bias is Neutral to Bearish with targets of 99.75

RSI (14), STOCH (9.6), MACD (12, 26), ADX (14), Ultimate Oscillator, ROC indicate a SELL; CCI (14) is Neutral; STOCHRSI (14) is Overbought; while Average True Range (14) indicates High Volatility.

Support is at 99.53 while Resistance is at 100.68 and 102.65

19th Aug 2016 – 05:58AM (UTC)

For more in depth Research & Analysis please visit FxGrow.

Note: This analysis is intended to provide general information and does not constitute the provision of INVESTMENT ADVICE. Investors should, before acting on this information, consider the appropriateness of this information having regard to their personal objectives, financial situation or needs. We recommend investors obtain investment advice specific to their situation before making any financial investment decision.

FxGrow Daily Technical Analysis – 19th Aug, 2016
By FxGrow Research & Analysis Team

XAUUSD[Gold]

XAUUSD was indecisive yesterday as it touched a high of 1356.11 and a low of 1346.39 towards the end of the trading session. Gold is moving in a consolidation phase and is now trading just above its 100day SMA of 1347.78 in the Asian trading session. The near term bias is Neutral to Bullish with targets of 1360

STOCH (9, 6), MACD (12, 26), MA100 indicate a BUY; RSI (14), ADX (14), CCI (14) are Neutral; STOCHRSI (14) is Oversold; while Average True Range (14) indicates Less Volatility.

Support is at 1333.36 while Resistance is at 1356.35 and 1360.70

19th Aug 2016 – 06:05AM (UTC)

XAGUSD[Silver]

XAGUSD was indecisive yesterday as it touched a high of 19.92 and a low of 19.62 towards the end of the trading session. Silver is moving in a mild bearish tone and is now trading below its 100day SMA of 20.01 in the Asian trading session. The near term bias is Bearish with targets of 19.40

RSI (14), MACD (12, 26), ADX (14), CCI (14), Ultimate Oscillator, ROC indicate a SELL; STOCHRSI (14) is Oversold; while Average True Range (14) indicates Less Volatility.

Support is at 19.37 while Resistance is at 20.48 and 20.67

19th Aug 2016 – 06:10AM (UTC)

USOil.cfd

US Oil was bullish yesterday as it crossed the 48.00 handle and remained firm towards the end of the trading session. US Oil is moving in a bullish momentum and is now trading above its 100day SMA of 46.39 in the Asian trading session. The near term bias is Bullish with targets of 49.25

STOCH (9, 6), STOCHRSI (14), MACD (12, 26), Ultimate Oscillator, ROC indicate a BUY; RSI (14), ADX (14), CCI (14) are Overbought; while Average True Range (14) indicates Less Volatility.

Support is at 48.40 while Resistance is at 48.72 and 48.80

19th Aug 2016 – 06:15AM (UTC)

For more in depth Research & Analysis please visit FxGrow.

Note: This analysis is intended to provide general information and does not constitute the provision of INVESTMENT ADVICE. Investors should, before acting on this information, consider the appropriateness of this information having regard to their personal objectives, financial situation or needs. We recommend investors obtain investment advice specific to their situation before making any financial investment decision.

FxGrow Daily Technical Analysis – 22nd Aug, 2016
By FxGrow Research & Analysis Team

EURUSD

EURUSD was bullish last week as it touched a high of 1.1366 but could not sustain to its bullish momentum and came down towards the closing session. Euro is moving in a bearish tone and is now trading above its 100day SMA of 1.1157 in the Asian trading session. The near term bias is Neutral to Bearish with targets of 1.1225

STOCH (9, 6), ADX (14), CCI (14), Ultimate Oscillator, indicate a SELL; RSI (14) is Neutral; STOCHRSI (14) is Oversold; while Average True Range (14) indicates Less Volatility.

Support is at 1.1233 while Resistance is at 1.1358 and 1.1366

22nd Aug 2016 – 05:37AM (UTC)

GBPUSD

GBPUSD was bullish last week as it touched a high of 1.3171 but could not sustain to its bullish momentum and came down towards the closing session. Cable is moving in a mild bearish tone today and is now trading below its 100day SMA of 1.3096 in the Asian trading session. The near term bias is Neutral to Bearish with targets of 1.2950

STOCH (9, 6), ADX (14), CCI (14), Ultimate Oscillator, MA100 indicate a SELL; RSI (14) is Neutral; STOCHRSI (14) is Oversold; while Average True Range (14) indicates Less Volatility.

Support is at 1.2865 while Resistance is at 1.3056 and 1.3071

22nd Aug 2016 – 05:45AM (UTC)

For more in depth Research & Analysis please visit FxGrow.

Note: This analysis is intended to provide general information and does not constitute the provision of INVESTMENT ADVICE. Investors should, before acting on this information, consider the appropriateness of this information having regard to their personal objectives, financial situation or needs. We recommend investors obtain investment advice specific to their situation before making any financial investment decision.

FxGrow Daily Technical Analysis – 22nd Aug, 2016
By FxGrow Research & Analysis Team

AUDUSD

AUDUSD was indecisive last week as it touched a high of 0.7738 and a low of 0.7602 towards the closing session. Aussie is moving in a mild bearish tone today and is now trading below its 100day SMA of 0.7615 in the Asian trading session. The near term bias is Bearish with targets of 0.7550

RSI (14), MACD (12, 26), ADX (14), CCI (14), Ultimate Oscillator, ROC, MA100 indicate a SELL; STOCH (9, 6), STOCHRSI (14) is Oversold; while Average True Range (14) indicates Less Volatility.

Support is at 0.7504 while Resistance is at 0.7676 and 0.7722

22nd Aug 2016 – 05:51AM (UTC)

USDJPY

USDJPY was bearish last week as it touched a low of 99.59 and remained weak towards the closing session. Dollar-Yen is moving in a bullish tone and is now trading below its 100day SMA of 102.02 in the Asian trading session. The near term bias is Bullish with targets of 101.35

RSI (14), STOCH (9.6), ADX (14), Ultimate Oscillator, ROC indicate a BUY; STOCHRSI (14), CCI (14) is Overbought; while Average True Range (14) indicates Less Volatility.

Support is at 99.98 while Resistance is at 102.65 and 103.39

22nd Aug 2016 – 05:57AM (UTC)

For more in depth Research & Analysis please visit FxGrow.

Note: This analysis is intended to provide general information and does not constitute the provision of INVESTMENT ADVICE. Investors should, before acting on this information, consider the appropriateness of this information having regard to their personal objectives, financial situation or needs. We recommend investors obtain investment advice specific to their situation before making any financial investment decision.

FxGrow Daily Technical Analysis – 22nd Aug, 2016
By FxGrow Research & Analysis Team

XAUUSD[Gold]

XAUUSD was indecisive last week as it touched a high of 1356.11 and a low of 1337.87 towards the closing session. Gold is moving in a mild bearish tone and is now trading below its 100day SMA of 1348.97 in the Asian trading session. The near term bias is Bearish with targets of 1325

RSI (14), STOCH (9, 6), MACD (12, 26), ADX (14), CCI (14), Ultimate Oscillator, ROC indicate a SELL; STOCHRSI (14) is Oversold; while Average True Range (14) indicates Less Volatility.

Support is at 1320.30 while Resistance is at 1341.75 and 1345.20

22nd Aug 2016 – 06:06AM (UTC)

XAGUSD[Silver]

XAGUSD was bearish last week as it touched a low of 19.26 and remained weak towards the closing session. Silver is moving in a mild bearish tone and is now trading below its 100day SMA of 19.98 in the Asian trading session. The near term bias is Bearish with targets of 18.60

STOCH (9, 6), MACD (12, 26), ADX (14), CCI (14), Ultimate Oscillator, ROC indicate a SELL; RSI (14), STOCHRSI (14) is Oversold; while Average True Range (14) indicates High Volatility.

Support is at 18.71 while Resistance is at 19.37 and 19.49

22nd Aug 2016 – 06:17AM (UTC)

USOil.cfd

US Oil was bullish last week as it touched a high of 48.71 and remained firm towards the closing session. US Oil is moving in a bullish tone as it touched an intraday high of 48.92 and is now trading above its 100day SMA of 43.31 in the Asian trading session. The near term bias is Bullish with targets of 49.00

RSI (14), STOCH (9, 6), MACD (12, 26), ADX (14), CCI (14), Ultimate Oscillator, ROC indicate a BUY; STOCHRSI (14) is Oversold; while Average True Range (14) indicates Less Volatility.

Support is at 46.71 while Resistance is at 48.73 and 48.97

22nd Aug 2016 – 06:25AM (UTC)

For more in depth Research & Analysis please visit FxGrow.

Note: This analysis is intended to provide general information and does not constitute the provision of INVESTMENT ADVICE. Investors should, before acting on this information, consider the appropriateness of this information having regard to their personal objectives, financial situation or needs. We recommend investors obtain investment advice specific to their situation before making any financial investment decision.

FxGrow Daily Technical Analysis – 23rd Aug, 2016
By FxGrow Research & Analysis Team

EURUSD

EURUSD was bullish yesterday as it touched a high of 1.1330 and remained strong towards the end of the trading session. Euro is moving in a bullish tone and is now trading above its 100day SMA of 1.1174 in the Asian trading session. The near term bias is Bullish with targets of 1.1380

RSI (14), STOCH (9, 6), MACD (12, 26), ADX (14), CCI (14), Ultimate Oscillator, ROC indicate a BUY; while Average True Range (14) indicates Less Volatility.

Support is at 1.1242 while Resistance is at 1.1358 and 1.1366

23rd Aug 2016 – 06:09AM (UTC)

GBPUSD

GBPUSD was bullish yesterday as it touched a high of 1.3157 and remained firm towards the end of the trading session. Cable is moving in a mild bullish tone today and is now trading above its 100day SMA of 1.3093 in the Asian trading session. The near term bias is Neutral to Bullish with targets of 1.3225

RSI (14), MACD (12, 26), ADX (14), Ultimate Oscillator, ROC, MA100 indicate a BUY; STOCH (9, 6) is Neutral; STOCHRSI (14), CCI (14) is Overbought; while Average True Range (14) indicates Less Volatility.

Support is at 1.3064 while Resistance is at 1.3184 and 1.3291

23rd Aug 2016 – 06:17AM (UTC)

For more in depth Research & Analysis please visit FxGrow.

Note: This analysis is intended to provide general information and does not constitute the provision of INVESTMENT ADVICE. Investors should, before acting on this information, consider the appropriateness of this information having regard to their personal objectives, financial situation or needs. We recommend investors obtain investment advice specific to their situation before making any financial investment decision.

FxGrow Daily Technical Analysis – 23rd Aug, 2016
By FxGrow Research & Analysis Team

AUDUSD

AUDUSD was bullish yesterday as it touched a high of 0.7638 and remained firm towards the end of the trading session. Aussie is moving in a mild bullish tone today and is now trading above its 100day SMA of 0.7623 in the Asian trading session. The near term bias is Neutral to Bullish with targets of 0.7675

STOCH (9, 6), STOCHRSI (14), Ultimate Oscillator, MA100 indicate a BUY; RSI (14), ADX (14), CCI (14) is Neutral; while Average True Range (14) indicates Less Volatility.

Support is at 0.7545 while Resistance is at 0.7676 and 0.7722

23rd Aug 2016 – 06:22AM (UTC)

USDJPY

USDJPY was indecisive yesterday as it touched a high of 100.91 and a low of 100.21 towards the end of the trading session. Dollar-Yen is moving in a mild bearish tone and is now trading below its 100day SMA of 101.75 in the Asian trading session. The near term bias is Bearish with targets of 99.60

RSI (14), STOCH (9, 6), STOCHRSI (14), MACD (12, 26), ADX (14), CCI (14), Ultimate Oscillator indicate a SELL; while Average True Range (14) indicates Less Volatility.

Support is at 99.54 while Resistance is at 100.68 and 102.65

23rd Aug 2016 – 06:29AM (UTC)

For more in depth Research & Analysis please visit FxGrow.

Note: This analysis is intended to provide general information and does not constitute the provision of INVESTMENT ADVICE. Investors should, before acting on this information, consider the appropriateness of this information having regard to their personal objectives, financial situation or needs. We recommend investors obtain investment advice specific to their situation before making any financial investment decision.

damn right the usda dollar is bearish they are going into depression

FxGrow Daily Technical Analysis – 23rd Aug, 2016
By FxGrow Research & Analysis Team

XAUUSD[Gold]

XAUUSD was indecisive yesterday as it touched a low of 1332.27 and a high of 1339.03 towards the end of the trading session. Gold is moving in a zigzag pattern and is now trading below its 100day SMA of 1348.55 in the Asian trading session. The near term bias is Neutral

Support is at 1340.70 while Resistance is at 1343.20 and 1344.45

23rd Aug 2016 – 06:33AM (UTC)

XAGUSD[Silver]

XAGUSD was bearish yesterday and remained below the 19.00 handle towards the end of the trading session. Silver is moving in a mild bullish tone and is now trading below its 100day SMA of 19.41 in the Asian trading session. The near term bias is Neutral to Bearish with targets of 18.75

RSI (14), STOCH (9, 6), STOCHRSI (14), MACD (12, 26), CCI (14), ROC indicate a SELL; ADX (14) is Neutral; while Average True Range (14) indicates Less Volatility.

Support is at 18.71 while Resistance is at 19.37 and 19.49

23rd Aug 2016 – 06:42AM (UTC)

USOil.cfd

US Oil was bearish yesterday as it touched a low of 47.41 and remained weak towards the end of the trading session. US Oil is moving in a mild bearish tone and is now trading above its 100day SMA of 43.50 in the Asian trading session. The near term bias is Neutral to Bearish with targets of 46.50

STOCH (9, 6), ADX (14), CCI (14), Ultimate Oscillator, ROC indicate a SELL; RSI (14) is Neutral; STOCHRSI (14) is Oversold; while Average True Range (14) indicates Less Volatility.

Support is at 45.91 while Resistance is at 48.73 and 48.97

23rd Aug 2016 – 06:45AM (UTC)

For more in depth Research & Analysis please visit FxGrow.

Note: This analysis is intended to provide general information and does not constitute the provision of INVESTMENT ADVICE. Investors should, before acting on this information, consider the appropriateness of this information having regard to their personal objectives, financial situation or needs. We recommend investors obtain investment advice specific to their situation before making any financial investment decision.