FxGrow Daily Technical Analysis – 16th Sept, 2015
By FxGrow Research & Analysis Team
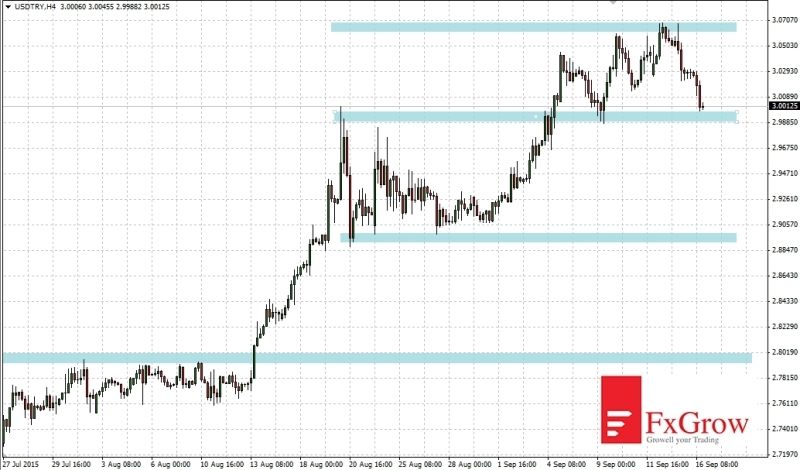
USDTRY - level 3.0000 may cause a correction?
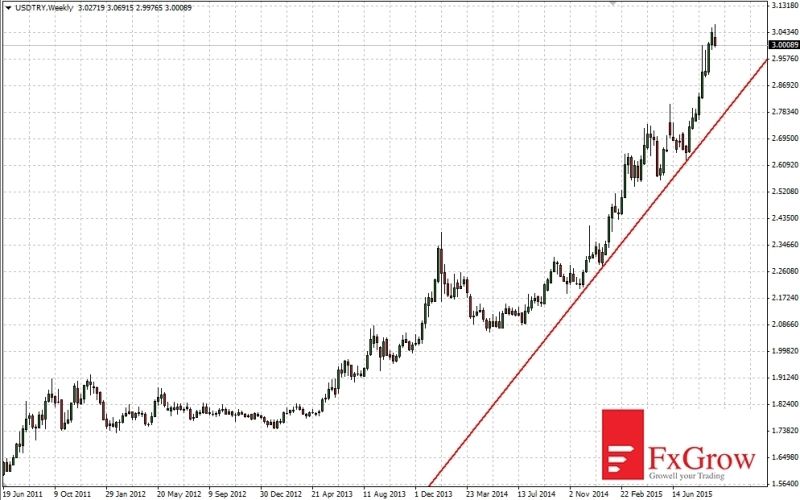
An interesting situation on USDTRY (US dollar to Turkish lira). Price is in impressive upward trend since 2010. At the beginning of September level of 3.00000 was broke above and many investors became interested. Because since two years, there wasn’t a bigger correction. For now, at such a strong uptrend short positions would be risky, but USDTRY is worth of attention.
The nearest resistance is at 3.07000. Close support is 3.00000, and after it has been broken below the next support level is on 2.90000. The second support also reinforces the 38,2% Fibonacci retracement of last upward move. However only break below the next support which means fall below the 2.80000 will be a warning of USDTRY deeper correction. The last pointed level is also the 61,8% Fibonacci retracement of last upward move.
Time-frame H4
Time-frame W1
For more in depth Research & Analysis please visit FxGrow.
Note: This analysis is intended to provide general information and does not constitute the provision of INVESTMENT ADVICE. Investors should, before acting on this information, consider the appropriateness of this information having regard to their personal objectives, financial situation or needs. We recommend investors obtain investment advice specific to their situation before making any financial investment decision.
FxGrow Daily Technical Analysis – 18th Sept, 2015
By FxGrow Research & Analysis Team
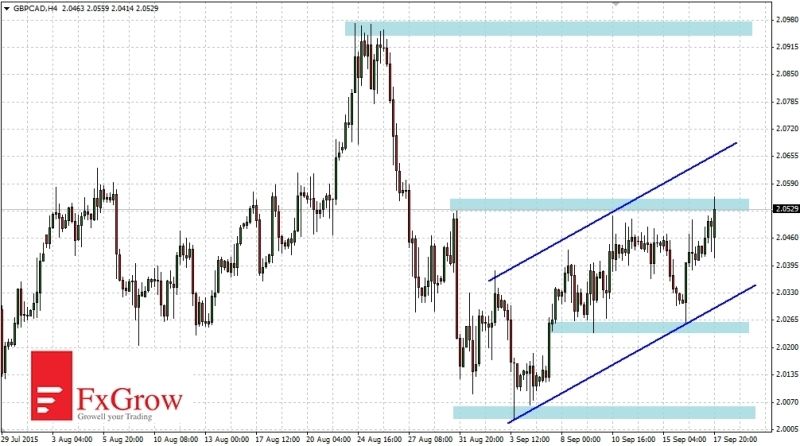
GBPCAD - the bulls are not giving up
Since beginning of August GBPCAD move up 500 pips from the bottom and it is moving in the upward channel. On Thursday upward movement was stopped on the resistance 2.0530. However bulls could break it soon. Upward movement may take place in the channel and bring the price to the August high on 2.0900. Alternatively, if the move up are not continued the supports for the bulls will be at the levels 2.0260 and 2.0030.
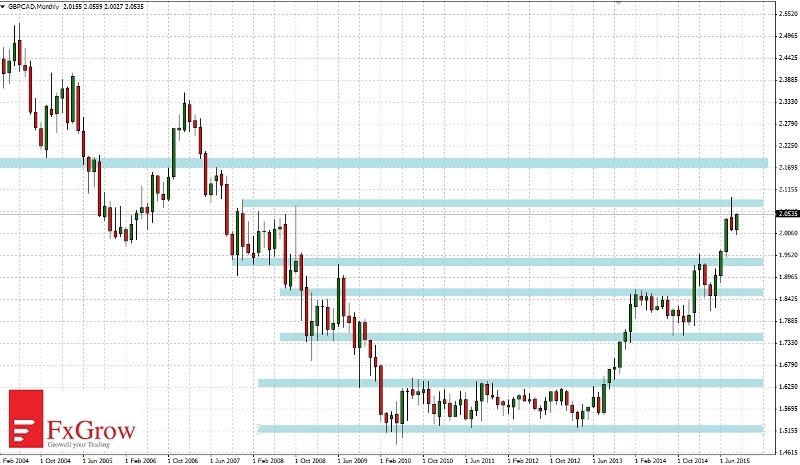
Wider view, interval monthly
Since 2013 GBPCAD moves in upward trend. The next resistance were broke by bulls with success. Last month, the price reached to the next significant resistance at 2.0900 and on the monthly chart appeared downward candle with a long upper shadow. Bulls are not surrending, and after almost three weeks of September recovered half of August candle. Too fast attempt to break through this resistance may end with deeper correction. So the best thing that bulls may do is to wait on the consolidation below the resistance.
For more in depth Research & Analysis please visit FxGrow.
Note: This analysis is intended to provide general information and does not constitute the provision of INVESTMENT ADVICE. Investors should, before acting on this information, consider the appropriateness of this information having regard to their personal objectives, financial situation or needs. We recommend investors obtain investment advice specific to their situation before making any financial investment decision.
FxGrow Daily Technical Analysis – 18th Sept, 2015
By FxGrow Research & Analysis Team
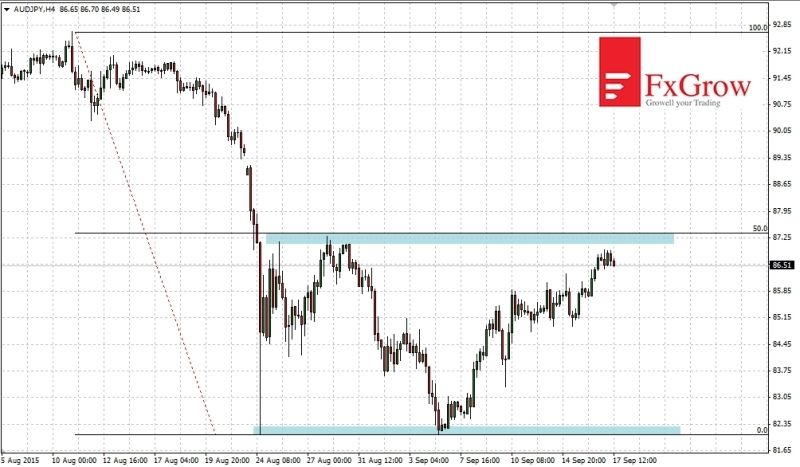
AUDJPY in consolidation, nearest resistance could be a chance for a short
After August decreases – which culminated on August 24th – price finally rebounded. Rebound reached 50% Fibonacci retracement of last downward move, then AUDJPY returned to falls. That bottom at 82.10 with an accuracy of 2 pips confirmed its strength as a support. Price approached the resistance of the last 3 weeks. If bears takes the initiative near 87.25 the further test of August’s minimum will be possible. However if an attack on the resistance succeeds the next resistances will be on 89.40, 92.40.
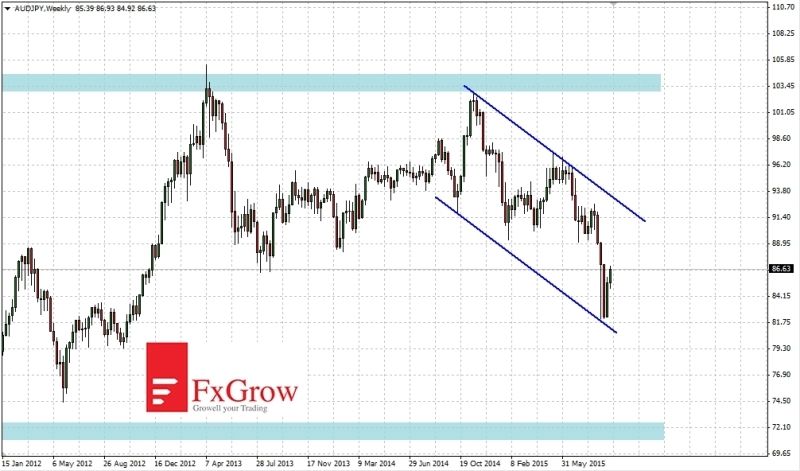
Wider view, time-frame W1
In the long term since mid-2009 AUDJPY moves between levels 72 - 104. Last year after getting closer to the upper limit of this range falls occurred. Since then the price moves in a downward channel, the lower limit has been tested in early September. If the bears will take the control now a bottom of 2015 can be deepened. Alternatively, if the bulls shows strength upward move can reach 92.00 in the long term.
For more in depth Research & Analysis please visit FxGrow.
Note: This analysis is intended to provide general information and does not constitute the provision of INVESTMENT ADVICE. Investors should, before acting on this information, consider the appropriateness of this information having regard to their personal objectives, financial situation or needs. We recommend investors obtain investment advice specific to their situation before making any financial investment decision.
FxGrow Daily Technical Analysis – 18th Sept, 2015
By FxGrow Research & Analysis Team
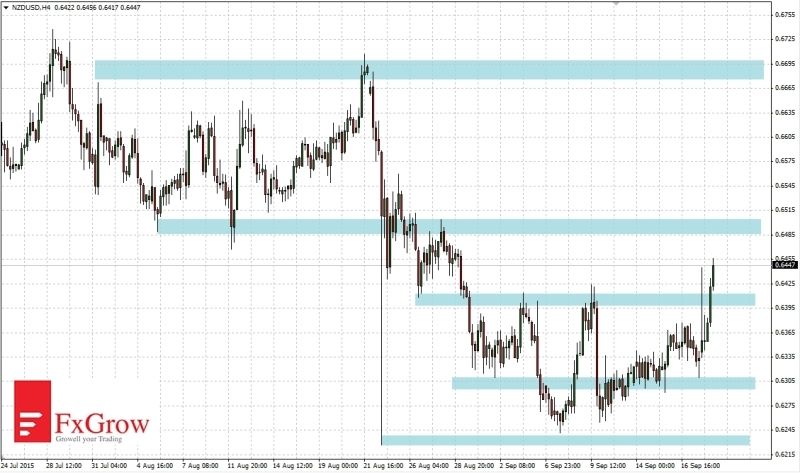
NZDUSD - Bulls on the offensive, the target of upward movement is 0.6700
Thursday’s Fed meeting turned out to be very negative for the dollar bulls. At NZDUSD shortly after the FED’s decision followed attempt of break above resistance at the level 0.6400. The attempt proved to be false and the price returned creating a false breakout on the chart. The dollar weakened today to the main currencies EURUSD has exceeded 1.1400, GBPUSD went over 1.5600. Also on NZDUSD bulls decided to try attacking again on yesterday’s resistance. At this moment, the resistance has been broken above and we should see upward move to 0.6500 level, and this area should appear of correction. When it appears it could bring price to re-test of resistance at 0.6400, a level which has now become the new support. If level 0.65 will be also break above, it will open the road to a level 0.6700, which should stop upward movement for a longer time.
Wider perspective
Since the middle of 2014 NZDUSD is in a downward trend therefore the current rally still should be regarded as a rebound.
For more in depth Research & Analysis please visit FxGrow.
Note: This analysis is intended to provide general information and does not constitute the provision of INVESTMENT ADVICE. Investors should, before acting on this information, consider the appropriateness of this information having regard to their personal objectives, financial situation or needs. We recommend investors obtain investment advice specific to their situation before making any financial investment decision.
FxGrow Daily Technical Analysis – 21st Sept, 2015
By FxGrow Research & Analysis Team
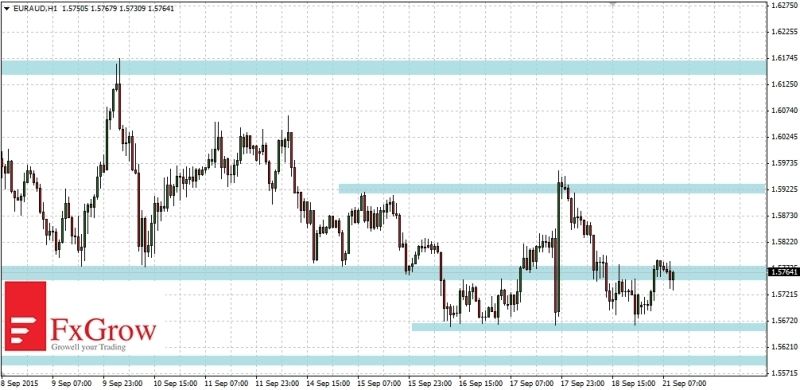
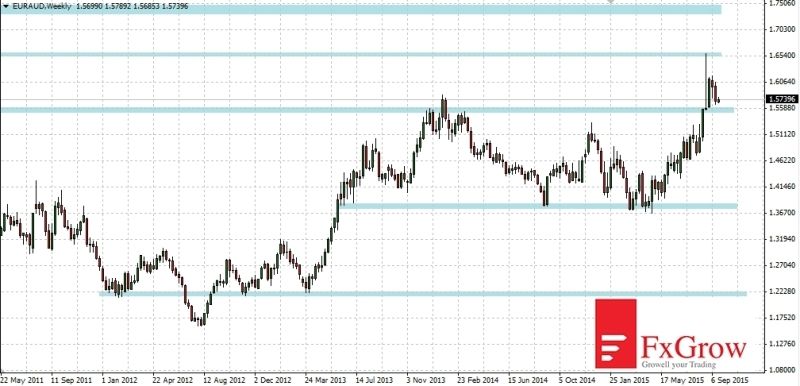
EURAUD - breakout from the consolidation will indicate the direction of movement
Since last week EURAUD can’t go away from the level of 1.5770. The downward movement stops at support 1.5660, and move up stops at resistance 1.5940. Dynamic upward candle, which took place on Thursday after the Fed decision also does not help with consolidation breakout. If break below that consolidation will be successfully next support on 1.5600 has a chance to cause a rebound. On the other hand, the break above resistance 1.5940 will take price first to 1.6160 and next to 1.6600.
Wider view, interval W1
At weekly interval we can indicate another significant levels. After breaking down the 1.5600 level, the downward movement may reduce price to 1.3800. But break above the level 1.6600 will bring the price to 1.7400.
For more in depth Research & Analysis please visit FxGrow.
Note: This analysis is intended to provide general information and does not constitute the provision of INVESTMENT ADVICE. Investors should, before acting on this information, consider the appropriateness of this information having regard to their personal objectives, financial situation or needs. We recommend investors obtain investment advice specific to their situation before making any financial investment decision.
FxGrow Daily Technical Analysis – 21st Sept, 2015
By FxGrow Research & Analysis Team
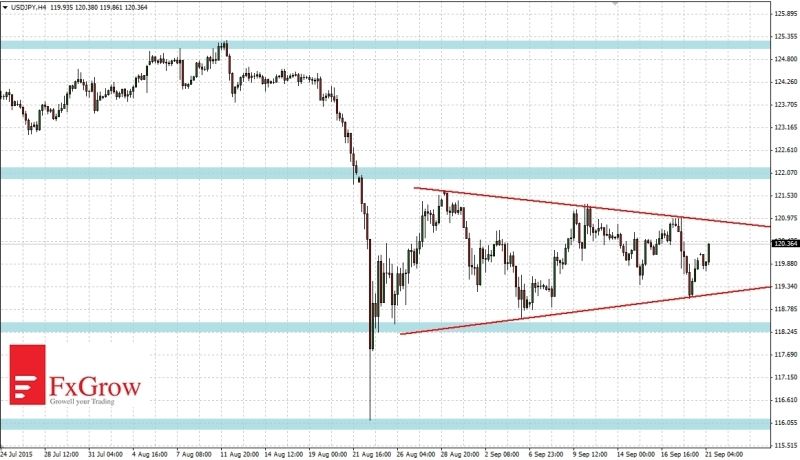
USDJPY waiting for the triangle breakout
Since one month USDJPY moves in the triangle formation. Its range of movement is clearly slowing down. Therefore, the breakout of the triangle in one direction will bring dynamic movement. Currently, the lower arm of the triangle is 119.20, and the upper arm 120.90. If the lower arm of the triangle breaks below, downward movement will lead price to 118.30. If that support also will not stop the falls the next target of downward move is the August minimum at 116.10.
However, if bulls break above the upper arm of the triangle the next levels of resistance will be located at 122.00 and 125.20. Successfull break above that levels will confirm that the correction on USDJPY has now been completed and the price goes back to the uptrend.
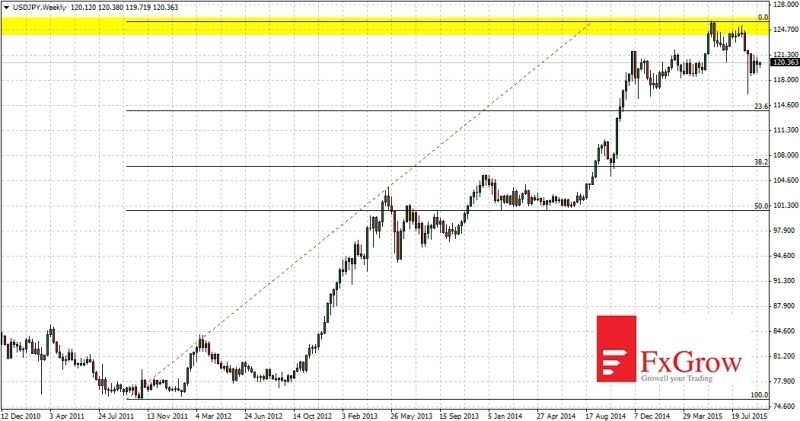
Wider view, interval W1
Since 2011 USDJPY moves in upward trend. At this time bears failed to correct upward movement even on the smallest Fibonacci level of 23.6%. If falls finally comes, level 114.00 which is 23.6% fibo will be the first target.
For more in depth Research & Analysis please visit FxGrow.
Note: This analysis is intended to provide general information and does not constitute the provision of INVESTMENT ADVICE. Investors should, before acting on this information, consider the appropriateness of this information having regard to their personal objectives, financial situation or needs. We recommend investors obtain investment advice specific to their situation before making any financial investment decision.
FxGrow Daily Technical Analysis – 22nd Sept, 2015
By FxGrow Research & Analysis Team
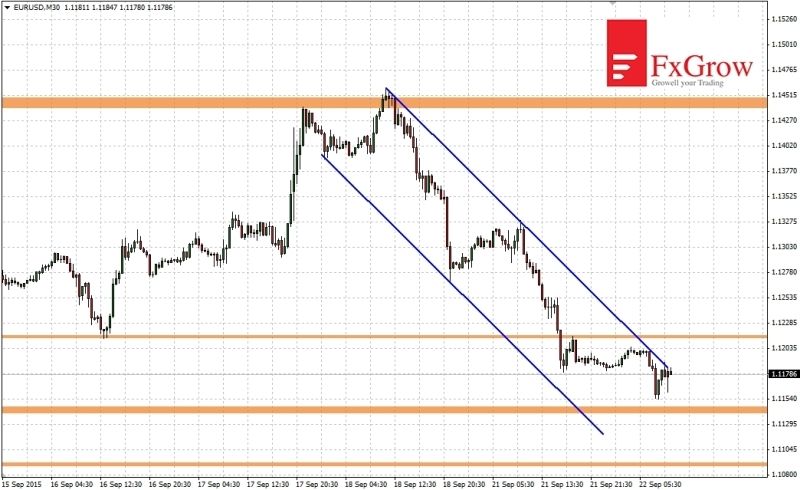
EURUSD rebound from the resistance, target of falls 1.1090
Last Thursday EURUSD has reached to 1.1460 and that level cause rebound. The first support, which could stop the descent was the level of 1.1214 but bears broke below it. Another support which price is aiming is around 1.1145 - 1.1135. If the price reaches to that area and it will be breaking the next target of falls will be 1.1090. Since Thursday EURUSD also moves in a steep downward channel which reflects well on the strength of bears.
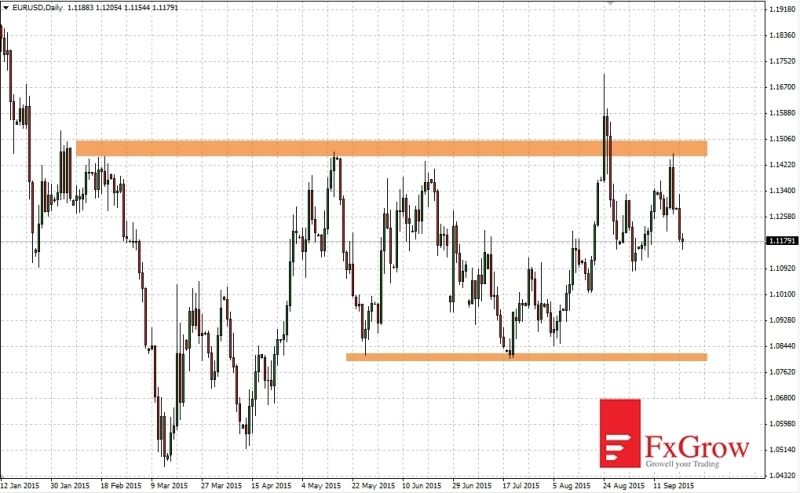
Wider view, interval D1
In 2015 EURUSD moves in the consolidation between the levels 1.1460 - 1.0460. Indicated top was a false break only for a while in August. And indicated bottom has been tested only once in March and in the following months the price stopped already at higher levels. The last important support is 1.0815.
For more in depth Research & Analysis please visit FxGrow.
Note: This analysis is intended to provide general information and does not constitute the provision of INVESTMENT ADVICE. Investors should, before acting on this information, consider the appropriateness of this information having regard to their personal objectives, financial situation or needs. We recommend investors obtain investment advice specific to their situation before making any financial investment decision.
FxGrow Daily Technical Analysis – 22nd Sept, 2015
By FxGrow Research & Analysis Team
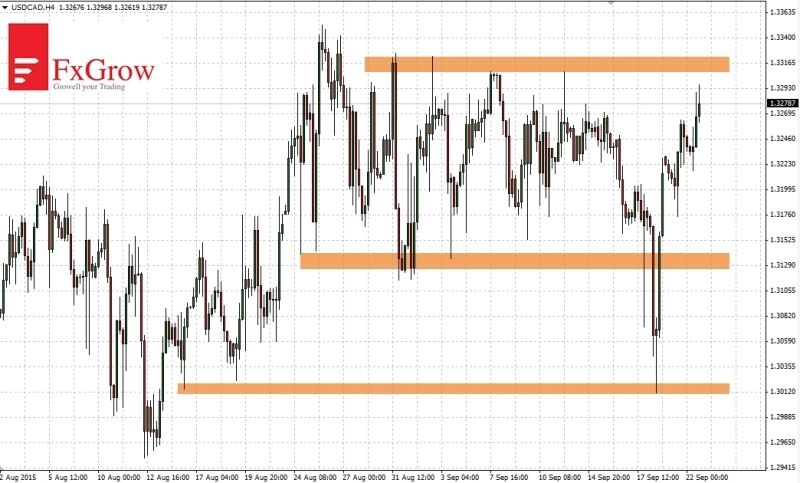
USDCAD – false break of consolidation lower limit
An interesting situation in the USDCAD. For a month price moved in the consolidation between resistance 1.3320 and support 1.3130. Last Friday there was an attempt to break below the support that lead the price to the level 1.3010. On that support bulls returned to the game. On the daily chart a long lower shadow appeared and USDCAD returned to the consolidation range. Currently, the price is moving to the upper limit of consolidation on the level 1.3320.
It is worth to note, that the USDCAD moves in a long-term uptrend, and often false breakout from the consolidation in one direction ends with a proper breakout in the opposite direction. If such situation will take place it will follow the main trend. A minimum target of upward movement is a level 1.3800.
For more in depth Research & Analysis please visit FxGrow.
Note: This analysis is intended to provide general information and does not constitute the provision of INVESTMENT ADVICE. Investors should, before acting on this information, consider the appropriateness of this information having regard to their personal objectives, financial situation or needs. We recommend investors obtain investment advice specific to their situation before making any financial investment decision.
FxGrow Daily Technical Analysis – 23rd Sept, 2015
By FxGrow Research & Analysis Team
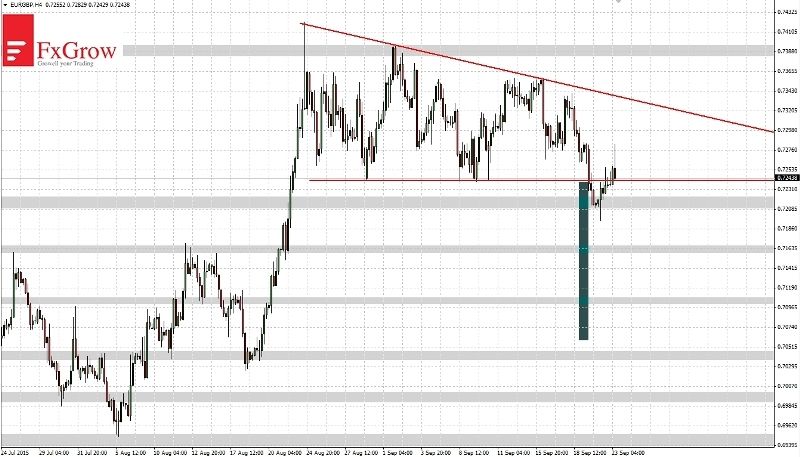
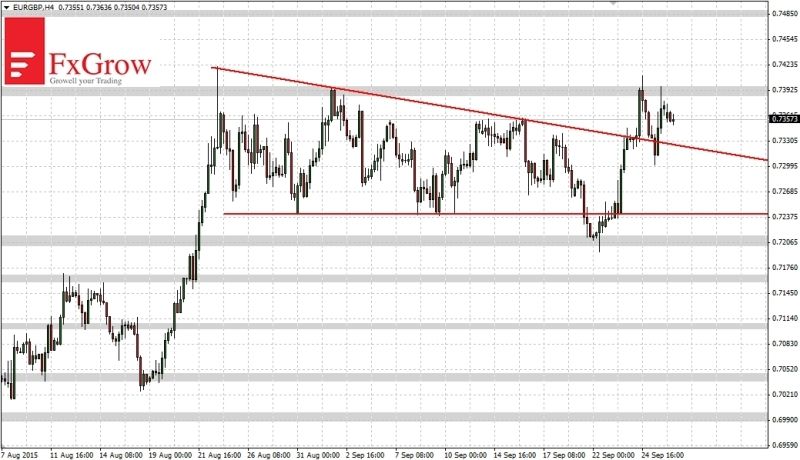
EURGBP breakout of the triangle with a range of 0.7060 decline
For a month EURGBP moves in a shape of downward triangle. This formation promises falls and it is in line with long-term downward trend. On Monday there was a break below of the triangle after a longer test of the level 0.7240. Support came to help bulls, which is located at the 0.7210 level. There was a rebound and return to the interior of the triangle.
If the rebound will be successful it may test level 0.7340, which is the top of the triangle. However, if in the near future the bulls will press harder break below the triangle will become a fact. Range of the falls will be equal to the height of formation. The target level after breaking the triangle will be 0.7060. Before that, supply will have to deal with more supports: 0.7210, 0.7160, 0.7100, 07040. Alternatively, if the triangle has been break above a nearest resistance is 0.7390.
For more in depth Research & Analysis please visit FxGrow.
Note: This analysis is intended to provide general information and does not constitute the provision of INVESTMENT ADVICE. Investors should, before acting on this information, consider the appropriateness of this information having regard to their personal objectives, financial situation or needs. We recommend investors obtain investment advice specific to their situation before making any financial investment decision.
FxGrow Daily Technical Analysis – 23rd Sept, 2015
By FxGrow Research & Analysis Team
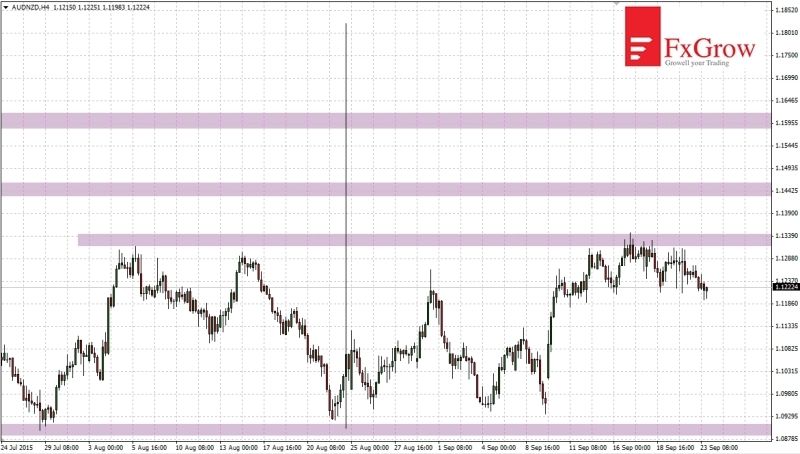
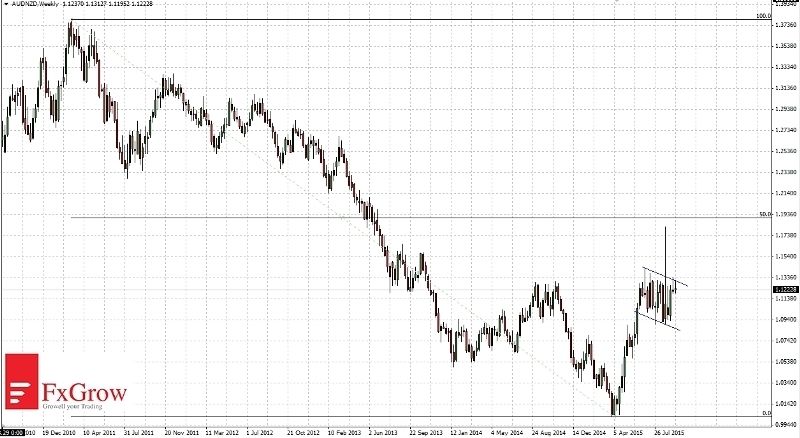
AUDNZD - a trend reversal or just a corrective rebound?
Since 4 months AUDNZD moves in a consolidation between 1.0900 and 1.1430. On August 24 there was a dynamic upward movement. Within a 30 minutes candle price moves up and fall about 900 pips. Since then the price has reduced the range of its movement. Right now it moves in the consolidation between 1.0900 and 1.1340. AUDNZD now rebounded from the resistance at the indicated level and is heading 1.0900.
Wider view, interval W1
Since 5 years AUDNZD moves in a downward trend but the minimum, which took place at the beginning of April this year, begins to indicate a possibility of trend reversal. Direction of breakout from flag will be very important. Flag is a pattern of trend continuation and it should be break above. Break above will give a chance even to trend reversal. However, if the flag breaks below, then this whole movement will take the form of a rebound and AUD/NZD will come back to the main trend (the downward one).
For more in depth Research & Analysis please visit FxGrow.
Note: This analysis is intended to provide general information and does not constitute the provision of INVESTMENT ADVICE. Investors should, before acting on this information, consider the appropriateness of this information having regard to their personal objectives, financial situation or needs. We recommend investors obtain investment advice specific to their situation before making any financial investment decision.
FxGrow Daily Technical Analysis – 28th Sept, 2015
By FxGrow Research & Analysis Team
EURGBP - the appropriate breakout of the triangle up
On September 21 was a break below the triangle. However already the first support on 0.7200 mobilized bulls to buy and on next day there was a return to inside the triangle. Using the situation that on chart is formation fakey (false breakout) the bulls were attempted broke above the triangle. It was successful. Upward movement has been stopped at 0.7400 and currently the price is moving between the triangle and resistance. If break above the level 0.7400 will be successful the next target of upward movement is 0.7480. However, if bulls show the weakness the price should return to inside the triangle again.
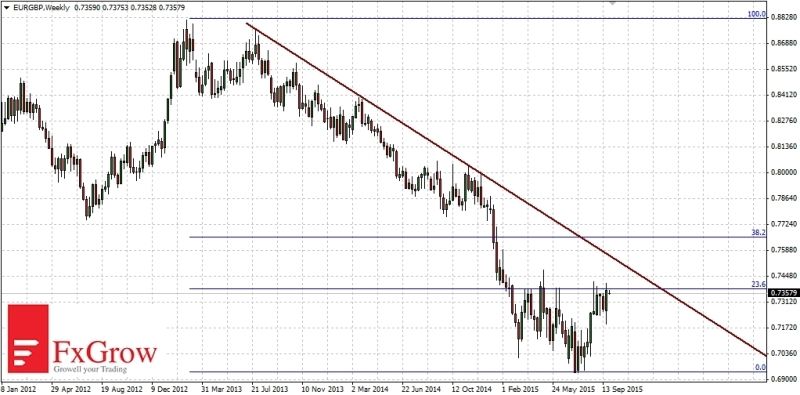
Wider view, interval W1
Since 2009 EURGBP moves in a downtrend. In this time price has fallen from 0.9800 to 0.6940. Currently rebound is in progress and move up abolished only 23.6% of the last downward movement. Level 0.7650 could be tested which is 38.2% fibo. Earlier, the bulls will have to deal with some resistance: 0.7480, 0.7550, 0.7590. The strongest of the indicated resistance will be 0.7550, which marks the downward trendline.
For more in depth Research & Analysis please visit FxGrow.
Note: This analysis is intended to provide general information and does not constitute the provision of INVESTMENT ADVICE. Investors should, before acting on this information, consider the appropriateness of this information having regard to their personal objectives, financial situation or needs. We recommend investors obtain investment advice specific to their situation before making any financial investment decision.
FxGrow Daily Technical Analysis – 28th Sept, 2015
By FxGrow Research & Analysis Team
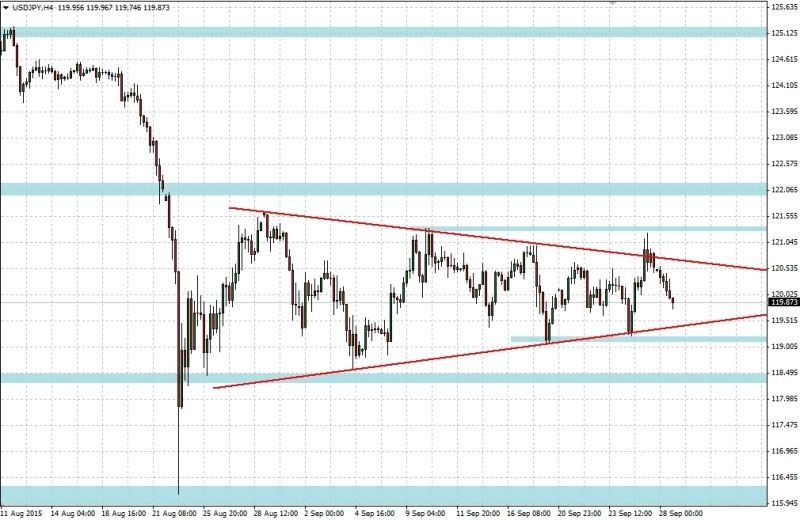
USDJPY – fake triangle breakout
Last Friday the price broke above upper arm of the triangle and investors expected further upward movement that are consistent with the long-term trend in USDJPY. That’s not happened, and even the first week resistance had stopped upward move and activate downward rebound. On Friday, the bulls tried to rebound from the upper limit of the triangle (at the chart it would confirm the successfully breakout). However today bears have taken control and USDJPY moved back to the center of the triangle reaching the level of 120.00.
A similar situation occurred today on EURGBP, where such a false breakout resulted in a proper breakout in the opposite direction. It is not excluded that same exact scenario will be seen on USDJPY. Currently, we should observe in which direction the proper breakout will go. If above, the next resistances are at 121.20 and 122.00. If below, the next supports are at levels: 119.10, 118.50, 116.20.
For more in depth Research & Analysis please visit FxGrow.
Note: This analysis is intended to provide general information and does not constitute the provision of INVESTMENT ADVICE. Investors should, before acting on this information, consider the appropriateness of this information having regard to their personal objectives, financial situation or needs. We recommend investors obtain investment advice specific to their situation before making any financial investment decision.
FxGrow Daily Technical Analysis – 03rd Nov, 2015
By FxGrow Research & Analysis Team
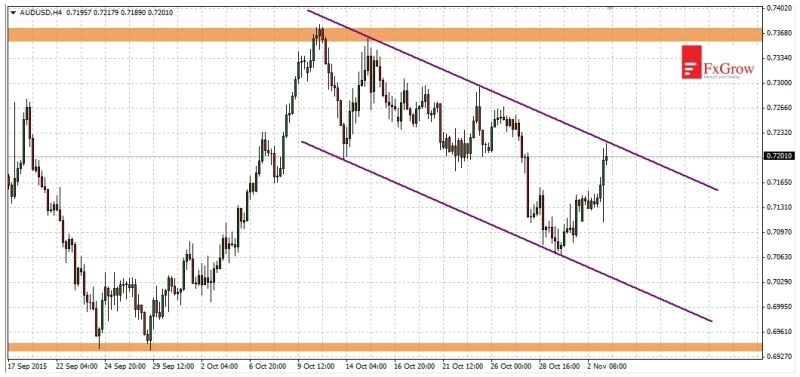
AUDUSD tests the upper limit of the downward channel
Today there was a test of the upper limit of the downward channel. Since October 12 the channel is forming, when an attack on the resistance level of 0.7370 has failed. At the moment there should be some attempts to keep the price near level 0.7200. And next an approach to break above the upper limit of the channel. If that attack succeeds the near resistances will be located at levels 0.7290, 0.7370. If the bulls show a weakness, price will move toward the lower limit of the downward channel. The next supports can be found at levels: 0.7110, 0.7070, 0.7030, 0.6940.
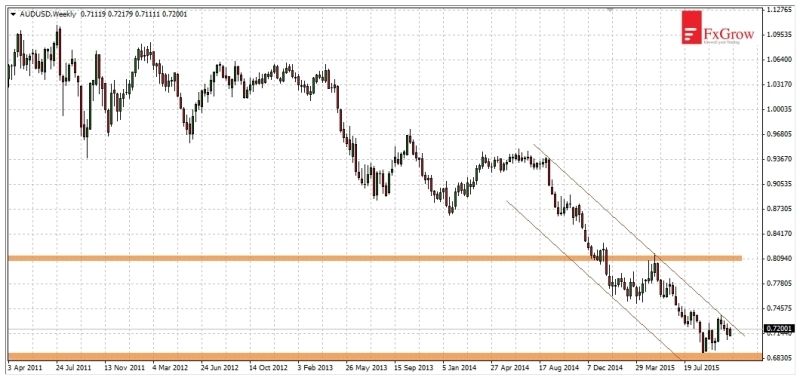
Wider view, time-frame W1
At weekly intervals price also moves in a downward channel. Price is “stuck” to the upper limit. On AUDUSD we see a valid downward trend and only break above the level of 0.8100 will give a real chance to reverse current momentum. Now a movement towards the YTD lows at 0.6900 are more likely.
For more in depth Research & Analysis please visit FxGrow.
Note: This analysis is intended to provide general information and does not constitute the provision of INVESTMENT ADVICE. Investors should, before acting on this information, consider the appropriateness of this information having regard to their personal objectives, financial situation or needs. We recommend investors obtain investment advice specific to their situation before making any financial investment decision.
FxGrow Daily Technical Analysis – 03rd Nov, 2015
By FxGrow Research & Analysis Team
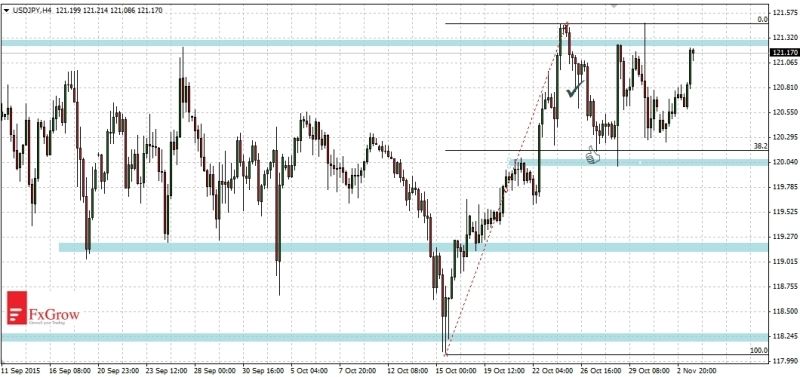
USDJPY - correction may be already finished
Previous analysis of October 26 proved to be extremely profitable. In one day, the price reached the indicated level, giving a profit of over 800 pips. In analysis entitled “correction uptrend rally” I wrote: “Currently falls should reach at least around 120.00 - 120.30, there is a basic fibo level 38.2%.”
After reaching the indicated retracement, price began upward movement, which tested October high. At the moment everything depends on constans breaking the resistance at 121.45. If it succeeds, USDJPY will return to the main trend and the upward movement will be continued. The next targets will be at the levels: 122.00, 123.00, 124.50, 125.20. Alternatively, if there were declines and the price went down below 120.00, targets for bears would be the levels of 119.60, 119.15, 118.20.
For more in depth Research & Analysis please visit FxGrow.
Note: This analysis is intended to provide general information and does not constitute the provision of INVESTMENT ADVICE. Investors should, before acting on this information, consider the appropriateness of this information having regard to their personal objectives, financial situation or needs. We recommend investors obtain investment advice specific to their situation before making any financial investment decision.
FxGrow Daily Technical Analysis – 04th Nov, 2015
By FxGrow Research & Analysis Team
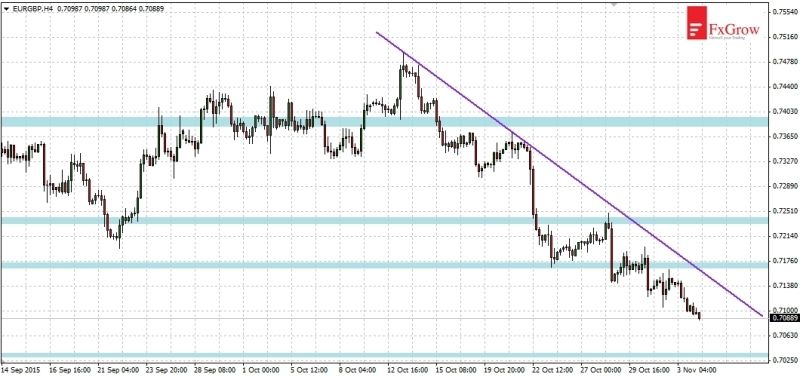
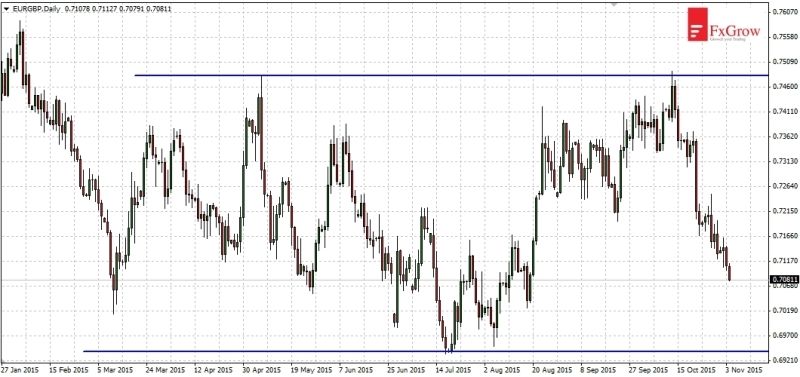
EURGBP moves towards 0.6940
In the previous analysis, I wrote: “If support at 0.7200 has been permanently broken the goal of falls will be the level of 0.6940. Along the way supply will have to deal with supports: 0.7165, 0.7090, 0.7035”. And so it happened since February 2015 EURGBP moves in consolidation between the levels 0.7480 - 0.6940. After testing the upper limit of this consolidation in mid-October now falls should reach to the lower limit. The nearest support is at 0.7040. If there was a rebound it should be stopped at the level of 0.7165. There is a downward trend line and the nearest major resistance.
Time-frame H4:
Time-frame D1:
For more in depth Research & Analysis please visit FxGrow.
Note: This analysis is intended to provide general information and does not constitute the provision of INVESTMENT ADVICE. Investors should, before acting on this information, consider the appropriateness of this information having regard to their personal objectives, financial situation or needs. We recommend investors obtain investment advice specific to their situation before making any financial investment decision.
FxGrow Daily Technical Analysis – 04th Nov, 2015
By FxGrow Research & Analysis Team
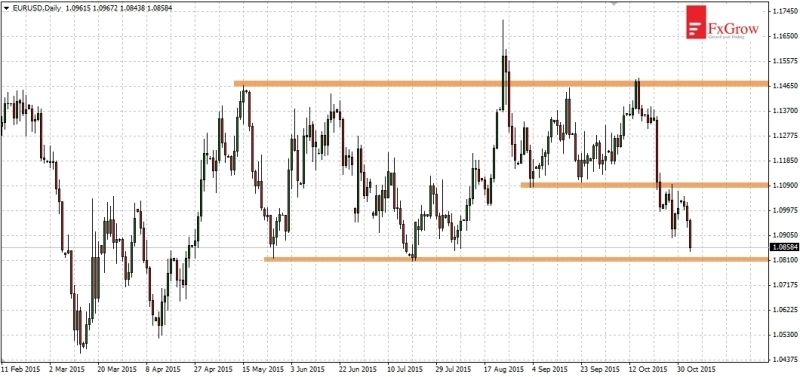
EURUSD 3-months low
Since October 15 the price moves in a dynamic downward trend. In the less than three weeks EURUSD made a downward movement over 600 pips. After breaking below the support at level 0.1080 price returned to this level. That move only confirmed that the indicated level has now become resistance and downward movement continues. Currently there is only a matter of time, when support will be tested at level 1.0810.
Because the current downward movement hasn’t been corrected yet, so it is very likely that price will rebound there. Rebound will be able to reach 1.1080, which is a significant resistance and will be strengthened by 38.2% fibo level. If the downward movement will break below indicated support, next declines targets are on levels: 1.0715, 1.0660, 1.0520, 1.0460.
For more in depth Research & Analysis please visit FxGrow.
Note: This analysis is intended to provide general information and does not constitute the provision of INVESTMENT ADVICE. Investors should, before acting on this information, consider the appropriateness of this information having regard to their personal objectives, financial situation or needs. We recommend investors obtain investment advice specific to their situation before making any financial investment decision.
FxGrow Daily Technical Analysis – 05th Nov, 2015
By FxGrow Research & Analysis Team
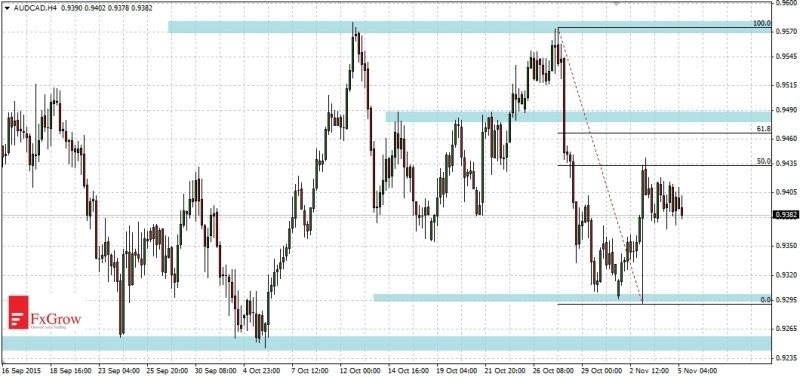
AUDCAD - double top caused declines
In October there was an attempt of break above resistance at 0.9510. It succeeded twice, but each time dynamic downward movement followed. Finally a double top formation appeared and caused declines. Since the beginning of November there is a retracement, which reached 50% fibo level of the last downward movement. In the nearest future price may persist between the levels 0.9290 - 0.9490. If the resistance at 0.9490 will be broken, target of upward movement will be 0.9580. If level 0.9290 will be broken, target of downward movement will be at 0.9250.
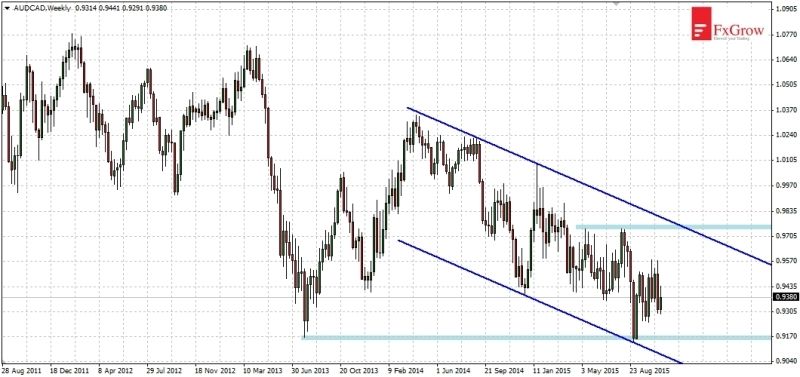
Wider view, time-frame W1
Since almost 2 years AUDCAD moves in a downward channel. In August there was a test of lower limit of that channel and rebound. That movement has reached to the mid-channel. If there will be a strong upward movement, then it will aim 0.9750 which is the upper limit of the downward channel and resistance. If the falls will return, their first target will be at the level 0.9160, and after break below the next one at 0.9070 - which is a lower limit of the downward channel.
For more in depth Research & Analysis please visit FxGrow.
Note: This analysis is intended to provide general information and does not constitute the provision of INVESTMENT ADVICE. Investors should, before acting on this information, consider the appropriateness of this information having regard to their personal objectives, financial situation or needs. We recommend investors obtain investment advice specific to their situation before making any financial investment decision.
FxGrow Daily Technical Analysis – 05th Nov, 2015
By FxGrow Research & Analysis Team
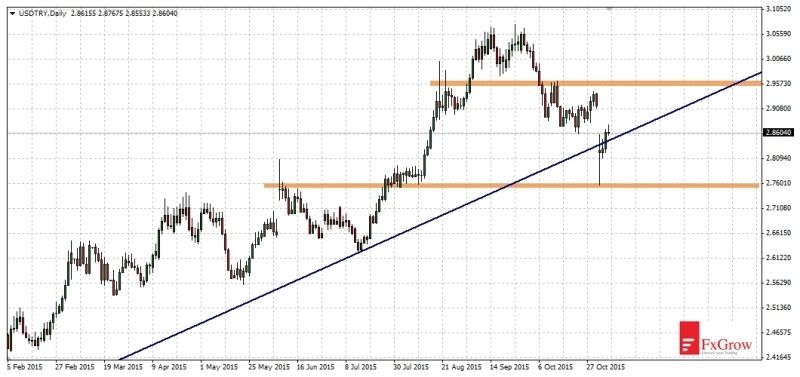
USDTRY attempt to keep above uptrend line
A lot of volatility as a result of the political turmoil in the currency pairs with the Turkish lira. On Sunday, the party supported by currently president won the elections, at the end it was not certain. As a result of this uncertainty on USDTRY Monday’s session began with a gap of 900 pips down. This resulted with braking below the uptrend line. Price is already 2,000 pips below the September’s high. However, the situation is still open. Recent declines can be considered only as a correction if the price returns to upward movement. The first task for the bulls is closing the gap from Monday and break above the level of 2.9600.
In the case of falls continuation and break below trend line, supports are on levels 2.8060 and 2.7550 which is a November’s minimum. Breakout of indicated resistance will signal the start of a larger correction, and maybe even the trend change.
For more in depth Research & Analysis please visit FxGrow.
Note: This analysis is intended to provide general information and does not constitute the provision of INVESTMENT ADVICE. Investors should, before acting on this information, consider the appropriateness of this information having regard to their personal objectives, financial situation or needs. We recommend investors obtain investment advice specific to their situation before making any financial investment decision.
FxGrow Daily Technical Analysis – 06th Nov, 2015
By FxGrow Research & Analysis Team
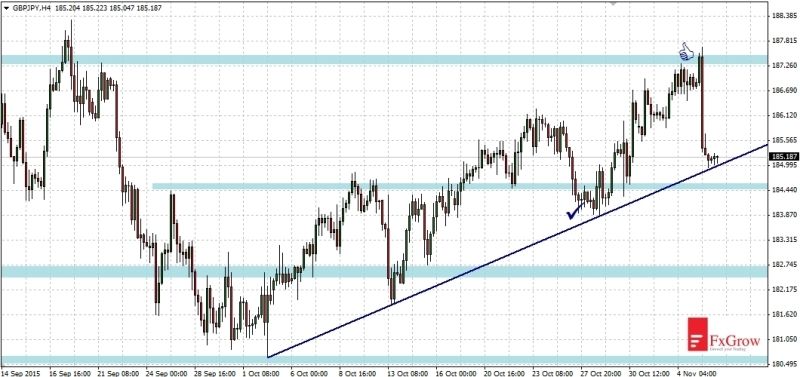
GBPJPY on October’s trendline
Analysis from October 28 was wery profitable. I wrote: “Today’s demand is testing resistance at 184.50. If break above will be successful next resistances are on levels 186.00, 187.50. Move higher than 187.50 may be difficult and there is little chance that this will happen soon”. Indeed price reached 187.68 and rebounded. Downward movement was dynamic.
Falls stopped below support on uptrend line which can be determined at the October lows. The line was tested for the third time and this time It can be broken. The first target of falls will be the level 184.50. If the downward movement will proceed its main target is the level of 180.50, and before there are: 183.90 182.50. Alternatively, if rebound occurs price once again will move towards 187.50.
For more in depth Research & Analysis please visit FxGrow.
Note: This analysis is intended to provide general information and does not constitute the provision of INVESTMENT ADVICE. Investors should, before acting on this information, consider the appropriateness of this information having regard to their personal objectives, financial situation or needs. We recommend investors obtain investment advice specific to their situation before making any financial investment decision.
FxGrow Daily Technical Analysis – 06th Nov, 2015
By FxGrow Research & Analysis Team
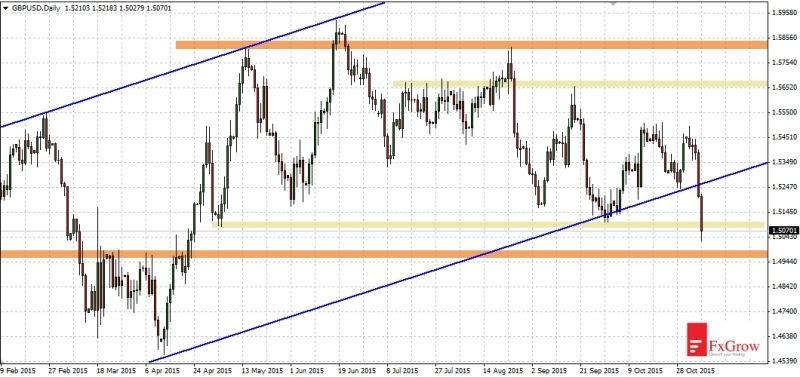
GBPUSD - macro data caused six-months low
Yesterday dovish Bank Of England caused a breach of channel’s low in which the price moved. Today’s US non farm payrolls and employment data confirmed falls and after that GBPUSD break below first important support at 1.5100. Unemployment has fallen to 5%, which was one of the task of the FED. At this moment probability of the first rate hike in the US in December increased. The first level, which may cause rebound is 1.4980. Next support is 1.4800 and the next one is low of 2015 at 1.4560.
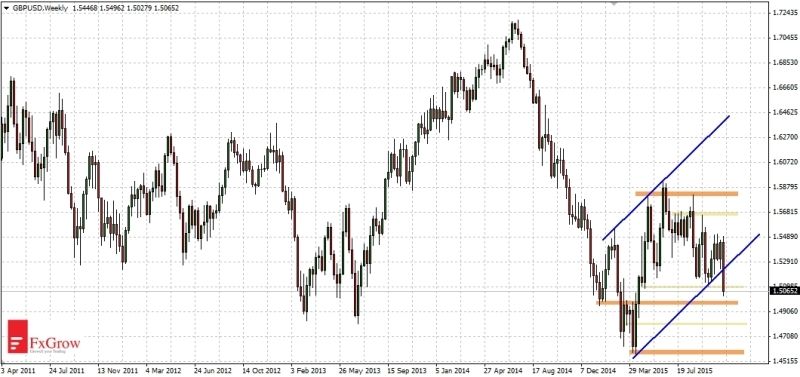
When we take a look at weekly interval, the situation is even more serious. Since the beginning of the year upward movement took form of flag, which suggests a continuation of previous trend. If price couldn’t get back inside the flag, this year’s lows will be under pressure of sellers. Upward movement, which took place from the beginning of the year, got the form of flag, which promises a continuation of the previous trend. If price cannot quickly get back inside the flag, then this year lows will find themselves under sellers pressure.
Time-frame D1
Time-frame W1
For more in depth Research & Analysis please visit FxGrow.
Note: This analysis is intended to provide general information and does not constitute the provision of INVESTMENT ADVICE. Investors should, before acting on this information, consider the appropriateness of this information having regard to their personal objectives, financial situation or needs. We recommend investors obtain investment advice specific to their situation before making any financial investment decision.