Although the economic data has been positive, but the dollar index began to decline after a day of growth.
Particular attention deserves Initial Jobless Claims, which rose by only 1,000 to 326,000 during the last week. Analysts predicted 330,000.
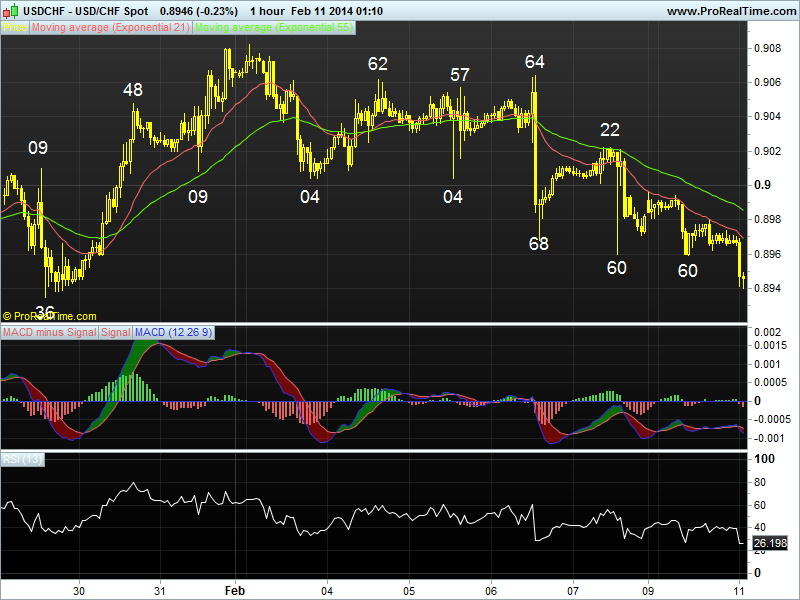
The pair has broken the support at the 91st figure and fell to the support at 0.8965. It is expected that the decrease will be continued. On breaking this support the price may fall to 0.8905.
DAILY USD/CHF TECHNICAL OUTLOOK
11 Feb 2014 00:43GMT
Trend Daily Chart
Sideways
Daily Indicators
Falling
21 HR EMA
0.8973
55 HR EMA
0.8987
Trend Hourly Chart
Near term down
Hourly Indicators
Turning up
13 HR RSI
39
14 HR DMI
-ve
Daily Analysis
Consolidation with downside bias
Resistance
0.9082 - last Mon’s high
0.9064 - last Thur’s high
0.9022 - last Fri’s high
Support
0.8960 - last Fri’s n y’day’s low
0.8936 - Jan 29 NY morning low
0.8904 - Jan 24 low
. USD/CHF - 0.8967…. Despite dlr’s initial bounce to 0.8998 in NZ on Mon, broad-based softness in greenback after last Fri’s downbeat U.S. non-farm pay-roll report kept price under pressure n dlr dropped to 0.8960 (also Fri’s low)in European morning b4 moving sideways in thin NY session.
. Looking at the daily picture, y’day’s re-test of sup 0.8960 suggests
recovery fm 0.8904 (Jan 24 trough) has ended at 0.9082 last Mon n consolidation with downside bias wud be seen for near term decline fm Jan’s peak at 0.9156 to resume n yield re-test of aforesaid low, break extend weakness twds 0.8883, then 0.8860.
However, Dec’s 2-year trough at 0.8800 wud remain intact n yield rebound
later this week. On the upside, only 0.9064 wud abort bearish view on the buck n bring gain to 0.9082, break there wud yield stronger retrace. to 0.9133/34.
. Today, selling dlr on intra-day recovery in anticipation of weakness to
0.8925 is favoured n only abv last Fri’s high of 0.9022 wud signal further
‘gyrations’ inside recent established range of 0.8904-0.9082 wud continue n may yield another rise.
However, said upper lvl wud remain intact today n bring another fall later.
The disappointing news regarding the USA labor market supported the frank. They are higher than the December numbers 75,000, but well below the average forecast. The unemployment rate fell to 6.6% from 6.7 %, while analysts had forecast 6.7 %.
If the pair keeps falling it will go straight to 0.8940 and if it changes its mind the pair will grow to 0.9040, then to 0.9130.

Hey! Check this out - tons of good advice for traders and loads of fresh analytics.
[Forex Broker Rating and Reviews, Free Forex Signals - on GuruTradee](http://www.gurutrade.com/)
Highly recommend!
The US dollar has slipped at the American session after the new Fed chairman Janet Yellen’s speech to the Congress. She stated that the labour market situation was improving, however, this process was far from complete: the likely tapering of QE would continue with a moderate pace; the USD/CHF pair would remain at the same range.
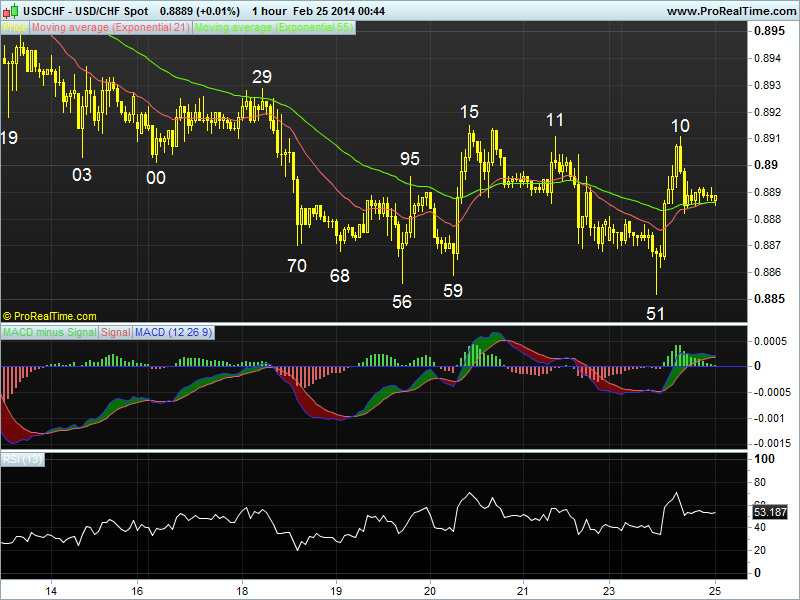
“Bears” on the dollar/franc repeatedly tried to break through the support around 0.8941, but bids of the “bulls” were not allowed the pair mentioned. At the end the pair was bought, that enabled it to climb up to 0.8987. However the pressure on the dollar remains, as well as the chances to fall down to 0.8900. The growth and the ability to hold around 0.9000–0.9020 will indicate the resumption of the upward dynamics.
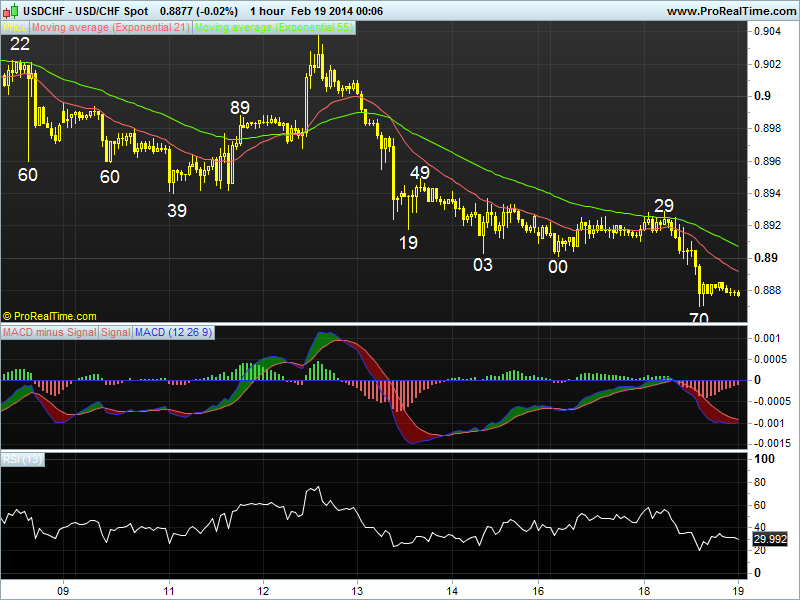
[B]DAILY USD/CHF TECHNICAL OUTLOOK[/B]
Last Update At [B]19 Feb 2014[/B] [I]00:12GMT[/I]
[B]Trend Daily Chart [/B]
Down
[B]Daily Indicators[/B]
Falling
[B]21 HR EMA [/B]
0.8891
[B]55 HR EMA[/B]
0.8907
[B]Trend Hourly Chart [/B]
Down
[B]Hourly Indicators[/B]
Bullish convergences
[B]13 HR RSI [/B]
29
[B]14 HR DMI[/B]
-ve
[B]Daily Analysis[/B]
Resumption of recent decline
[B]Resistance [/B]
0.9038 - last Wed’s high
0.8989 - last Tue’s high
0.8949 - last Thur’s NY res
[B]Support[/B]
0.8870 - Y’day’s low
0.8860 - Dec 30 low
0.8800 - Dec 27 low
. [B]USD/CHF - 0.8879[/B]… Despite dlr’s recovery fm Monday’s low at 0.8900 to
0.8929 in Asia on Tuesday, intra-day rally in euro together with selling in
eur/chf cross pressured price lower in Europe n dlr later fell to a fresh 6-week
trough at 0.8870 in NY morning b4 stabilizing.
. Looking at the hourly n daily charts, y’day’s fall below Mon’s low at
0.8900 to 0.8870 suggests bias for dlr remains to the downside n decline fm
Jan’s peak at 0.9156 shud pressure price further to 0.8860 n then 0.8832, being
Dec 30 low n Dec 17 low respectively, after consolidation. However, as hourly
oscillators wud display prominent bullish convergences on such move, sharp fall
below there is unlikely to be seen n reckon Dec’s 2-year low at 0.8800 wud hold
on 1st testing n yield minor correction later this week. Looking ahead, a daily
close below 0.8800 wud confirm MT downtrend fm 2012 peak at 0.9972 has 'finally’
resumed n extend weakness twd 0.8700 in late Feb/early Mar.
. In view of abv analysis, selling dlr on intra-day recovery is still
favored today but one shud take profit on next decline. On the upside, only abv
0.8949 wud indicate a temporary low has been made n risk retracement to 0.8989.
The Swiss franc rose amid total dollar sales after a new portion of the U.S. weak statistics.
The pair USD/CHF is consolidating just above 0.8870. The loss may increase to 0.8830. The immediate resistance is at 0.9060 (highs 46 February). The return above 0.9100 will make the growth target 0.9140/50 and 0.9180 (maximum of 20 November).
The pair dollar/franc could not develop a growth above 0.8928. It was sold here, and it fell to 0.8868. The overall picture is negative for growth and ability to consolidate above 0.9100 will be proof of that.
 DAILY USD/CHF TECHNICAL OUTLOOK
25 Feb 2014 01:40GMT
Trend Daily Chart
Sideways
Daily Indicators
Falling
21 HR EMA
0.8886
55 HR EMA
0.8884
Trend Hourly Chart
Sideways
Hourly Indicators
Rising
13 HR RSI
51
14 HR DMI
+ve
Daily Analysis
Consolidation b4 decline resumes
Resistance
0.8994 - 61.8% r of 0.9082 to 0.8851
0.8968 - Feb 12 low
0.8929 - Last Tue’s high
Support
0.8851 - Y’day’s low
0.8800 - Dec 2-year low (27th)
0.8771 - 1.236 ext. of 0.9156-0.8904 fm 0.9082
. USD/CHF - 0.8885… Although dlr remained under pressure in Asia on Mon due
to selling of eur/chf cross n briefly fell below last Wed’s low at 0.8956 to
a fresh 8-week trough at 0.8951 in Europe, renewed dlr’s broad-based strength n
cross unwinding lifted price to 0.8910 in NY morning b4 retreating.
. Looking at hourly n daily charts, dlr’s recovery after y’day’s resumption
of ‘erratic’ fall fm 0.9156 to 0.8851 suggests a minor low is made n choppy
trading wud be seen initially, however, present falling daily technical indica-
tors suggests dlr’s broad outlook remains mildly bearish, reckon chart res at
0.8929/39, being the ‘minimum’ 38.2% r of intermediate fall fm 0.9082-0.9051 n
last Tue’s high respectively, wud cap upside n bring another fall twd Dec’s 2-
year trough at 0.8800 later this week. However, a break there is needed to con-
firm the MT downtrend fm 2012 peak at 0.9972 has finally resumed, extend weak-
ness to 0.8636 next month, this is 50% proj. of the intermediate fall fm 0.8839
(2013 high in May) to 0.8800 measured fm 0.9156.
. Today, we are trading dlr fm short side for next decline to 0.8830. Only
abv 0.8968 (Feb 12 low) risks stronger retrace. twd 0.8990/00 b4 down.
Frank continues to consolidate after the euro. From a technical point of view, the pair USD/CHF is trading below 0.8900. The immediate support is at 0.8850 (lows of last week). The loss may increase to 0.8820.
The downtrend is slowing down. The pair may remain at the current level 0.8850 for a while still we expect a trend reversal upwards. The first target is 0.8890, the second is 0.8910.
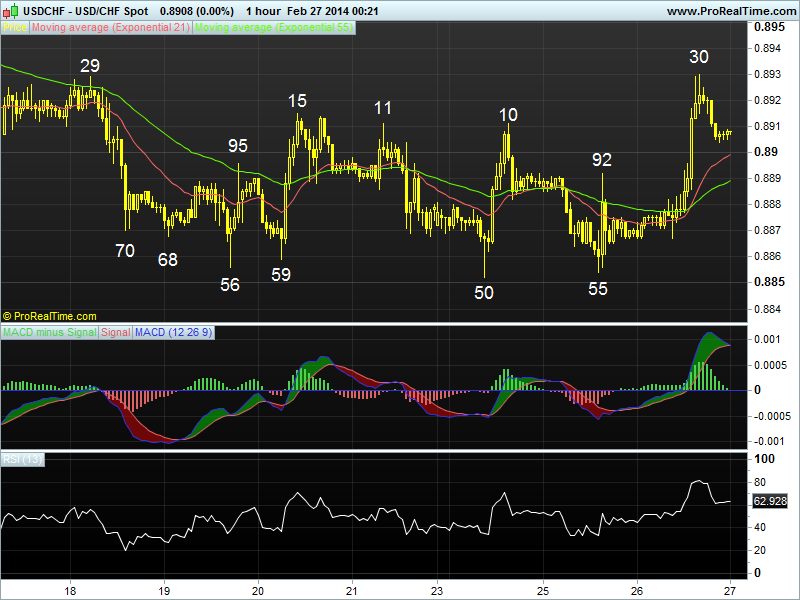
DAILY USD/CHF TECHNICAL OUTLOOK
27 Feb 2014 00:28GMT
Trend Daily Chart
Sideways
Daily Indicators
Falling
21 HR EMA
0.8899
55 HR EMA
0.8889
Trend Hourly Chart
Nr term up
Hourly Indicators
Easing fm o/bot
13 HR RSI
63
14 HR DMI
+ve
Daily Analysis
Consolidation with upside bias
Resistance
0.8989 - Feb 11 top
0.8967 - Min. 38.2% r of 0.9156-0.9050
0.8930 - Y’day’s low
Support
0.8892 - Tue’s high (now sup)
0.8850 - Mon’s low
0.8800 - Dec 2-year low (27th)
. USD/CHF - 0.8910… Although dlr traded sideways after finding sup at
0.8867 in Asia on Wed, price started to ratchet higher in Europe due to euro’s
intra-day weakness. Later, dlr rallied to 0.8930 in NY morning as U.S. Jan new
home sales rose unexpectedly b4 retreating to 0.8904 near NY close.
. Looking at hourly n daily charts, y’day’s breach of indicated res at
0.8910/15 (Mon’s high n Feb’s 20 high respectively) confirms decline fm Jan’s
peak at 0.9156 has formed a temporary bottom at Mon’s 8-week trough at 0.8850 n
as long as this sup holds, consolidation with upside bias remains for gain twd
0.8967, being ‘minimum’ 38.2% r of 0.9156-0.8850, however, as hourly oscillators
wud be in o/bot territory on such a move, measured res at 0.8993/03, 61.8% r of
intermediate fall fm 0.9082-0.8850 n also a ‘natural’ 50% r of aforesaid entire
decline respectively, shud hold n yield strg retreat later.
. In view of abv analysis, buying dlr on intra-day pullback is favoured but
one shud be prudent to take profit twd 0.8960/70. On the downside, only a break
below 0.8850 sup wud revive early bearishness instead for subsequent weakness
twd Dec’s 2-year trough at 0.8800 tom or early next week.
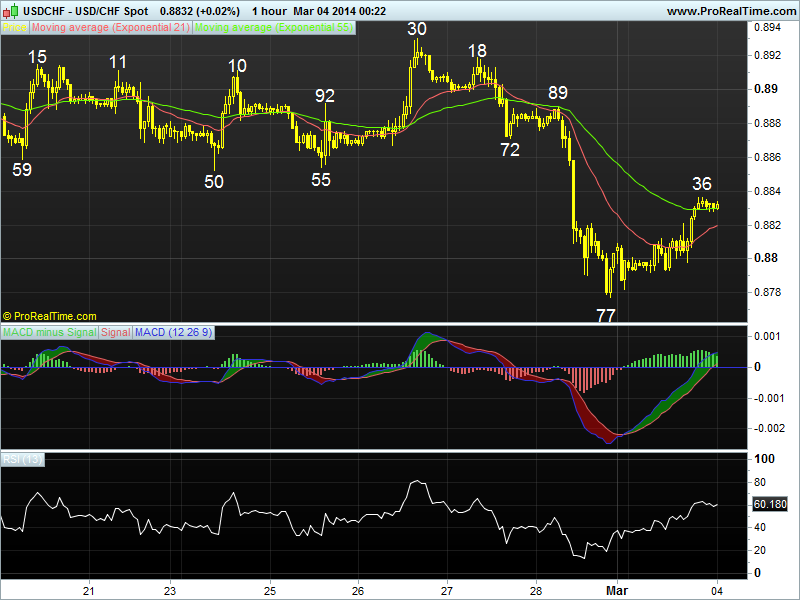
DAILY USD/CHF TECHNICAL OUTLOOK
04 Mar 2014 01:08GMT
Trend Daily Chart
Down
Daily Indicators
Falling
21 HR EMA
0.8820
55 HR EMA
0.8829
Trend Hourly Chart
Sideways
Hourly Indicators
Rising
13 HR RSI
60
14 HR DMI
+ve
Daily Analysis
Choppy trading to continue
Resistance
0.8930 - Last Wed’s high
0.8889 - Last Fri’s high
0.8850 - Last Mon’s low (now sup)
Support
0.8777 - Last Fri’s fresh 2-year low
0.8742 - 100% proj. of 0.9038-0.8850 fm 0.8930
0.8674 - .618 ext. of 09156-0.8904 fm 0.9082
. USD/CHF - 0.8805.… Dlr found support after a brief selloff fm 0.8809 to
0.8783 in Aust. on Mon on short-covering in eur/chf cross n price later edged
higher to 0.8812 in early Europe n continued to strengthen after release of
upbeat U.S. eco. data, posting session high at 0.8836 in NY afternoon.
. Looking at the hourly n daily charts, dlr’s rebound to 0.8836 suggests
1-2 days of choppy trading abv last Fri’s fresh 2-year bottom at 0.8777 wud be
seen b4 MT downtrend fm 0.9972 (2012 top) resumes for a re-test of said sup. A
stronger recovery twd 0.8854, being the ‘natural’ 50% r of intermediate fall fm
0.8930-0.8777, cannot be ruled out, however, reckon chart res at 0.8889 (last
Fri’s high) wud hold n downside bias remains for another fall later. Looking
ahead, a breach of 0.8777 wud confirm aforesaid decline to correct early LT
uptrend fm 2011 record low at 0.7072 has resumed n price shud en route to 0.86
36, being 50% projection of the intermediate fall fm 0.9839 (2013 peak) to
0.8800 measured fm 0.9156, later this month.
. In view of abv analysis, we’re standing aside initially n wud sell on
recovery twd 0.8889 as only abv 0.8930 aborts bearishness, risks gain to 0.8989.
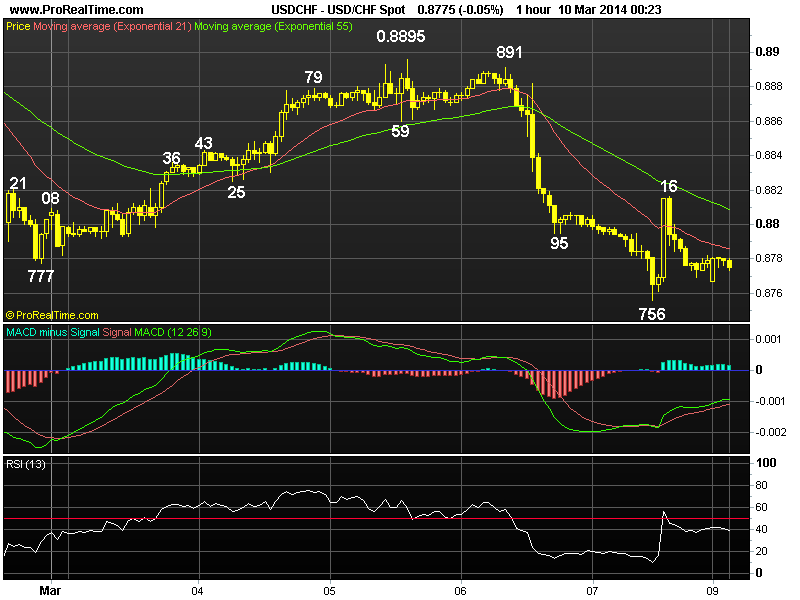
[B]WEEKLY USD/CHF TECHNICAL OUTLOOK
10 Mar 2014[/B] [I]00:20GMT[/I]
[B]Trend Daily Chart[/B]
Down
[B]Daily Indicators [/B]
Falling
[B]21 HR EMA [/B]
0.8786
[B]55 HR EMA[/B]
0.8809
[B]Trend Hourly Chart[/B]
Down
[B]Hourly Indicators [/B]
Bullish convergences
[B]13 HR RSI[/B]
39
[B]14 HR DMI[/B]
-ve
[B]Daily Analysis[/B]
Consolidation b4 decline resumes
[B]Resistance [/B]
0.8895 - Last Wed’s high
0.8859 - Last Wed’s low (now sup)
0.8816 - Last Fri’s high
[B]Support[/B]
0.8756 - Last Fri’s frsh 2-year low
0.8707 - 61.8% proj. of 0.9082-0.8777 fm 0.8895
0.8674 - 1.618 times ext. of 0.9156-0.8904 fm 0.9082
. [B] USD/CHF - 0.8775[/B]… Although dlr traded abv previous week’s 2-year low
of 0.8777 last Mon n ratcheted higher on short-covering to 0.8895 Wed, rally in
eur/usd on Thur after ECB president Draghi’s upbeat remarks knocked price lower,
dlr later fell to 0.8756 on Fri b4 briefly recovering to 0.8816 in NY session.
. Looking at the daily chart, last week’s breach of 0.8777 low to a fresh
2-year trough at 0.8756 shud pressure the greenback this week n as long as res
at 0.8895 holds, the MT downtrend fm 0.9972 (2012 peak) to retrace dlr’s LT rise
fm 2011 record low at 0.7072 (Aug) wud head to 0.8636, this is 50% proj. of the
intermediate fall fm 0.9839 to 0.8800 measured fm 0.9156, however, as daily
technical indicators’ readings wud reach o/sold territory on such move, reckon
0.8522, being the ‘natural’ 50% correction of aforesaid LT upmove, wud contain
weakness n bring rebound later this month. Therefore, selling dlr on recovery in
anticipation of resumption of decline is favoured n only abv 0.8895 confirms a
temporary low is in place n risks strg retracement to 0.8930, 0.9038.
. Today, expect initial sideways trading n as long as Fri’s NY high at 0.88
16 holds, marginal fall to 0.8707/10 is likely. Abv 0.8816 risks 0.8855/60
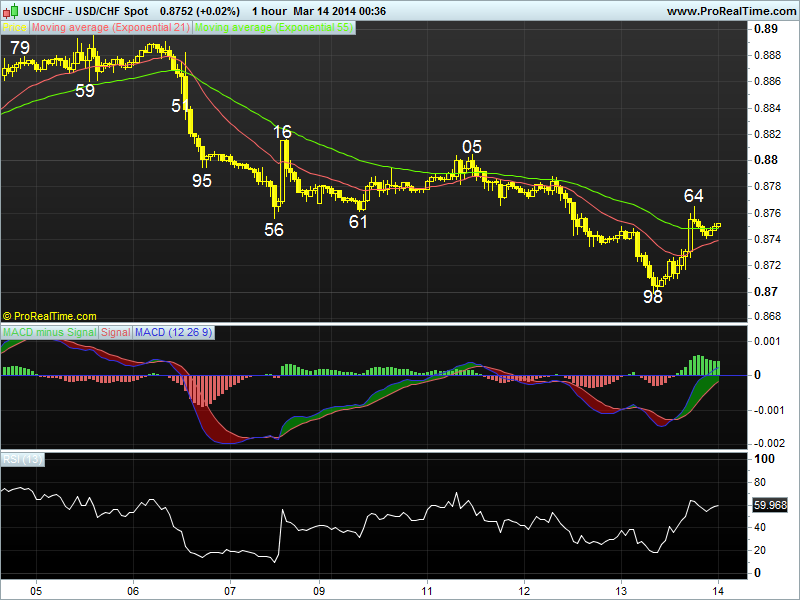
DAILY USD/CHF TECHNICAL OUTLOOK
Last Update At 14 Mar 2014 00:58GMT
Trend Daily Chart
Down
Daily Indicators
Falling
21 HR EMA
0.8739
55 HR EMA
0.8748
Trend Hourly Chart
Sideways
Hourly Indicators
Rising
13 HR RSI
59
14 HR DMI
+ve
Daily Analysis
Consolidation with upside bias
Resistance
0.8859 - Last Wed’s low (now res)
0.8816 - Last Fri’s high
0.8764 - Y’day’s high
Support
0.8698 - Y’day’s fresh 2-1/4 year low
0.8674 - 1.618 times ext. of 0.9156-0.8904 fm 0.9082
0.8636 - 50% proj. of 0.9839-0.8800 fm 0.9156
. USD/CHF - 0.8752… Dlr met renewed selling at 0.8749 in Asia on Thur n price easily penetrate Wed’s NY low at 0.8734 to a fresh 2-1/4 year trough at 0.8698 in European morning. Later, dlr staged a rally to 0.8764 in NY afternoon, due partly to the selloff in euro b4 trading sideways.
. Looking at the hourly n daily charts, y’day’s rally fm a fresh 2-1/4
year trough at 0.8698 together with prominent bullish convergences appearing on hourly indicators suggest MT downtrend fm 2012 peak at 0.9972 has formed a temporary bottom there n as price wud at least retrace the intermediate fall fm 0.9038 (Feb 12 peak), upside bias remains for gain to 0.8828, being the minimum 38.2% r, abv wud extend marginally but res area 0.8859/68 (last Wed’s low, now res n 50% r of 0.9038-0.8698 resp.) shud hold today n yield retreat. Looking ahead, a daily close below 0.8698 wud revive bearishness for a resumption of MT fall twds 0.8674 (1.618 times ext. of 0.9156-0.8904 measured fm 0.9082), then 0.8636, being 50% proj. of 0.9839-0.8800 measured fm 0.9156.
. Today, in view of nr term bullish bias, we are holding a long position
entered in NY for gain to 0.8830 n a stop placed at 0.8720.
The franc stabilized after reaching the maximum level versus the U.S. dollar since 2011. The Swiss National Bank may resort to negative rates if the ECB lowers the interest rates at its April meeting, because any pressure from the ECB will influence the franc. The ECB rate cut in April is more likely to happen, to avoid further inflation reduce.
The sellers have a goal - 0.8690. The next one is 0.8640.
Hey! Check this out - tons of good advice for traders and loads of fresh analytics.
‘http://www.gurutrade.com’
Highly recommend!
The Franc has been falling in the past two weeks. After the consumer price inflation release in Germany the franc recovered.
The Franc weakened versus the dollar after the release of a mixed report on the U.S. GDP growth yesterday.
The first support is 0.8800, the next one is 0.8740. The first resistance is 0.8850, the next one is 0.8890.
The Franc is directed to 0.8800. When the price consolidates at the first target, the main goal for sales will become the level 0.8740.
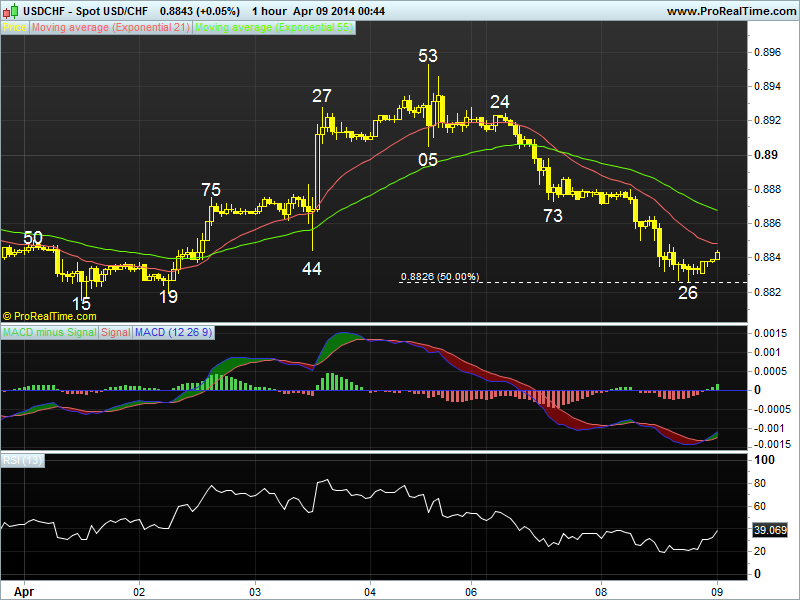
DAILY USD/CHF TECHNICAL OUTLOOK
Last Update At 09 Apr 2014 00:38GMT
Trend Daily Chart
Sideways
Daily Indicators
Turning down
21 HR EMA
0.8448
55 HR EMA
0.8468
Trend Hourly Chart
Down
Hourly Indicators
Rising fm o/s
13 HR RSI
39
14 HR DMI
-ve
Daily Analysis
Minor recovery b4 one more fall
Resistance
0.8953 - Last Fri’s high
0.8905 - Last Fri’s low
0.8880 - Y’day’s high
Support
0.8826 - Y’day’s low
0.8815 - Last Tue’s low
0.8788 - Mar 24 low
. USD/CHF - 0.8843… The pair tracked intra-day moves in eur/usd closely y’day. Despite initial narrow trading in Asia, intra-day rally in euro due to broad-based usd’s weakness together with selling in eur/chf cross at London open knocked price lower, dlr tanked fm 0.8880 (European high) to 0.8826 in NY.
. Let’s look at the daily picture 1st, y’day’s selloff to 0.8826, which is
exactly 50% r of the recent erratic rise fm Mar’s fresh 2-year trough at 0.8698
to 0.8953 confirms the 1st leg of correction has ended n as price is currenly
trading below the 21-hr & 55-hr emas, suggesting downside bias remains for further weakness to the ‘dynamic’ 61.8% r objective at 0.8795, however, a daily close below daily sup at 0.8788 is needed to signal aforesaid correction fm 0.8698 has ended, then dlr wud ratchet lower twd 0.8698 later this month. On the upside, a move back abv 0.8905 anytime wud turn outlook bullish for re-test of 0.8953.
. Today, in view of abv analysis, selling dlr on recovery is the way to go
but profit shud be taken on decline as 0.8788 sup is expected to hold on 1st
testing n risk is seen for a rebound to take place later today or tomorrow.
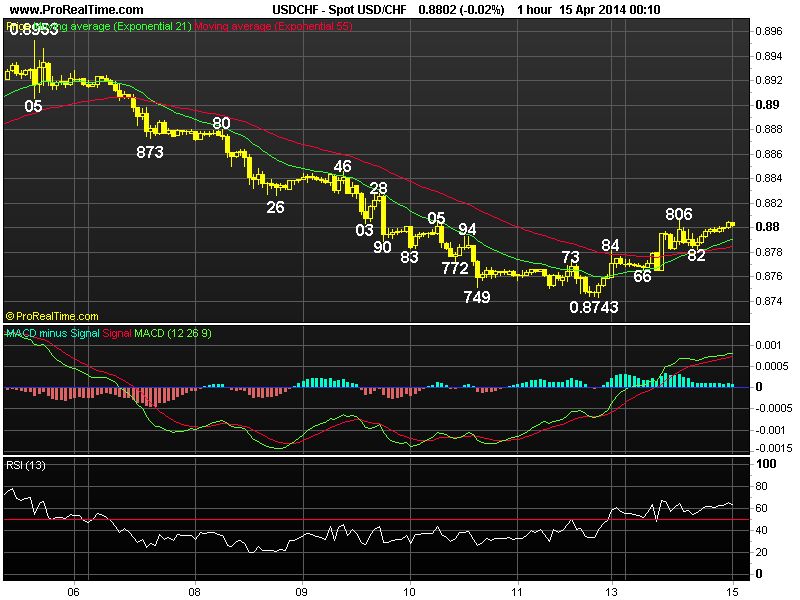
[B]DAILY USD/CHF TECHNICAL OUTLOOK[/B]
Last Update At [B]15 Apr 2014[/B] [I]00:09GMT[/I]
[B]Trend Daily Chart [/B]
Sideways
[B]Daily Indicators [/B]
Falling
[B]21 HR EMA [/B]
0.8790
[B]55 HR EMA[/B]
0.8785
[B]Trend Hourly Chart [/B]
Sideways
[B]Hourly Indicators[/B]
Rising
[B]13 HR RSI [/B]
63
[B]14 HR DMI[/B]
+ve
[B]Daily Analysis[/B]
Initial recovery b4 retreat
[B]Resistance [/B]
0.8899 - Mar 28 high
0.8846 - Last Wed’s high
0.8806 - Y’day’s high 0.8743 -
[B]Support[/B]
Last Fri’s 3-week low
0.8698 - Mar 13 low
0.8665 - 61.8% proj. of 0.9839-0.8891 fm 0.9251
. [B]USD/CHF - 0.8804.[/B]… The greenback rose to 0.8784 in NZ due to the gap-down open in euro n continued to strengthen in European session. Price climbed to session high of 0.8806 at NY open after the release of stronger-than-expected U.S. retail sales. Dlr eased to 0.8782 at European closing b4 rebounding.
. Looking at the hourly n daily charts, although Fri’s rebound fm 0.8743
suggests MT downtrend fm 2012 peak at 0.9972 is not ready to resume yet n choppy trading abv Mar’s fresh 2-year trough at 0.8698 wud continue, as dlr’s sell off fm 0.8953 (Apr 6 high) to 0.8743 confirms the 1st leg of correction has ended, reckon 0.8846 wud limit upside n bring another fall. Below said 0.8743 low wud retain bearishness for a re-test of 0.8698 later this week, break wud confirm aforesaid decline has resumed n extend weakness to 0.8665 (61.8% projection of 0.9839-0.8891 measured fm 0.9251).
. Today, in view of abv analysis, we are looking to sell dlr on intra-day
gain for subsequent strong retreat but 0.8743 shud hold. On the upside, abv
0.8846 wud indicate pullback fm 0.8953 has ended instead n turn outlook bullish for gain to 0.8899. However, res 0.8953 shud remain intact.
The dollar grew versus the euro, while the Swiss franc slightly retreated.
The consumer prices rose up in March by 0.2 %, while the CPI grew to 0.2 %.
The first target is 0.8850. If the price consolidates above the first target, the level 0.8890 becomes the main goal.
Hey! Check this out - tons of good advice for traders and loads of fresh analytics.
Forex Broker Rating and Reviews, Free Forex Signals - on GuruTrade
Highly recommend!
The USDCHF was indecisive yesterday. The bias is neutral in nearest term probably with a little bearish bias testing 0.8740 support area. Immediate resistance is seen around 0.8815. A clear break above that area could trigger further bullish pressure testing 0.8850. Overall I still prefer a bearish scenario at this phase unless price breaks above 0.8870.
USD/CHF during the recent Days was in a strong and consistent Downtrend that sellers were successful in achieving the lowest price of 0.87202.Price during the downfall with reaching to the Fibonacci level of 161.8 ABC pattern has stopped from more descend and has formed a bottom price in the level of 0.87202.Currently in H4 AND H1 time frames price is above 5-day moving average that warns about the potential of ascending of price during short period of time.
AS it is obvious in the picture below, there is an ideal AB=CD harmonic pattern between the top price of 0.86610 and the bottom price of 0.87202 with ratios of 78.6 and 161.8 (also formation of butterfly pattern in CD wave), that warns the ascending of price from the D point.RSI indicator is in saturation Sell area and confirms the current bottom price, also wars about formation of a bottom price.Generally until the price level of 0.87202(D Point)is preserved, price will have the potential for reformation and ascending.
[B]
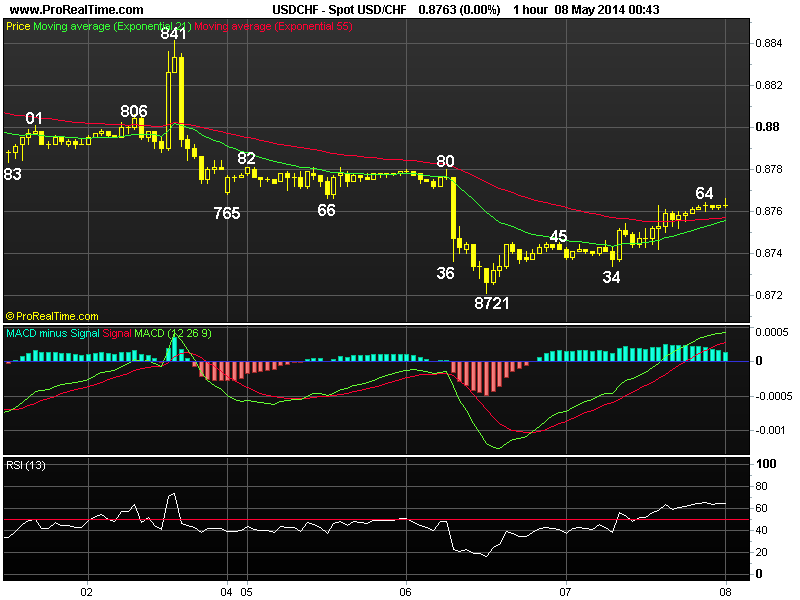
Technical Analysis of USD/CHF dated 2014.05.07[/B]

DAILY USD/CHF TECHNICAL OUTLOOK
Last Update At 08 May 2014 00:18GMT
Trend Daily Chart
Sideways
Daily Indicators
Neutral
21 HR EMA
0.8756
55 HR EMA
0.8757
Trend Hourly Chart
Down
Hourly Indicators
Rising
13 HR RSI
66
14 HR DMI
[B]+ve
Daily Analysis[/B]
Consolidation b4 oe more fall
Resistance
0.8862 - Apr 22 high
0.8806 - Last Fri’s European high
0.8780 - Tue’s high
Support
0.8721 - Tue’s low
0.8698 - Mar 13 (2014 low )
0.8652 - 100% proj. of 0.8953-0.8743 fm 0.8862
. USD/CHF - 0.8764… The greenback traded narrowly in Asia y’day after falling to a 6-week low of 0.8721 on Tue. Price edged higher to 0.8754 in Europe n then closed near session’s high of 0.8764 in NY.
. Looking at the hourly n daily charts, y’day’s rebound after failure to
penetrate Tue’s low at 0.8721 suggests MT decline fm 2012 peak at 0.9972 is not ready to resume yet n minor consolidation wud be seen, however, reckon res at 0.8780 (Tue’s high) shud limit upside n bring another fall twds 0.8721. Below wud confirm above mentioned decline has resumed n yield re-test of Mar’s 2-year low at 0.8698, break wud add credence to recent bearish view n yield further weakness twd 0.8652 (equality projection of 0.8953-0.8743 measures fm 0.8862) later this week. Having said that, as hourly oscillators wud display prominent ‘bullish convergences’ on such move, reckon 0.8582, being 80.9% projection of 0.9156-0.8698 measured fm 0.8953 wud hold n bring a much-needed correction.
. Today, we are holding a short position entered y’day in anticipation of
subsequent weakness to 0.8670. Only a daily close abv 0.8780 wud abort bearish scenario n may risk stronger retracement to 0.8806 n possibly 0.8830/40.