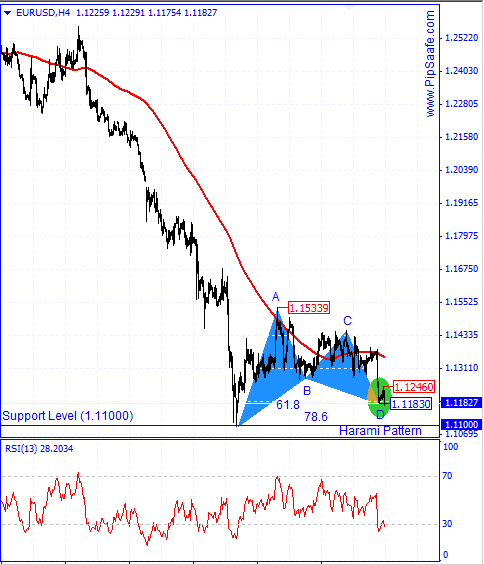
EUR/USD in recent weeks has been in a strong and consistent trend in the price movements which Sellers have been successful in reaching to the lowest price of 1.11830.As it is obvious in the picture below, price during the descending has touched the round supportive level of 1.11000 and has created the hammer candlestick pattern.As it is obvious in the picture below, there is a harmonic Gartley pattern between the bottom price of 1.11830 and the top price of 1.15339 that there is a potential for changing price direction from D point of this pattern.
According to the descending potential in weekly time frame, price reformation of 4H time frame is not stable and by breaking the support level of d point, the ascending signal for 4H time frame will be invalid.RSI indicator in 4H time frame is in saturation sell area of the D point confirms AB=CD harmonic pattern and and with the next cycle warns about ascending of price during the next candles. According to the current selling in the EUR/USD price the first warning for ascending of price is breaking of the resistance level of 1.12460.
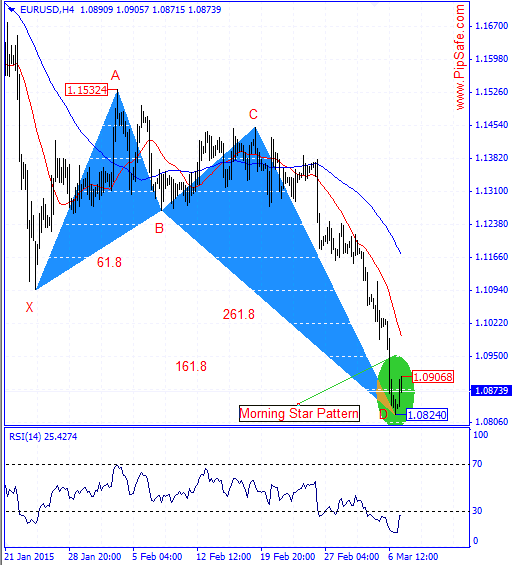
EUR/USD was in a strong and consistent downtrend during the recent months that Sellers were successful in obtaining the lowest price of 1.08240.In 4H time frame, according to the recent movement price, there is a Morning star candlestick pattern (with 3 stars) that warns about formation of a bottom price in this area and ascending of the price.
According to the formed price movement, there is Crab harmonic pattern between the bottom price of 1.08240 and top price of 1.15324 that warns about changing price direction from the D point of this pattern.RSI indicator is in saturation sell area and confirms the harmonic D point and potential for ascending of the price.One of the important warnings for ascending of the price is formation of the candlestick pattern in daily time frame or closing of a ascending candle which prepares the field for ascending of the price .
EU at this moment is a scalp long. Once the bid closes under 1.08294 on the 5m, then EUR/USD will go back to being a scalp sell. Until then it is a buy with a target to the Main pivot1.0854.
Now a 5m close across 1.08314 would result in an “inside curl formation” which would make EU a big time scalp long to the previous take profit. Until then hold the EU sell…
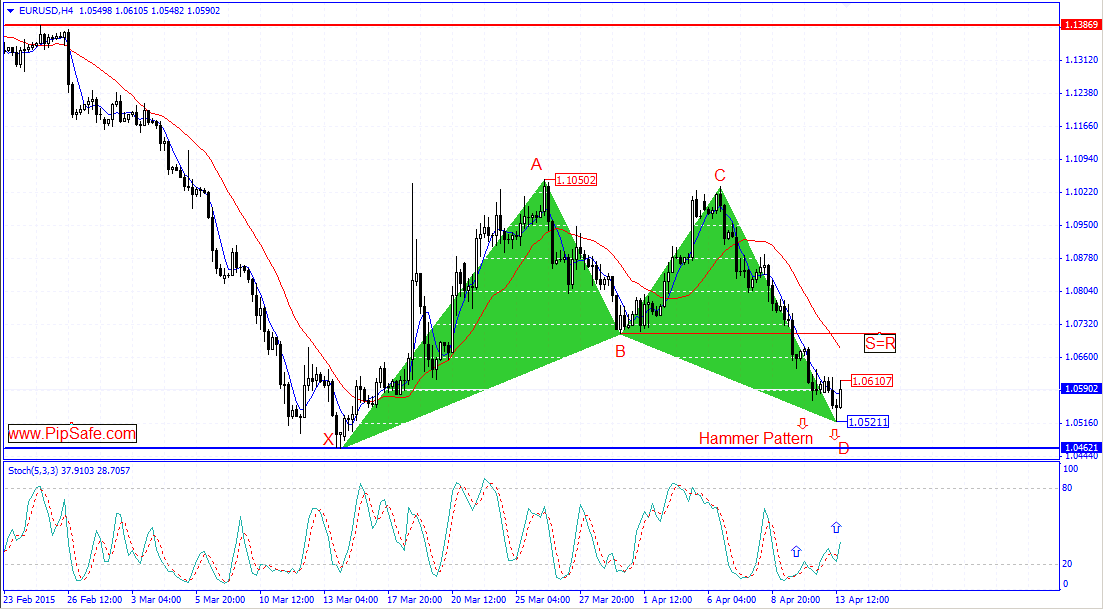
EUR/USD was in a strong and consistent downtrend during the recent days that Sellers were successful in obtaining the lowest price of 1.04621. Currently price in monthly,weekly and daily time frames is under 5-day moving average that shows descending of price during the net candles.As it is obvious in the picture below, there is a Bat Harmonic price pattern between the top price of 1.10502 and the bottom price of 1.05211 that there is a potential for ceasing of price from D point of this pattern.RSI indicator is in saturation sell area and divergence mode with the price chart that confirms the current bottom price and warns about ascending of price during the next candles.
In H4 time frame in the previous candle, the h4 candle appeared as a Hammer candlestick pattern (to notice this candlestick pattern, there is a need to a ascending candle as confirmation) that shows the possibility for formation of a bottom price and ending down the descending of the price).The best sign of ending the descending trend is the formation of the bottom price in daily time frame and fixing of it.
Currently uptrend should end around 1.0693 - 1.0734 area. A correction down to below 1.0603 is expected. A rise above 1.0783 will abort the expected correction.
While below 1.0833 - 1.0866 it is more likely to fall further towards 1.0777 or 1.0753. Premature rise above 1.0866 could see it rising above 1.0914 zone.
EURUSD daily touches 50 ema today with confluence of strong resistance zone. I think it is nice place to short with stop loss 50 pips and tp 100 pips. Entry should be with 1.1030-50 area.
EUR/USD outlook largely depends on the price action in EUR/GBP. The pair has attracted sellers around 1.11 level previously. Although the price action suggests further downside ahead, exhaustion is seen in selling. GBP/USD is expected to head lower, and hence some upside towards 1.10 or consolidation at current levels might be seen in EUR/USD. Failing to hold the support zone might lead to a move lower towards 1.05.