Hello guys!
Correlated? Any views on either of them? Except for Usd/Jpy, they all seem to be hitting some recent resistance levels soon?
Cheers, GN!
Hello guys!
Correlated? Any views on either of them? Except for Usd/Jpy, they all seem to be hitting some recent resistance levels soon?
Cheers, GN!
Now I starting to freak out
I see I am not the only one who uses FX Solutions
I like it great looking setup in the works
I’m don’t sure perhaps entry depending on the close price (BEUB)
tp put in support .
We have same stop loss :haha:
i dont think put stoploss on midle ressitance is a good idea.
Give me some new idea . I really don’t know how to stop loss with PA . I usually stop loss high or low of previous bar 5pips
The earlier trades some members have taken on the EUR/USD were not correct in my opinion. You don’t just trade a Doji ( pin bar ) because it appears, it displays nothing more than in decision in that time frame. A Doji after a rally back towards a previous support or resistance would be a far higher probability trade. If you look at the EUR/USD over recent periods although it’s edging down it is mostly consolidating as it needs some news to get momentum going, like this mornings. If you wish to sell the EUR/USD be patient, watch the pair rally, look for some previous support or resistance, followed by a reversal candle pattern them take you trade.
I took the eur/usd trade because there was a pin bar into a resistance in a downtrend.
There were a few trades like that. I got stomped on all of them
Pinbars within a range a very risky play…
Post your chart and draw range you say  please . I don’t understand so much when you say.
Are you guys on a short order already?
We’ve been stop out! good lesson. Every trade is a new learning!
@Maxryan,
Im sorry Im on an Ipad and cannot post charts at the moment. What I will say is if you zoom out on your chart (4hr ) and draw a horizontal line at 12800 you will see that price action has touched there on a number of previous occassions and the level has been respected. The more times and the more times in history a level has been respected it holds greater weight! The 12800 level is also 38.2% retracement of the down move on the 4hr chart so I would look for a reversal candle such as a big pinbar or a bearish engulfing pattern to short the market. This would seem a more suitable area to short the market… IF price action suggests a reversal is likely. The truth is you have lost todays trade only because of woes about the US economy and not so much for a technical reason. But i would only say trade a pinbar that is not at a price extreme with a great deal of caution.
Now, so I am not seeming like a no it all critic… Take a look at the 4hr chart on the EUR/GBP. the 8060 level is a 50% retracement from the swing low. There is a down sloping channel that price action is being rejected at now. From price action alone we are entering a zone of support and resistance and the candles are starting to show wicks, which indicates an early sign of a change in momentum. Now I am mostly a candlestick/price action trader but when a number of things come together they dictate my risk level in a trade. I am now looking for a pinbar/ 3 candlestick pattern or bearish engulfing pattern to form and I will start scaling into a short position.
Personally, I would set SL a couple of pips above the resistance. Did you put it a little above the current price or?
i usually put stoploss over PB some pips too, but the difference is only when PB touch the R/S and turn back, in this way the stoploss will over R/S level a little. i think you can see it clearly on post# 5040 by Dudest. its exactly what we are waiting. if the PA do not happen in R/S. just skip it, and wait for other chance. i try to get only the A+++ trade. hunting or to be hunted? its not too far.
And this is why we should never trade H4 
I personally find the 4hr chart very rewarding, although waiting for a setup can be tedious and you have to be rigid in trading discipline and patterns… I think the biggest problem, which is often highlighted is a lack of consideration of fundamental events when taking a trade off any chart less than daily!
There seems to be a few more up again, one of them on eur/usd 4h
beeb on aud/jpy also
got a lot more quiet in here.
I’m guessing quite a few got burned on that last one?
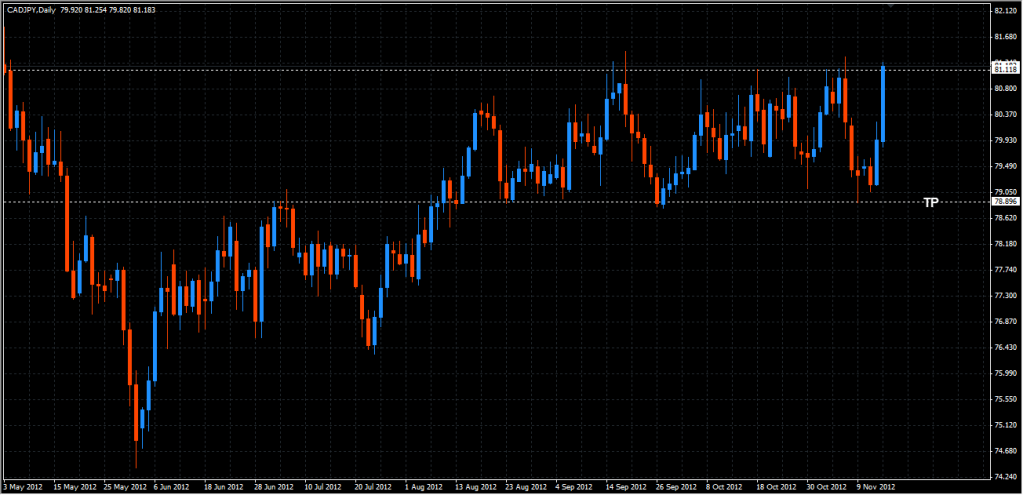
Still holding my breath on the cad/jpy. Which path will it choose? :33: