Hallo str8,
You’ve already said it…
Your subconscious is pointing out doubts, but your conscious mind is trying to rationalize…
Hallo str8,
You’ve already said it…
Your subconscious is pointing out doubts, but your conscious mind is trying to rationalize…
HI everyone
I just came accross a chart and a question hit my head. I would appreciate if juniors could solve this problem for me. Below I have attached a chart of GBPAUD Daily . As you can see we had remarkable Bearish Engulfing bar exactly on a good Resistance
But the price went down!!! although it still has time to play out but my question was:
it was due to the small FSA and chubby market which price had to cross ???
I also have another question which is irrevelant to the above one. 
Can we use Daily Pivot S/R also as key levels for PA signals??? I personally have seen many times market respects these level as key S/R area???
Looking forward to hearing from you.
Hossein
Sorry Correction:
[B][I]But the Price went up!!![/I][/B]
hi friend…nice question…yesterday we have discussed the FSA and FRA and VBRN and BRN…
see ur picture…i feel that the price is stuck in the tight range…and as u said…FSA(not exactly FSA but it give more meaning if we call that as a immediate support) is very near…
for 2nd question that is depends on u. i personally not use them.but i will look at them some times. thats it.thank u.
Thank you so much for you answer fxsrikanth . I think I got it 
OK, my opinion about 3 charts:
GBP/AUD
We have down trend, I drawn trend line from weekly chart ( the red line), also S&R on daily- 1.52705
So I think we have 2 possible price actions:
1- PA signal and go short below the S&R line
2- Price go above the S&R line then wait for pullback and PA signal to go long (target around 1.55950)
USD/JPY Weekly
Hire I marked 2 S&R lines at 94.627 and 88.259 also marked 50.0 fibo which is on signifying point
So hire we have 3 potentioal price actions:
1- price go above upper S&R and we wait for pullback and PA signal to go long
2- price go down to bottom S&R and if we have PA signal then go long
3- price go down to 50.0 Fibo (big correction) then wait PA signal and again- long
EUR/GBP Mountly
Down trend, I drawn trend line on mountly and one S&R (0.85324) on weekly chart.
Two possibles:
1- Price go above this trend line and wait for pullback to go long
2- If price go below that S&R line wait for pullback to go short
Hi everyone) Yesterday i was reading the articles about the trading psychology.In one article the writer said “you can have a trading system which will work for you for weeks.months or even years but one day it will stop working for you because the market is consistently changing and in order to survive longer term you must have to learn other trading systems even if you own the perfect working system”.That guy was willing to bet his gold plated rolex watch for his statement).Well i agree with him because i have been through what he said i was using RSI(14) indicator on a 15 minute chart .For almost two weeks it worked perfectly but a week later when market volatality changed it blew my account straight away by loosing a trade after another.Mr writer was right if he was talking about such systems.But as a new bie learning PA even with a little or no expereince i can prove him wrong because i can see a strong logic.If the market changes the PA trader will change according to it.At the end it is all about the price over time.If we can read the price story we can read the changing market which the systems based on indicators can,t because what they signal is based on previous data.If you master this PA you have no need to add more arms in your trading arsenal.
Thanks.
Tahir.
I lost when Buy EU with BEEB . Something wrong ? help me
Heads up everyone.Below is the 4 hour chart of NZDUSD.Currently the price is ranging at the moment.As we can see previously price respected twice the highlighted area and closed above the BRN 0.8300.Again at the support if some strong bullish PA close above the BRN 0.8300 then we will have a nice long entry.The RR ratio also seems good for this setup.The FRA is at 0.8390 and the final take profit area looks valid at 0.8445.On the daily chart we can also see the old resistance becomming new support once but we have a overhead traffic that,s why i am only posting a 4 hour chart.So guys what do you think about this setup? Is it worth waiting for the PA signal to happen?
After this selling, i would rather wait if the price breaks through the support and I will look for short.
I think its becouse we have today еconomic news by Mario Draghi… This is where fundametal analysis its come :33:
Hi guys, is it right to go long if this bar closed above the Fibonacci level ? Tp at 78.20.
Thanks
Gehad
Hallo dudest,
I have doubts because I think I try to find excuses every time to don’t take the trade.
For instance this setup:
I saw this setup but I didn’t take it because I thought the space between the low of BEEB and the FSA is too small.
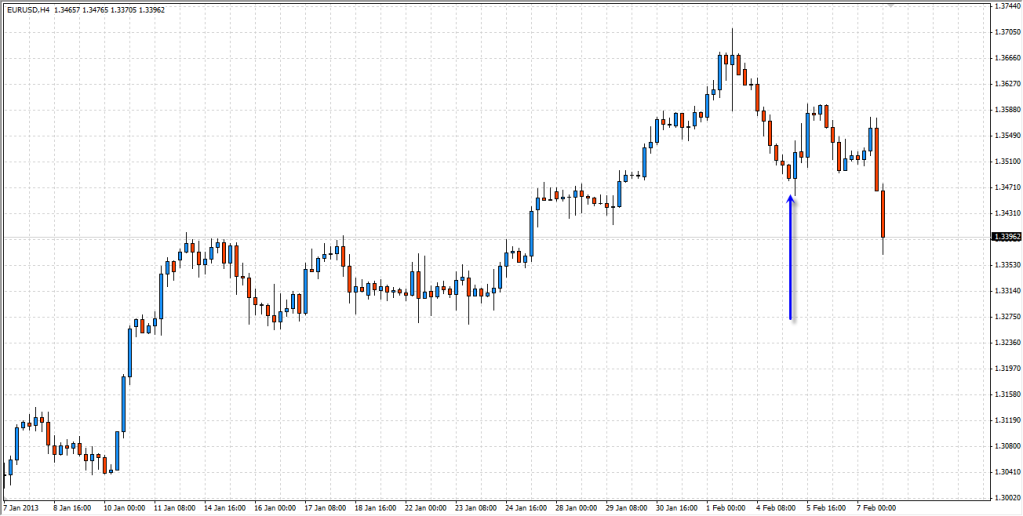
2 days ago there was also a BUEB on EUR USD 4hr and a trouble area. I don’t understand why that trade should not be taken and why the AUD NZD should have been taken given the fact it also had a trouble area. Maybe the FSA from AUD NZD was not too important and the FRA from EUR USD was more important? But how do I recognize which FSA/FRA are important?
Hey guys here is daily EUR/NZD…nice size pin bar of resistance…if the low of the pin is taken out i will short this pair.
Can you load chart again? What beeb are you talking about? I can’t see one on daily eurusd.
I took a short on the EURJPY yesterday by looking at the W1 and H4 charts.
Am I jumping between time frames too much or was this a good trade?
Spotted resistance and trend on weekly chart:
Took the trade on the break of BEEB on H4 chart:
on the weekly chart actually price got Higher high and for me, it’s not a retracement anymore, seems like a reversal.
EURJPY has been in a very strong uptrend movement.
EJ
Sorry i’m say about BUEB (not BEEB) on EUR/USD in H4 . I hit Stop Loss but i don’t know why ? Please help 
anyway good trade but outside bar must be close bullish . almost see the daily chart eur/usd has been retracing ,but mario played the game in either way …


