Thanks Dipak!
Looking good dudest. Looks like they’re turning before hitting resistance though. Oh well it happens more often than not. Here’s what I have my eye on for the next few hours.
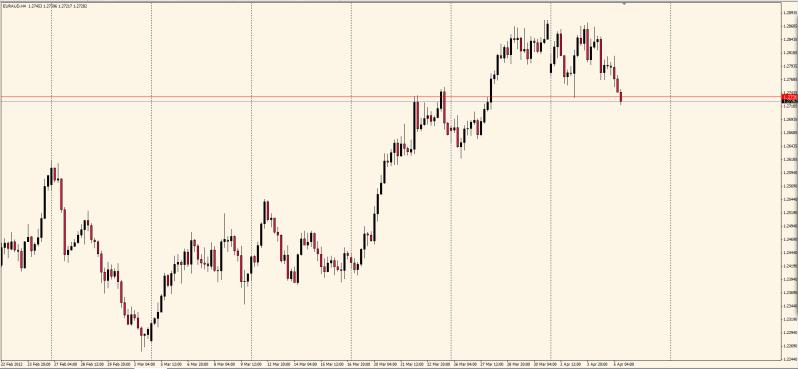
EURAUD
Seems like you guys like the 4H like me. :59:
I just wish I had more time, seem to be missing too many trades. I guess its time to resign. lol
Where are you guys from? Im in Cape Town South Africa.
1 Like
nice thread,big help for newbie 
resign?u manage to make bigger profit from u salary?
Any thoughts on the 4hr pin just formed at daily support?
On what pair?
Hello,
if you go to the daily chart you will notice a very clear support level comes in a little lower than you have highlighted. This support is also the 50% fibo area and an excellent area to get long should PA present.
I will cover more tomorrow.
Johnathon
Sorry guys gbpjpy
Hi dudest !
I actually took that trade and get stopped out on BE with 28 pips of nice profit !
I am Interested to see Johnathon’s or Bryce’s thinking on that BEEB…
Here how it looks now…

seriously does englufing,pin bar working in h1 timeframe?
so far i make 10 trade with h4 timefram and got 9 profit trade.
any idea with h1 time frame?
Hi.
I think the most reliable timeframs is the 4h and daily charts.
But sometimes i like to use 15min charts
Hi.
I’m reading this thread since the begining.
How can i know if my charts are on New york close or how can i setup the charts to new york close?
Sorry, i only see the answer to my question now.
But how can i now if my broker use new york close charts?
I use Oanda with metatrader4 plataform
Either ask oanda or compare your charts to the ones posted here

Nicely market levels, now just look for PA there.
Simple as pie!!!
Ok 1st time poster here so take it easy:) On the AUD/CHF that looks like a clear beeb, formed at previous S/R, in the direction of the trend and now a break lower than the close of that beeb, so we should be in that trade now with target around the top of the right hand ‘S’ that you have put on there and 2nd target a little higher that the ‘H’ (I hope that makes sense)…
If im off the mark would welcome feedback
My take on Eur/Aud. Zooming out on the daily I see that price was rejected at previous support (and now resistance?) [red line]

Was looking to got short in that region but did not get a good price action trigger to go short. I’m looking for a break and retest in support and the trendline [blue lines] before looking to go short.

If there is a bullish signal off of the previous resistance would you take a long? I can see that if we were looking for a short then we need to wait for price to break the recent resistance and then retest, but im confused as to how to identify which trend to favour. Longer term is a clear down trend but since the end of Jan there is a nice up trend and a clear area for strong PA to signal a long…