Go IronHeart!
cheers 
Go IronHeart!
cheers
A brave thing you’re doing here. After doing this a long time, I still make mistakes I’d be embarrassed to tell anyone about:o
I see a trade of this type almost every day. I haven’t had any luck at all entering this class of trades, counter trend, in the middle of a bb walk, with strong mid band trendline (less than 2 o’clock up or more than 4 o’clock down) against the trade. This trade is taken in what we used to call a “no trade zone”. My rule is don’t take these trades long if the midband is trending down steeper than 4 o’clock. If you can’t tell easily if it is or isn’t steeper then 4 o’clock, then don’t take the trade. You might want to look at several of these cases and see if that rule makes sense for your method 
Great wisdom Graviton. Thanks for looking over my shoulder.
That 2 and 4 o’clock idea sure is a good one, I will definitely look into it more.
IronHeart, I’m throroughly enjoying following your journal. As a newbie, it’s great to see that there are so many different strategies and systems that people use to obtain profits and also just to see exactly where your entering, what your R:R ratio is etc. I’m finding it very helpful as I venture through the demo-trading process before going live.
I’ll definitely be following this journal of yours and I wish you the best of (seemingly not needed) luck with your trading!
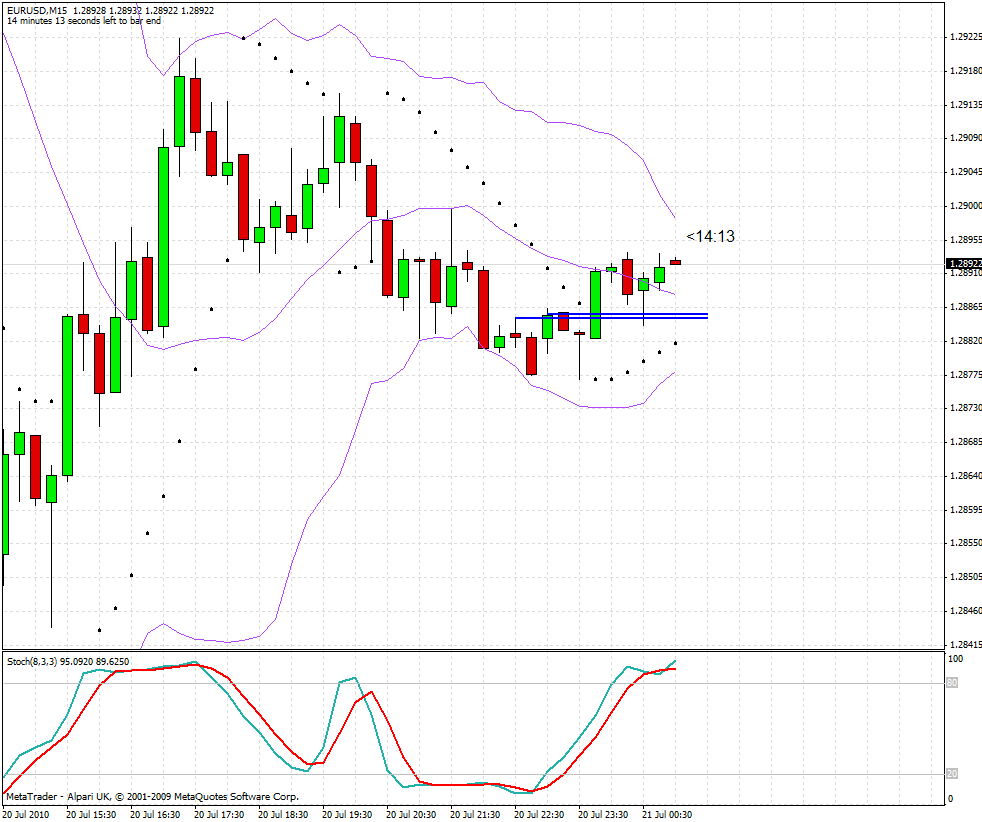
Trade 6
EURUSD 20/07/2010 / 22:15 GMT
Counter trend - Long Trade
Here is the 4H time frame
It was unfortunate I missed that huge red candle that went real close to the lower band. Normally, I would have taken that trade.
I took the next one instead, the final bar on the chart.
Note: please ignore the blue writing on this chart, these are just notes from my backtesting.
15M chart
Two blue lines here, the bottom one is the CBL and the top one is the entry. Entry is close to the CBL because of faint breach by the entry candle.
The break even was set when R:R went up to 0.5, which was hit to get me out of this trade.
Trade Statistics
Risk = 9 pips
Reward = 0 pips
R/R = 0.00
Max profit available = 8 pips (before break even)
Max R/R = 0.89
Trade Efficiency = 0.00%
End Result
+0.0%
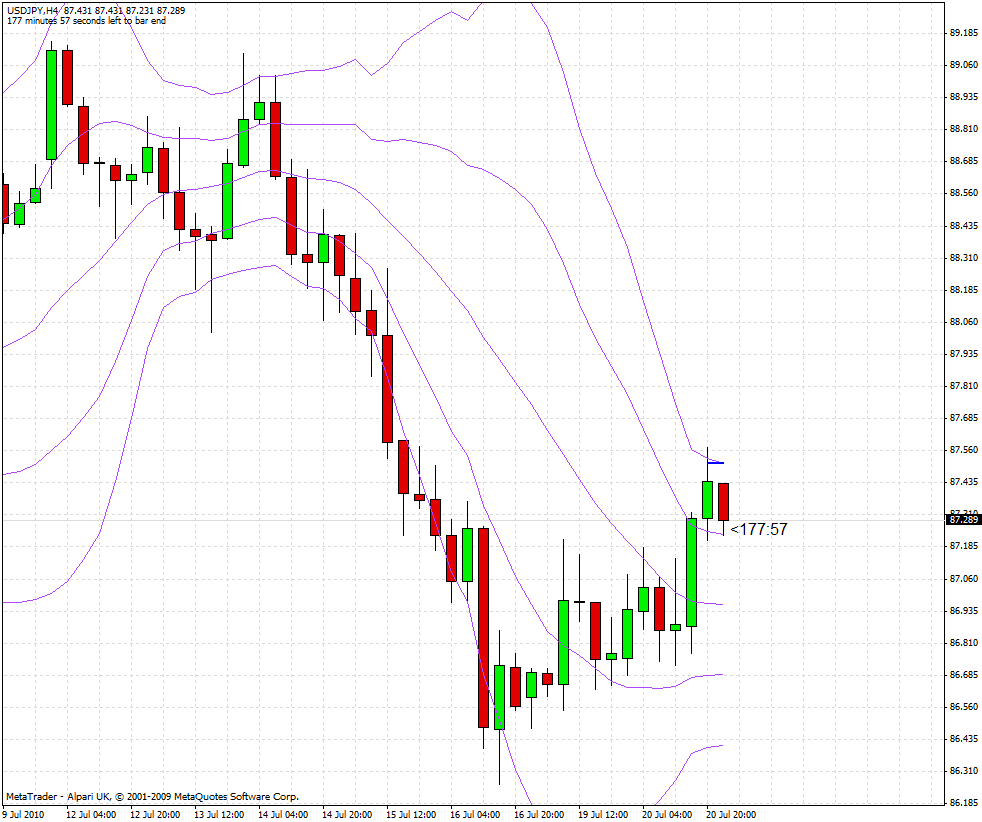
Trade 7
USDJPY 20/07/2010 / 22:05 GMT
Counter trend - Short Trade
Here is the 4H time frame
Straight forward trade here, price breaches upper band, entry is sought…
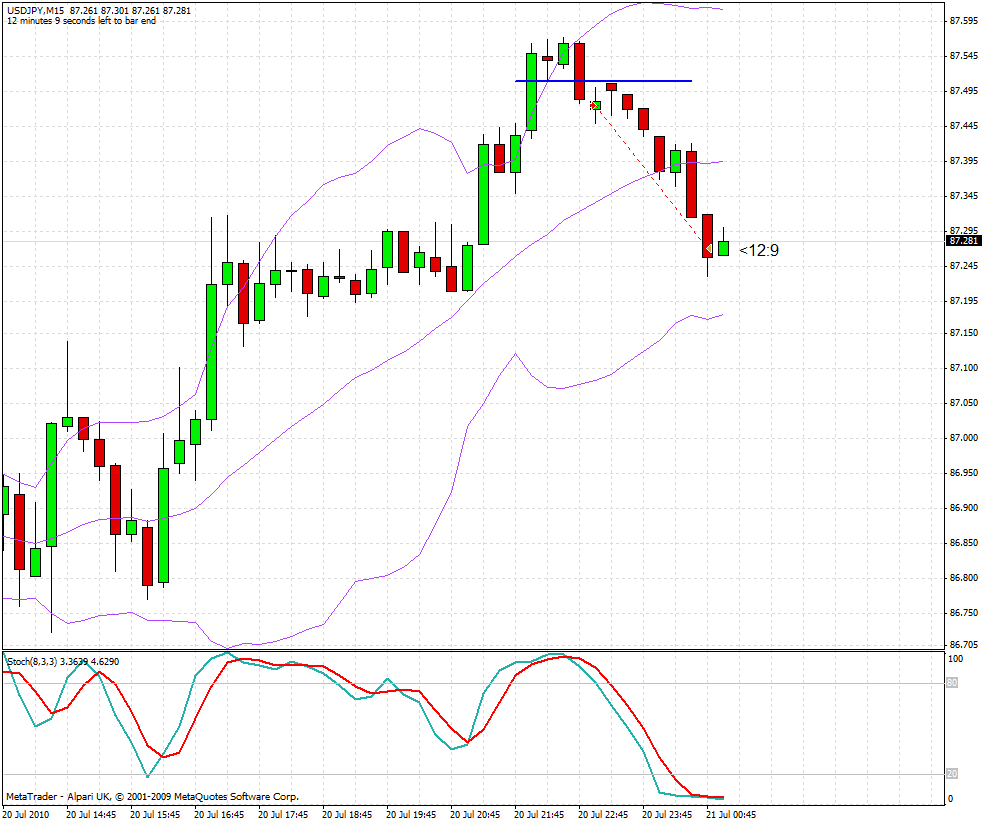
15M chart
The blue line is the CBL here and the trade itself is shown by the arrows. Entry was at top arrow and exit was at bottom arrow.
Trade Statistics
Risk = 10 pips
Reward = 20.4 pips
R/R = 2.04
Max profit available = 61 pips
Max R/R = 6.1
Trade Efficiency = 33.4%
Max profit calculation takes into account maximum profit size before a major retracement.
End Result
+4.08%
Trade 8
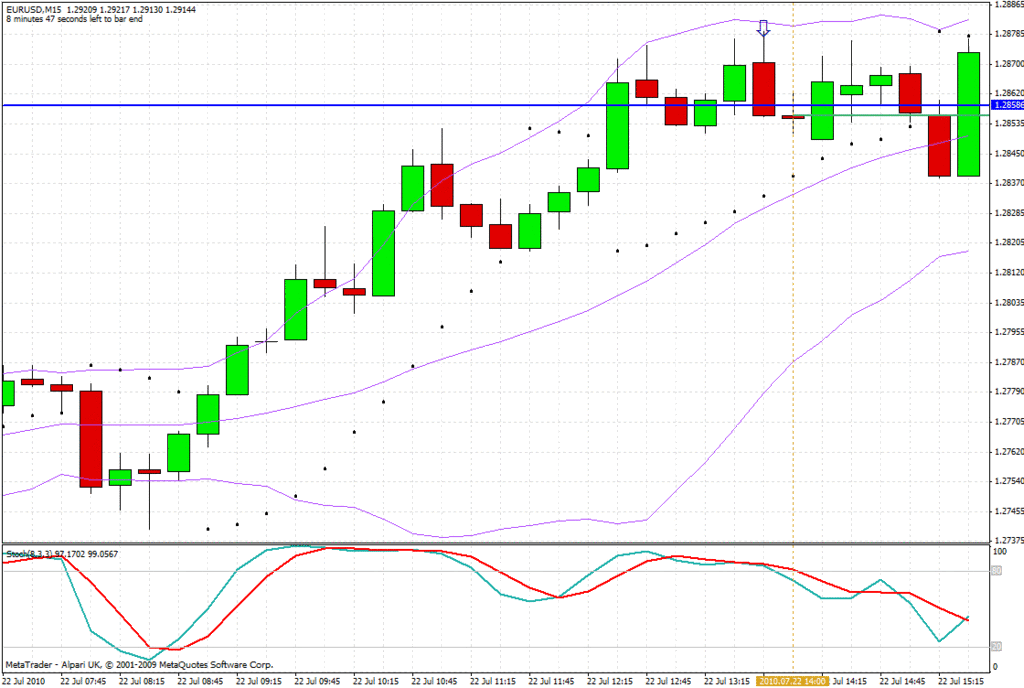
EURUSD 22/07/2010 / 13:00 GMT
With trend - ShortTrade
Here is the 4H time frame
Price enters retracement zone (BB with Std = 1.0) and hits the mid-band.
The retracement following on from the down sloping mid-BB hit gave a CBL entry on the 15M chart, as below…
15M chart
Notice the red candle with the arrow on top of it - this candle closes below the CBL, with confirmation from the stochastic.
The CBL is the blue line and my entry is on the green line.
Unfortunately, this trade breaks even.
Trade Statistics
Risk = 25 pips
Reward = 0 pips
R/R = 0
Max profit available = 17 pips
Max R/R = 0.71
Trade Efficiency = 0.00%
End Result
+0.0%
Trade 9
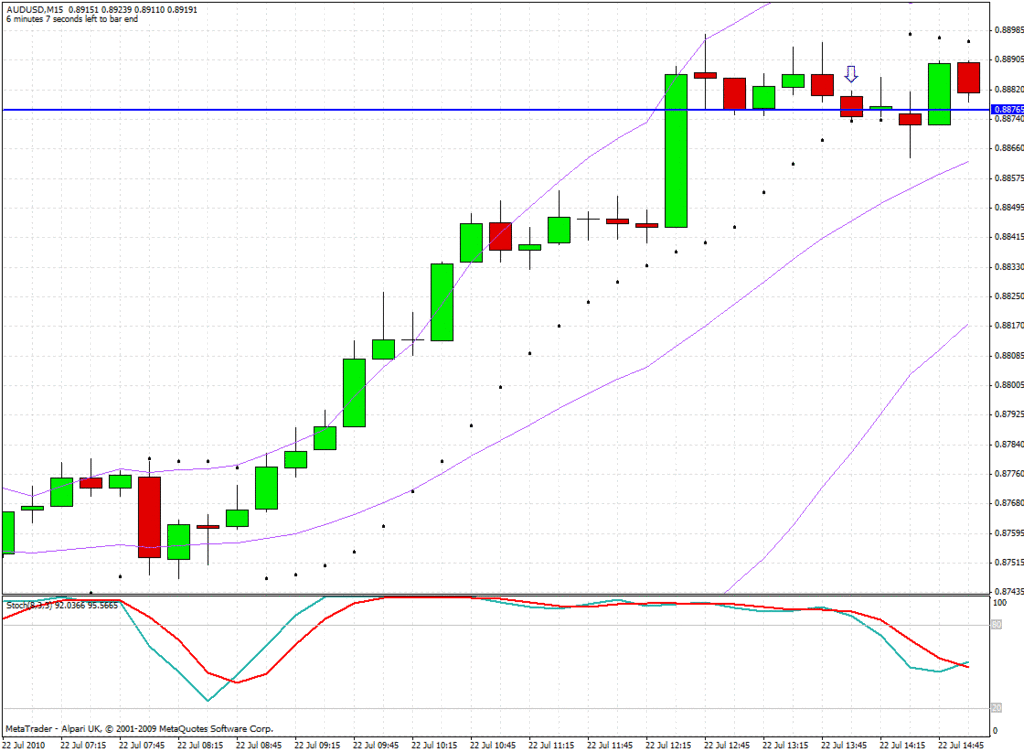
AUDUSD 22/07/2010 / 13:15 GMT
Counter trend - Short Trade
Here is the 4H time frame
Price hits the upper band with the opposite BB in contraction mode. Let’s take our 15M ruler out…
15M chart
Notice the red candle with the arrow on top closes below the CBL alongside a bearish stochastic. This gives the entry signal, which also turns out to be on the blue line.
Unfortunately, this trade also breaks even.
Trade Statistics
Risk = 24 pips
Reward = 0 pips
R/R = 0.00
Max profit available = 13 pips
Max R/R = 0.54
Trade Efficiency = 0.00%
End Result
+0.0%
Trade 10
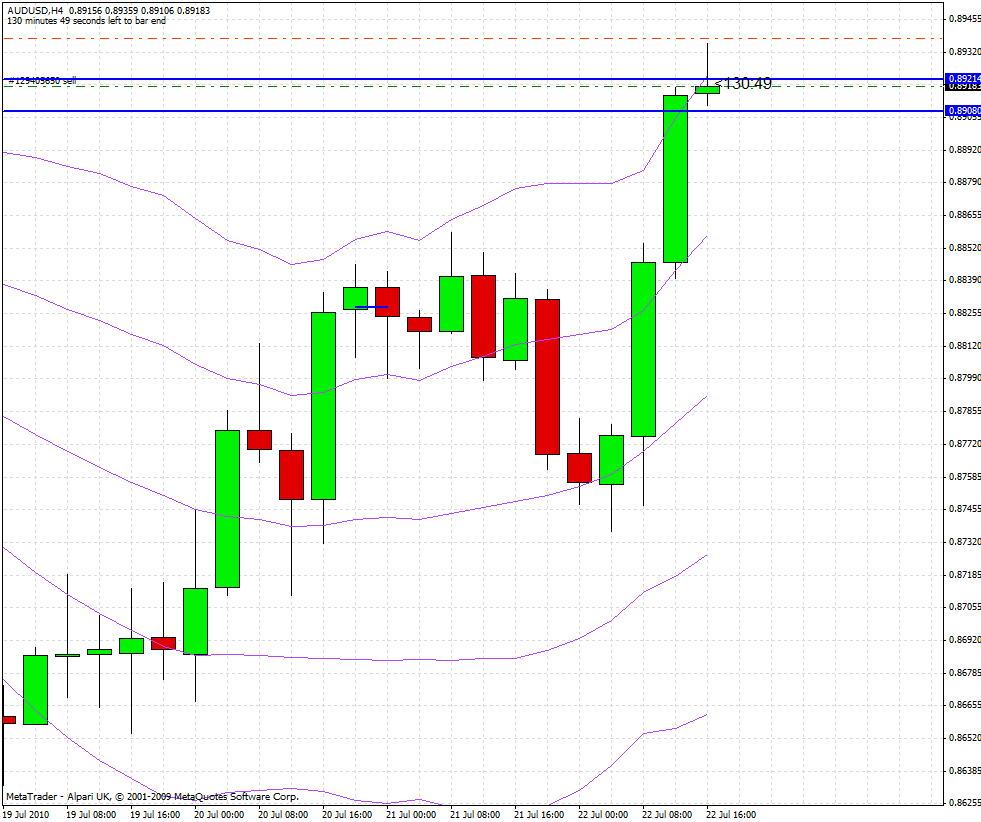
AUDUSD 22/07/2010 / 16:45 GMT
Counter trend - Short Trade
Here is the 4H time frame
Price had pierced above the upper-BB, which is in a notable contraction. This is a sausage, and I’m anticipating price to go lower after hitting the upper-BB.
15M chart
The blue line here is the 2CBL and green is where I entered this trade.
Price action normally goes in my favour for a while before retracing, especially if it closes below the CBL with confirmation from the stochastic - but on this occasion, it just flew right back up!
Trade Statistics
Risk = 20 pips
Reward = 0 pips
R/R = 0.00
Max profit available = 3 pips
Max R/R = 0.15
Trade Efficiency = 0.00%
End Result
-2.0%
[U][B]Week 3 Results[/B][/U]
The week ended with 1 winners, 1 loss and 3 break evens.
By risking 2% per trade, the account has grown by…drumroll
[B]+2.0%[/B]
Total Account growth since inception
[B]+9.98%[/B]
IH, getting 10% in three weeks of trading is a great start! You should be able to get 6 to 8 good trades a week using this method, though I guess some will show up on the 30M or 1H TF, depending on how much time you have to put into trading.
I don’t want to seem overly critical, but I’ll offer my opinion for what it’s worth. This trade appears to be against the trend of the 15M chart and against the Longer TF 4H trend as well. That’s a tall hill to climb. I would not be able to take this trade per my trading rules. The trade is also taken in what Tymen refers to as a “no-trade zone”, or a BB walk up, rather than out of a squeeze. These BB walks will do this many times, retrace a little only to continue the walk up. I will sometimes use these short retracements to enter an existing BB walk occurring on a higher TF, but since there will be many small retracements and only one, the last one, really will turn out to be a reversal of trend, the odds are heavily stacked against you on entering these trades against a BB walk. So more often than not, even using a good entry technique as you are, these types of trades just have too much stacked against them to be successful, at least in most cases.
But since you have made about 10% in three weeks, you are doing better than 95% of Forex traders. If that compounds over a year, with minimal drawdowns, the results would be fantastic. So in my opinion, any changes should be very carefully considered and evolutionary rather than revolutionary. That’s just my two cents worth. Happy Trading!
Hi Graviton, I really appreciate your analysis. Thanks for your continued support.
What you say is completely true and I completely agree that this trade was very risky.
Just looking back, though, it seems some of my trades take place during these no trade zones. My testing has shown great potential in these types of trades but I think it may be worthwhile to conduct a study that compares the relative benefit against the risk of these no-trade zones.
The results of that study will facilitate an informed decision about how to proceed with this trading plan in the future - an evolutionary change will certainly be in the books as I grow more experienced!
As always, thanks for stopping by and hope to see you soon!
Hi iron heart! Great to see you having a journal keeping down your entries.
I want you to know that it greatly benefits new traders like me as.
Keep up the good work and i hope more pips come your way soon!
Hi fartist, I’m glad this thread is benefiting others as well as me.
Good luck in your trading.
[B][U]Update[/U][/B]
Inspired by Graviton, I have been tracking the drawdown % of all my trades and looking at how different my cumulative % gain would be if the trade was closed at drawdown = 1% instead of waiting to lose the entire 2%.
With these 10 trades, had I chosen the 1% close-out route, the account would have been up 10.01%. I will re-evaluate my plan when I get to a higher number of trades and see where to go from there!
Heya [B]IronHeart![/B] I’m very pleased to see your success of 10% account growth in only three weeks! Your dedication is definitely paying dividends here! I am also looking forward to seeing the results of your statistical studies, as well as your future successes! Keep it up to motivate us all!
Happy pipping!
For IronHeart, TRIPLE A BAN HIP HIP HIP Hooray !!!
Bravo, really nice work, clear, clean and concise.
I think everyone will enjoy high quality thread is that no exception to the rule, and the way we have opened Tymen and Graviton.
Again, congratulations and thank you for this great job.
Regards, Didier.
Thanks for the encouragement guys. Great to see you here [B]Didier[/B], I hope you are well.
Without further ado, on to today’s trades!
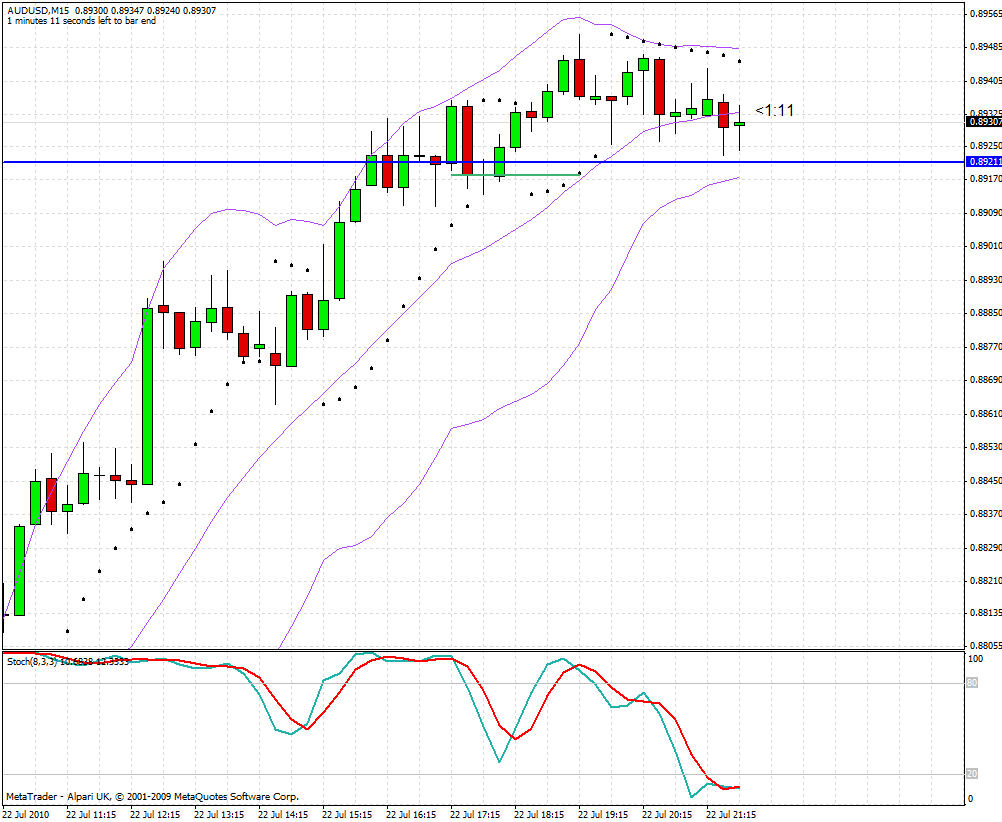
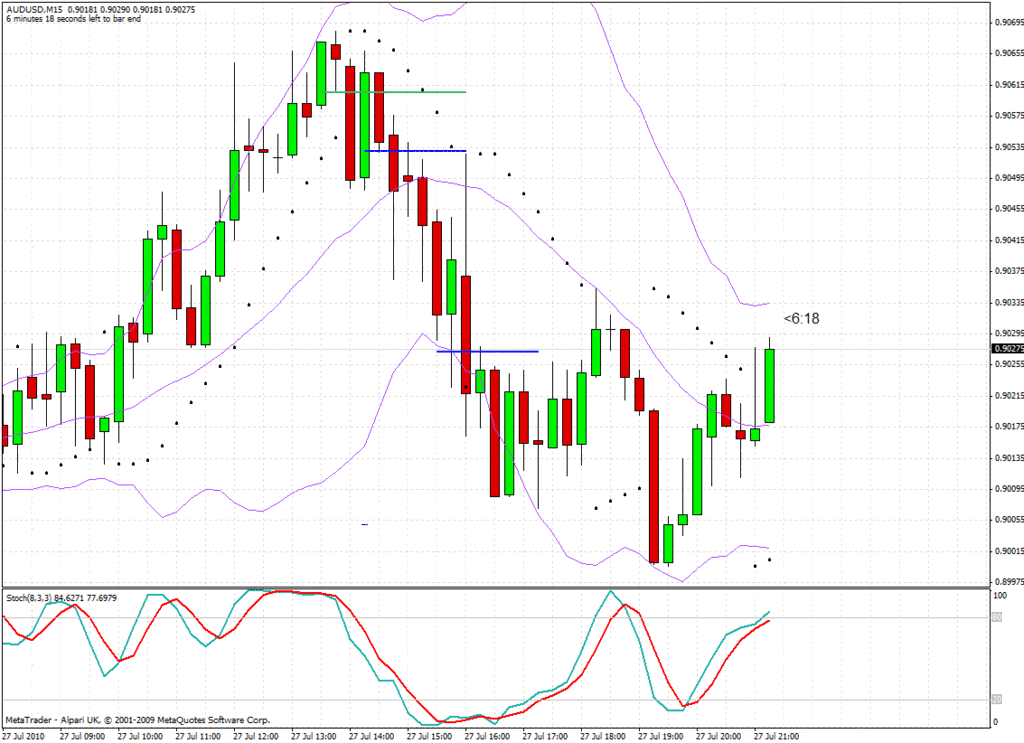
Trade 11
AUDUSD 27/07/2010 / 13:15 GMT
Counter trend - Short Trade
Here is the 4H time frame
Notice the arrow I have drawn on top part of this chart. This candle breaks through the upper-BB while the BB’s were in contraction mode.
The upper-BB has also inverted and is beginning to contract too! This is further confidence in taking the short trade.
15M chart
The green line at the top shows the CBL, the middle blue line is my entry and the bottom blue line is the exit, at the breach of the opposite BB. Good exit too! The next candle would have taken the trade out with a breakeven!
Trade Statistics
Risk = 17 pips
Reward = 25 pips
R/R = 1.47
Max profit available = 28 pips
Max R/R = 1.65
Trade Efficiency = 89.3%
End Result
+2.94%
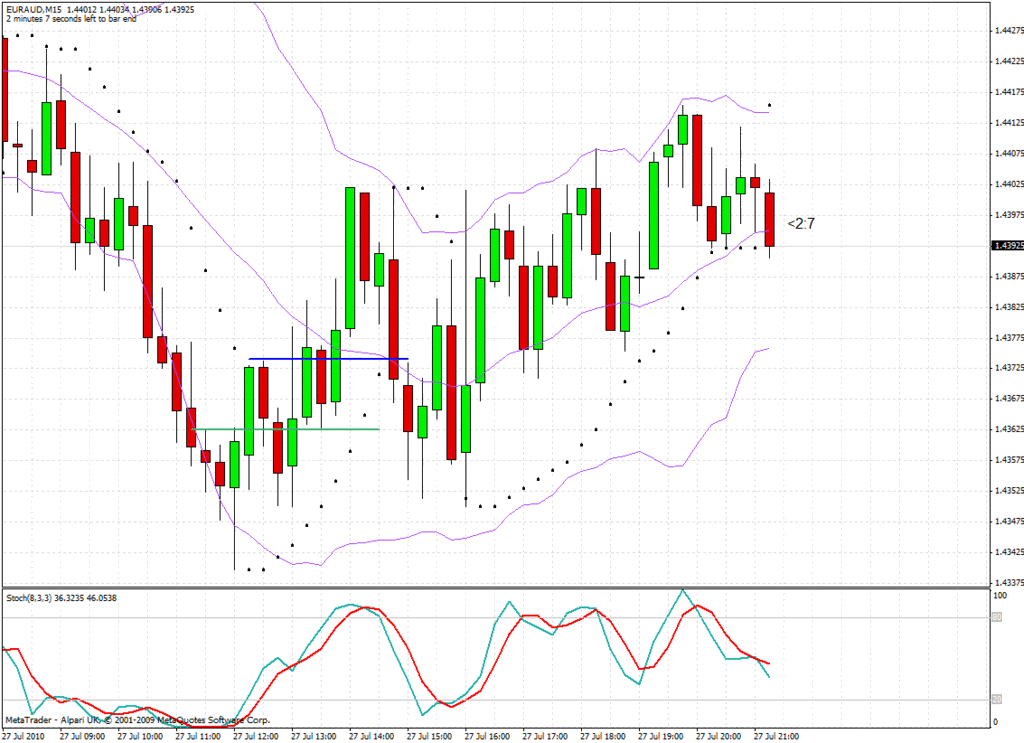
Trade 12
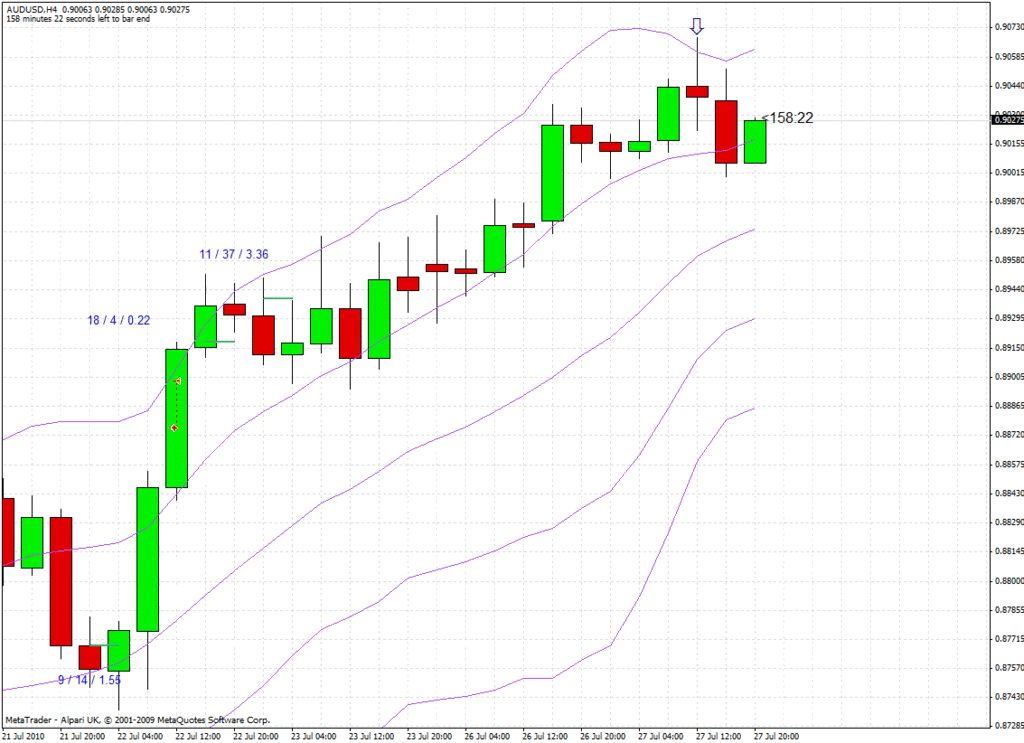
EURAUD 27/07/2010 / 12:30 GMT
Counter trend - Long Trade
Here is the 4H time frame
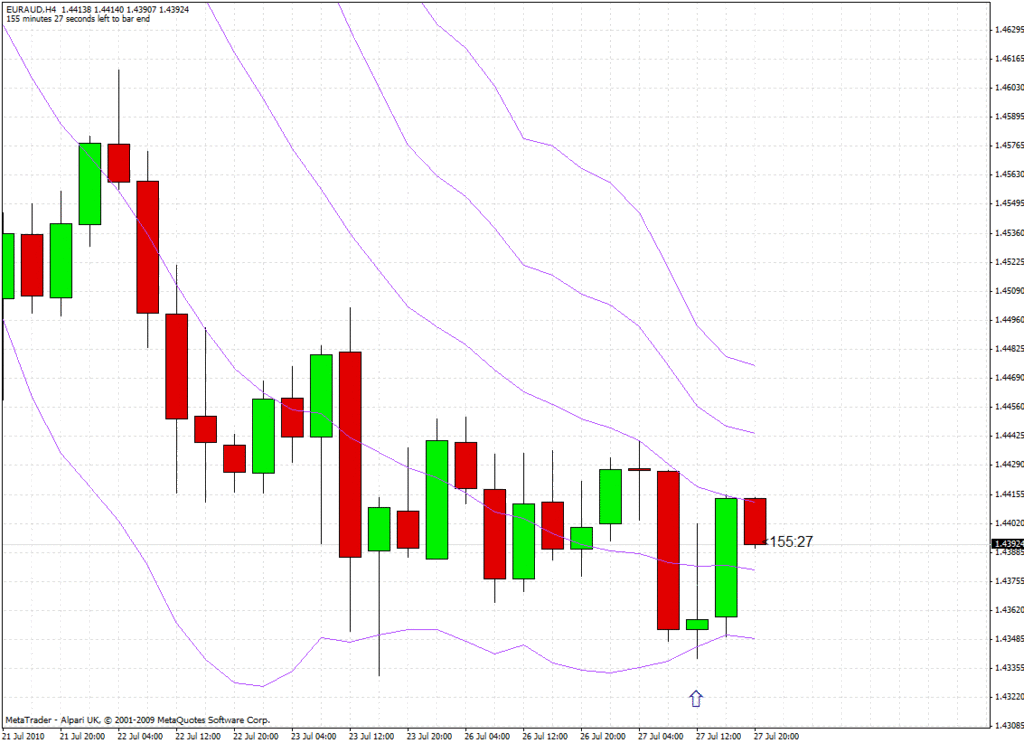
This trade was actually supposed to be trade 11 and not 12, ah well!
Same scenario as trade 11 except the other way around.
Price goes through bottom BB, with clear contraction in the bands, indicating possible sideways price action.
15M chart
Green line shows CBL line and blue shows entry into the trade. I was 5 seconds too late to get in 2 pips earlier!
Unfortunately, this trade broke even.
Trade Statistics
Risk = 38.5 pips
Reward = 0 pips
R/R = 0.00
Max profit available = 23 pips
Max R/R = 0.60
Trade Efficiency = 0.00%
End Result
+0.00%