it was uptrend until the crisis in 2008 now the price is moving down 
Yes, good observation. If you look at that same time frame in the weekly you can see more detail. You can see how it broke up about the begining of march and again just a week ago, but still making lower highs, so still in a very long down trend.
Now move out to the daily and zoom out to show just this year, you can see those bumps up clearly. The daily trend was down, but Friday we got an up candle, like it might be ready to break up, but overall that is sort of flat now, looking at the mid-bb.
Move to the 4H showing just this month, you see more detail of the down trend and this up kick at the end of last week.
Move to the 1 hour showing two or three days and you see a good detail of the retracement already well in progress.
If you look at the last hour candle you’ll see a little tick down. if you look at the 15 or 20 minute chart you can see some detail of that last minute turn down on Friday. Even more detail on the 5 minute chart. now look at the bollinger bands.
See the entry? Ha Ha, you are getting good if you do!
I must take a break now. I’ve been hard at it for 10 hours. I love this stuff, but I have a rule. Take care of your health. You can’t trade if you are dead.
I’ll be back in an hour or two.
Graviton, I am confused
PA (1h chart) didnt reach 1.3420 yet we cant consider it as uptrend. its still retracement?
I will post the charts
5M -eur/usd

1h eur-usd

the deep night is over here. I will in touch with you tomorrow when I wake up
thanks
I see the monthly has stopped at the 61.8% Fibo. of the 2 1/2 year up trend.
Weekly seems to be consolidating between the 50 and 61.8
Daily has a DBLHC.
H4 has a simple CBL entry at 1.3240.
H1 could have got us in the trade 10 pips sooner.
No Clear trades under the 1 Hour for Tymen’s method.
We would be up 135 pips now.
John
PTB, I will do my best to help any way I can. Consider yourself included. We are into the meat of this method already. With your background of having gone through Tymen’s thread, you are well prepared for this. My goal is to have anyone who has already read Tymen’s work ready to start demo trading this system next week, so you won’t have long to wait. From there on out it’s just practice. I’m glad you’re here. This should be fun.
Great to be here! Who said you can’t get the older generation excited?
Graviton, you have mentioned a few times of your teaching abilities. I for one think you are an exceptional teacher (with or without charts) and really,really appreciate your taking the time to help us learn. I have been away for a while but I have been through Tyman’s thread since the beginning and hope to contribute and participate soon.
Thanks for the kind words. Having been through Tymen’s thread, you are well prepared for this. Something wonderful is about to happen 
Sorry, I confused you. I didn’t have a chart up and was going off my faulty memory of Fridays late action. But, realizing when your confused will save you more money than anything I can teach you. The rule is, “If you are confused, sit this one out.” And that’s just what we will wind up doing. Let’s look at why.
You and other smart people saw the downtrends and consolidation mess above on the monthly and weekly (Good Job!). The Daily and 4H are mostly going flat. The 1H, 30M and 15M are in up trends. What a mess! We don’t trade messes.
The trend is our friend. The counter trend will kick our behinds in this system. We know we want to trade right around the 1H since we can grab lots of pips there. But we are flexible. We will trade what might turn into a multi day swing trade off the 4H if we can trade WITH the trend (but not on Friday!). But the 4H mid bb is downish and the price has broken above it. Conflicting information. Even worse, the daily above it is flat. Flat isn’t a trend, it some type of whipsaw generating consolidation mess. We don’t trade messes. And we don’t guess. The rule is, Never Guess. This isn’t a guessing game. So the 4H is out, for multiple reasons. If that’s not clear, I’ll be happy to answer questions on it.
The 1H, where we would really like to make a good day trade, is in an up trend, as are the 30M and 15M on my charts, and we might settle for a really sweet scalp of 15 or 30 minute, but we could only trade those up. What do the higher level charts say? Flat, Flat, downtrend consolidating mess, downtrend. I don’t think the higher level charts could say we don’t have a good trade with the trend any clearer. Again, I’m happy to answer any questions as to why.
OK, so we have no good trade under my system. Next we ask, what do we need to get a good trade? Well, the monthly and weekly won’t change quickly or at least not today, and tomorrow is another day. The 20 SMA mid BB of the daily may be headed for retracement up, but it’s not going to change quickly either.
But look more closely at the 4H. The previous candle was sort of bullish engulfing. A very bullish candle. The last two candles were up. The current candle has just crossed above a longterm trendline that was set back at the end of Nov and in Dec and January when longterm trend changed from up to down. But all of that is just confirming what we we can plainly see, the price has moved above the mid BB. If it keeps going, soon, very soon, we will have an up trend on the 4H. That could change today! Above the 4H is still a bit of a mess, but if the 4H turns to up trend, we can look again at trading the 1H, 30M or 15M up.
This is where you need to pull out your traders journal and make a note so you don’t forget things like I do sometimes. If the mid bb on 4H turns up, look again at 1H, 30M and 15M for trades.
What else could happen to give us a good trade WITH the trend? 
We could get a trade with the trend if 4H price reverses! The 4H trend is already a little down. If price reverses to down it could create a down candle for the new day and start to pull the daily mid bb down. H1 would have to go down for 4H to go down, and of course for H1 to go down M15 would go down first and then M30 would follow. So, we put another note in our traders journal, if price drops below 4H mid bb, check for down trades on M15, M30, 1H.
So in final analysis, getting a good trade with the trend on eurusd requires 4H to take off up or down. Flat won’t do it for us. We see a long wick on the current candle of 4H, it’s not far from the mid BB. It could happen. We now just have to wait.
There is nothing more we can do here. We can’t plan a trade until 4H moves. We move on the next pair.
Hard to believe all that analysis can be done in 5 to 10 minutes a pair, but after you do it several days in a row it gets repetitious.
1 Like
But look more closely at the 4H. The previous candle was sort of bullish engulfing. A very bullish candle. The last two candles were up. The current candle has just crossed above a longterm trendline that was set back at the end of Nov and in Dec and January when longterm trend changed from up to down. But all of that is just confirming what we we can plainly see, the price has moved above the mid BB. If it keeps going, soon, very soon, we will have an up trend on the 4H. That could change today! Above the 4H is still a bit of a mess, but if the 4H turns to up trend, we can look again at trading the 1H, 30M or 15M up.


2 Questions. Is the trendline I’ve drawn on the top chart what you are referring to in your post?
Explain from the chart the “previous candle that was bullish engulfing.” It looks like 5 uptrend candles.
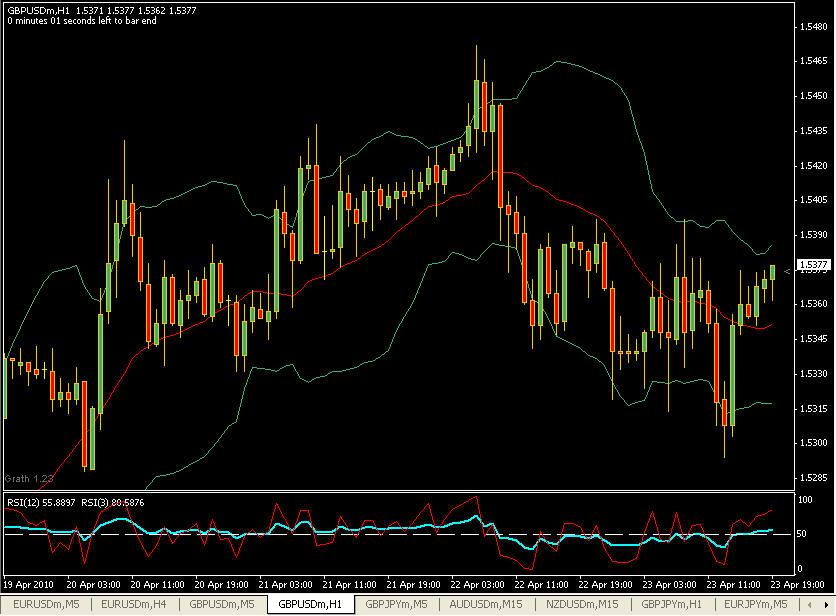
Let’s look at GPBUSD. Monthly has been in a strong down trend but is now retracing UP. Weekly same, retracing up. Daily Trend UP. Price action flattening out a bit, but still up overall. H4, trend flattened after a small retracement, but now price above mid bb. Nice bounce of the bottom BB. Promising. H1, Oh, looking good. Price driving solidly above mid bb. Top bb trumpeting open. Oh yea. You need to see what other people see on this one.
Set up an additional GPBUSD chart. put price, Bollinger bands, and a 12 period RSI with a little heavier line and on the same indicator window put a 3 period RSI with a thin line of a different color. See how the 12 period RSI is above the mid point. it says buy me. See how the 3 period RSI is well above the 12 period? It’s saying I’m not getting weaker any time soon. I always set up a separate screen so i can see what other traders are looking at. It doesn’t matter if I believe it is valid, I just need to know what they are seeing.
Going to 30M, all strong up. 15M, good up. It’s very clear we have good trends up here. Now we need to look for an entry. We want to enter on a retracement from the up trend and get the best price we can. Buy low sell high.
Going to 5 minute and 1 minute, breaking out high. We have potential trades, but not a good BB DNA entry on any TF that I see. But this one goes to the top of our watch list. Looking at the M5, the minimum needed for a good entry just because it’s not as jerky as the M1, we get a peak to valley cycle time of only about 1 hour.
We flag this one for entry and watch for a dip in price to at least give us an M5 entry. We’d like an M15 or better, but we’ll take what the market gives us. We’ll put this one up on the tick chart in the corner and look at it’s screen every 15 minutes or so. We will get an entry on this one. We just have to be patient.
Now to another.
1 Like
Yes, you are correct on the trendline. Good chart. I’m always looking for good trendlines, because other traders are and I want to see what they do. If it’s too much junk on your chart, just create another to throw the junk on. That’s what I do. Actually I have three for some pairs.
The candle thing is really weird. My brokers closing price is 1.3373 and yours is 1.3384. We are getting different candle formations which indicates maybe a slight difference in time base, and way different price. I’ve seen this happen before from different brokers who use different price feeds. 10 to 12 pips difference in price is not unusual around closing time. I wish someone would write a good arb program to close that up. They would make a fortune. But anyway, some strong up candles at that point. On open, either your price, or mine will jump to close that gap quickly.
You can see the routine now. Let’s look at USDJPY.
monthly, up, see the down trendline that runs from about July 2007 to Feb 2010? that was a long good trend It was just broken march of this year. I don’t know if we need to go further, or just skip to look for an entry
Just kidding, weekly, up: daily, up: H4, up. Starting to see a pattern here?
Sorry the eurusd was so messy and I chose that one first. This is usually more the way it goes with majors.
H1, up but nice pullback
30M, up, more pullback
15M, bingo. Houston we have liftoff.
You smart people can handle it from here. we’ll enter as soon as we get a breakout up on the 15M chart. this one gets 2 stars in the journal . Watch it close. don’t miss the entry.
Watch the 5M and even the 1M. That’s where the breakout originates. Well, really it originates on the tick chart and moves up the time frames. You’ll be able to see it coming. You could probably take a BB DNA entry off the 5M and make an extra few pips. Your choice. See what I’m doing here, sliding up and down time frames?
So we have a really pretty picture in our heads about what is going to happen here.
If the picture doesn’t come true, we toss it like yesterday’s rubbish and start to paint another.
OK, you’re closer than you’ve ever been. You understand multi-time frame trend analysis now. See, that wasn’t so painful, now was it?
Assignment: complete a multi time frame trend analysis for 10 of your favorite pairs. You can include the three I’ve done, as part of that 10 if you like. We will review later. Feel free to cheat off each other