On the 1 hour GBP/USD chart, could you clarify whether you draw your trend lines from the shadows or from the close of the candle? I can see some are on the shadows but the parallel line that creates the channel is on the close of the candle. My understanding is that the parallel line of the channel should be drawn where it touches the most recent peak or valley. I interpret this to be the shadow as well. Now when I look at your last down channel it is not very clear to me (although this could an optical error from my side) whether that is the case.
The idea would be that the price will fluctuate in the channel (support & resistance) so depending on the depth of the channel you can get in and get out buying and selling). Since the depth of the channel depends on both parallel lines drawn pretty reasonably well, I would like your opinion on this.
thats a great question , some people like to draw trendlines ,support and ressistance from the shadows and others like to draw from the close, but I look at it as zones or areas that price could break or change its direction , so any line on my chart represents the zone around that line , I hope that this answer your question , if not please , let me know and good luck to you
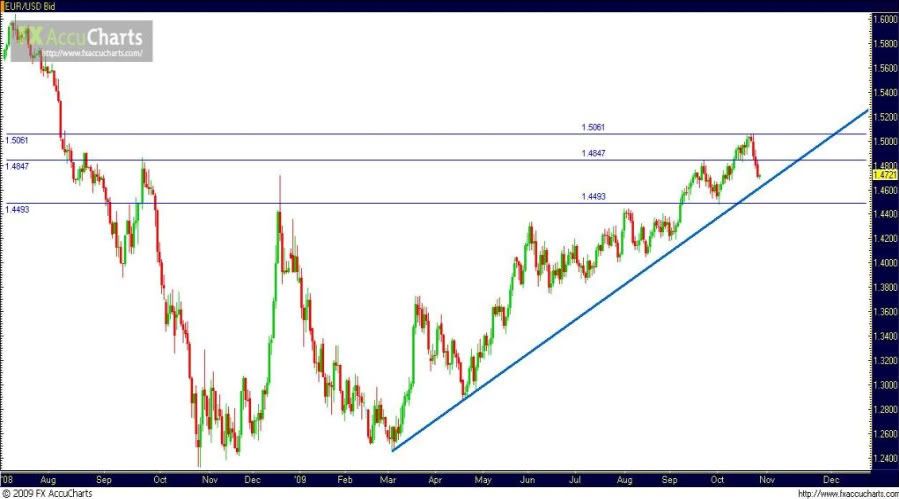
Check this daily chart of EUR/USD. See the end of Wave 5 and start of corrective Wave A. Still way to go. Also RSI is telling that it has a bit to go before hitting the 48.24…% line. Have collected many pips yesterday and the day before. Still on a bearish trend.
I know you are a master of trend lines. I have attached a 4 hour chart of EUR/USD. You can see the waves 1-5 of Elliot Waves followed by corrective waves that can develop into complicated patterns. I have drawn the downtrend channel. However, I am pretty sure one can do better than that. If you post your suggestions with a 4 hour EUR/USD chart I would appreciate that.
hello Mich thank you for calling me that . I appreciate that you share your analysis and trading ideas .
An Elliot wave master and a trend line master you cannot find analysis better than this !!
eurusd is in an uptrend since March , and here is a daily chart
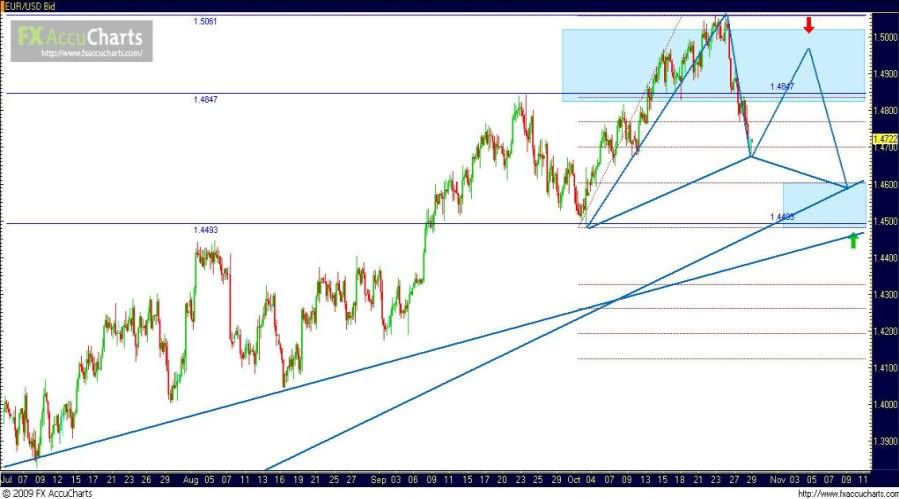
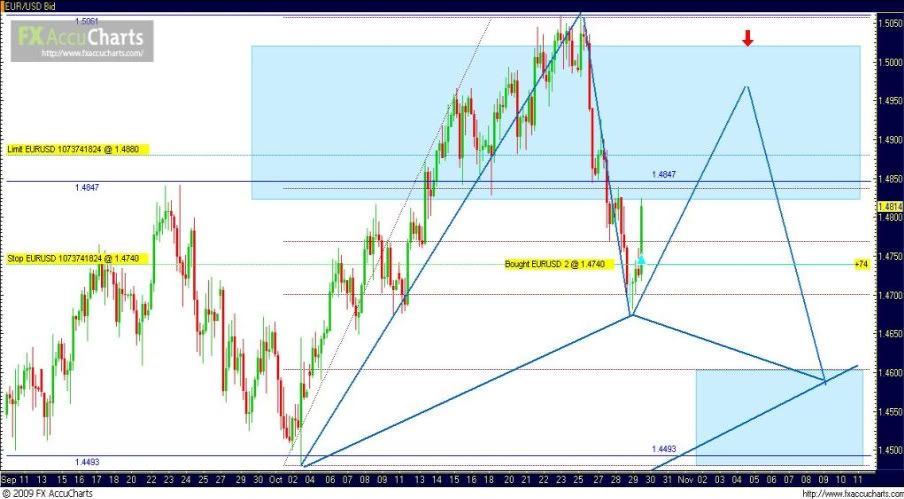
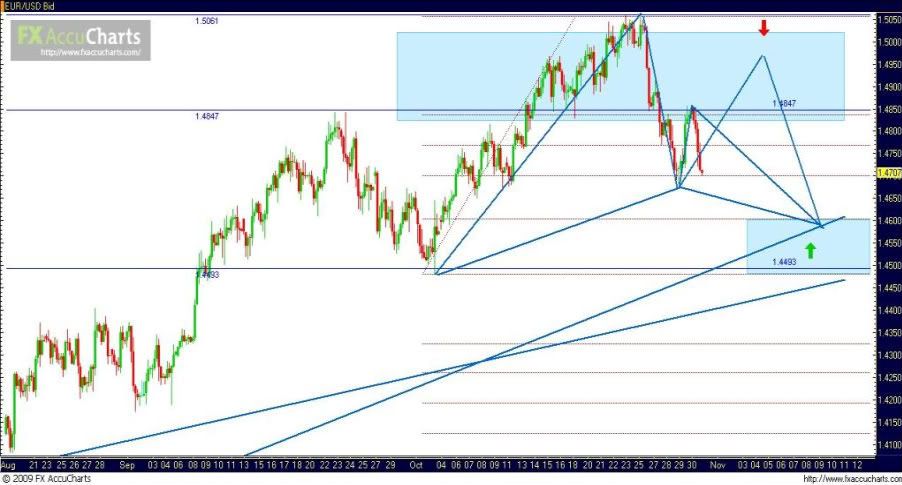
eurusd 4hr chart . It could develop into a harmonic pattern. if the price went up from the 61.8 fib retracment area of the last up wave then it is a gartley pattern
I am looking at this 4 hour EUR/USD chart and see whether the long downtrend (the blue line) is the start of another EW downtrend. If that is the case then I expect the third wave to go further down. My observation is based on the fact that the second Wave (2 in blue) is faily unambigious. The thirdd wave is usually one of the longest ones. So it would be interesting to see what is going to develop.