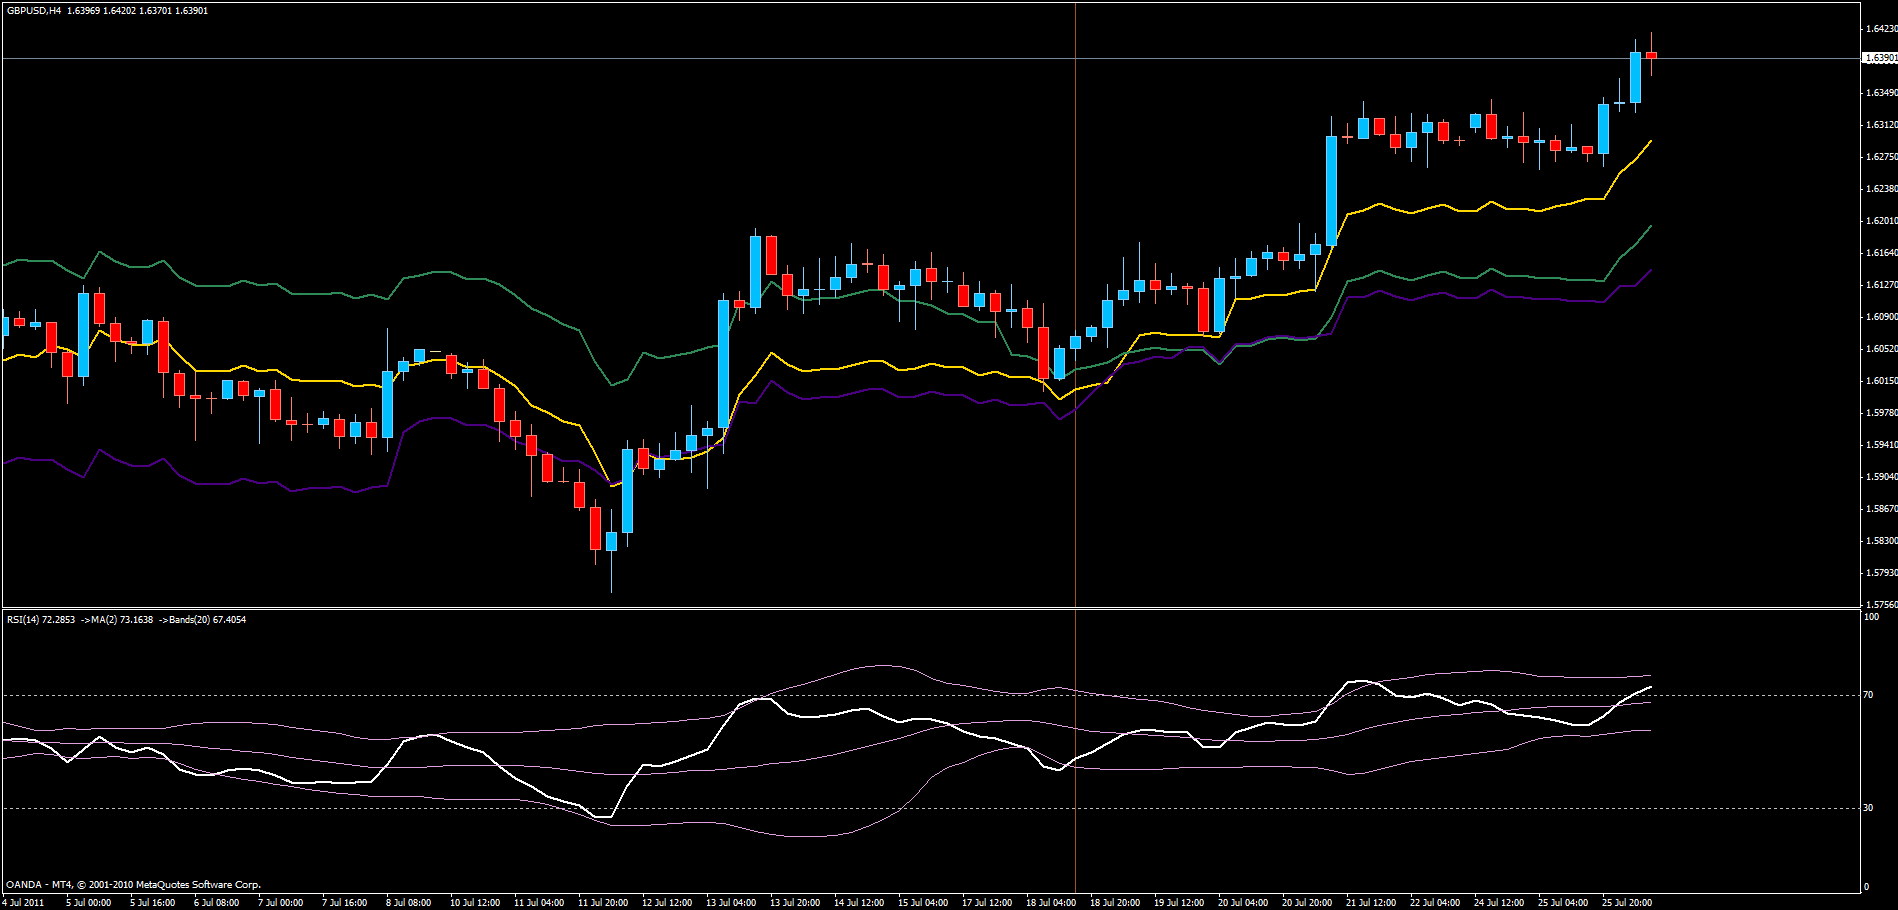
Bullish hammer forming as a shooting star, the previous bar, fails. Not a standard formation perhaps but in my view a strong signal that bulls have regained control.
I’ll try to add some commentary to future trade posts as you suggest.
Bullish hammer forming as a shooting star, the previous bar, fails. Not a standard formation perhaps but in my view a strong signal that bulls have regained control.
I’ll try to add some commentary to future trade posts as you suggest.
I’ve made a small change to the template file.
The file can be found in the first post which I’ll keep updated as we go.
The minor change is that I’ve added the same moving pivots to the 5min as we have on the 1min.
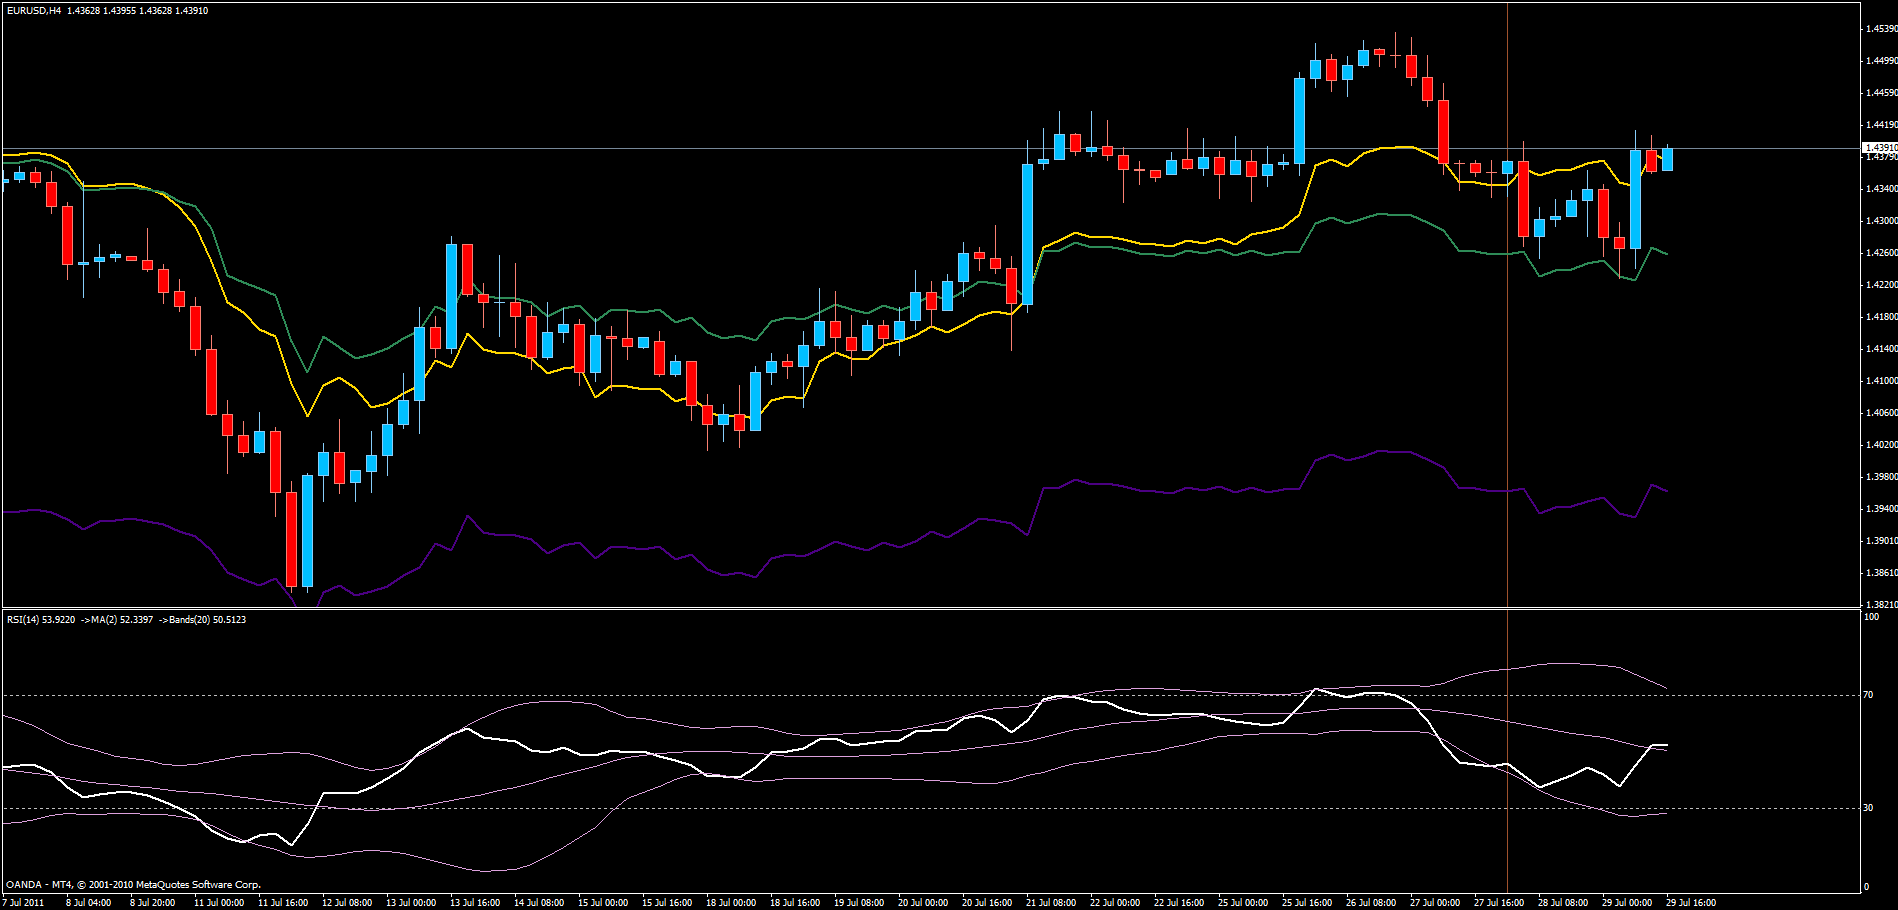
The main change is that the RSI smoothed by a 2 period MA, with Bollinger Bands overlayed window can now be seen on all time frames.
It acts as nothing more than a help to discover setups. I look for when the RSI MA has hit an outer BB and turned around again, or when the RSI MA reaches oversold or overbought levels.
Again, this is just a visual aid, nothing more. If it bothers more than it helps you can easily remove it or change what/which TF it is displayed on.
Chart example:

http://i923.photobucket.com/albums/ad76/o990l6mh/f17abd74.gif
I just found this thread and I really like the look of it. But I can’t seem to find the FoxPivotsModified indicator. Is it in this thread and I’ve missed it? The zip file from the first post just has the template file in it.
Sorry, forgot to include it when I updated the zip, I’ll fix it straight away.
Another update is in route for the system. I’m working on a further simplification and I think I’m close to the point where I’m ready to post it.
Right now I’m in the middle of moving and some other energy consuming stuff, so I’m really not very focused and relaxed the way I want to be for trading. It’s going to be a few more weeks until I’m able to turn full attention to my trading. However, when things settle down I’m going to focus 110% on trading.
So far I’m up for the year but I have more ambitious goals than the percentages I’m up so far.
I’ve said earlier that this is the year for me to stop talking and start delivering and that is exactly what I intend to do, and you’re all invited to join me for the ride.
I’m not a guru or a teacher and I’m certainly not a pro, but I will help with what I can.
Unfortunately trade 4 which was taken on July 27 resulted in a loss.
The rationale behind it was that I saw a 4H bar that was both an inside bar and a bullish pin bar. In hindsight one might say that it was too small for a good pin bar but that’s hindsight for you.
Anyway, it broke to the north and then rapidly turned into a false break, the kind usually created by the big banks to draw in… well… me. Losses are just part of the game and so we just move on to the next trade.

http://i923.photobucket.com/albums/ad76/o990l6mh/de66926a.gif
I’ve decided to remove the green moving pivots that corresponded to a rolling 1 month period. It added no real value but rather cluttered the chart. The yearly indigo moving pivot does the job well enough.
Change number two concerns the period of the gold colored moving pivot. Previously it represented 1 week but after much reviewing today I’ve changed it to instead represent three days. The last three days are more relevant than the last five days and this change results in a moving pivot that better tracks price.
Third change is that I removed the RSI indicator window again, it’s a good visual aid but it’s not something that I’ll be using much and therefore it takes up valuable screen space.
Fourth change concerns the 1min and 5min charts where the green moving pivot now represents four hours instead of eight hours.
First post updated as per above and zip file updated as well.
I’ve been away for a few days and it will be a while longer until I can focus on trading, that’s why it’s quiet here…
All right, I’m back.
I’ve made some final changes to the system and will be updating the first post again, though I’ll leave the chart examples as they are. After quite a bit of consideration I’ve changed the periods on the moving pivots to better track price.
The RSI window is back, but only on the 1min and 5min charts. I’m including two templates to choose from. They’re the same except moving pivot lines are thicker on one of them and I’ve zoomed in a bit more.
The myfxbook tracker has been removed since I transferred my account from Oanda US to Oanda Europe. As a result I got new account numbers and I’d have to set up myfxbook again. Maybe I’ll do it but no guarantee.
I’m not sure if I’ll be able to update this thread all that much since summer vacation is over come Monday and I’m going to focus a lot on trading and work from now on. I’ll post when I have the time but I’m not sure how often that will be.
Hi
Thank u for contributing this system to us.
From your 1st post the zip file, why both templates are blank? do not include the foxPivotModified.mq4 file,
I like this system because of its simplicity. Please continue posting to make this thread alive.
I have an custom indicator Pattern_Recognition_Master_ v3.mq4 which show different
candle patterns, like Bullish Engulfing,… etc.
Seems like I cant attach the file, or add a link here, I need 5 posts then can send a link.
but u can search google Pattern_Recognition_Master_ v3.mq4
and download from there.
Hi golady,
I downloaded the zip file myself now and installed the three files, the indicator and the two templates. Everything works on my end, maybe it’s something with your computer.
I’m aware of the many different pattern recognition indicators out there, but I choose to do without them as most of them clutter the charts and point out every setup that fits the criteria. I’m more comfortable picking the setups based on my own judgment of what looks good and what doesn’t. It’s the discretionary part of it.
That’s what I’m comfortable with, but if you find good use for the indicator then you should use it. My way is certainly not the only way.
If i see an Engulfing candle, I would exit.
Maybe someone or you can code your pattern indicator as custom indicator,
and we all can use it.
thanks.