Thanks for your suggestion Master Tang! You are right about moving my 2nd contract’s SL to B/E, I’ve done it in the past and it really helps in keeping me in the green. But that said, to be honest, I’m not the most careful trader around, I only take glances at my charts every 10mins or so and I prefer to leave things as they are. In short, I’m lazy :o But I really appreciate you pointing it out to me, and I really should work it into my trading plan 
27 July 2010
Pair: GBPCHF
Timeframe: 1H
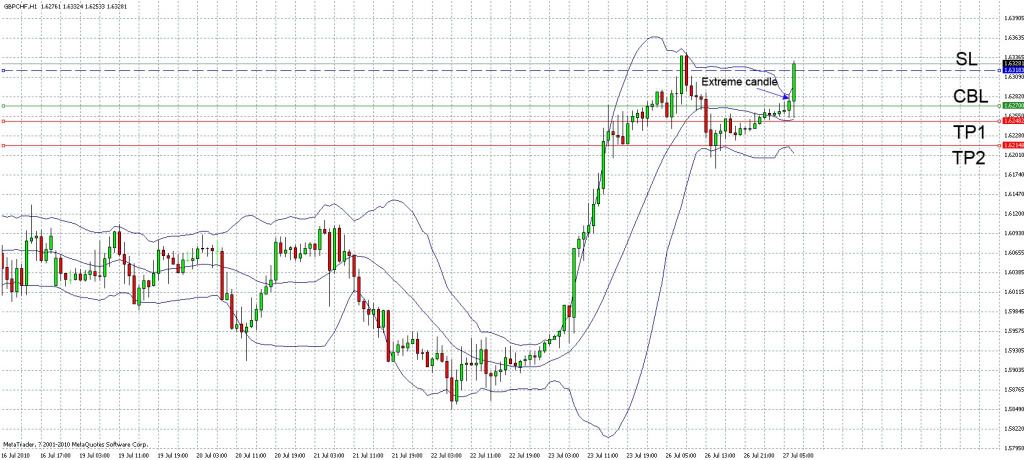
A re-entry of my previous trade on 26 July. Seeing that area P has been reached, I set up pending orders for a short trade with 2 contracts when PA touched the upper BB. Entry price was set at 1.6270 according to the CBL (obtained by cutting the extreme candle in 2), and PCI SL was 1 extreme candle length from the high of said extreme candle at 1.6318. Subsequent PA almost reached TP1 but instead continued on its uptrend and hit my SL.
Total P&L = -96pips
27 July 2010
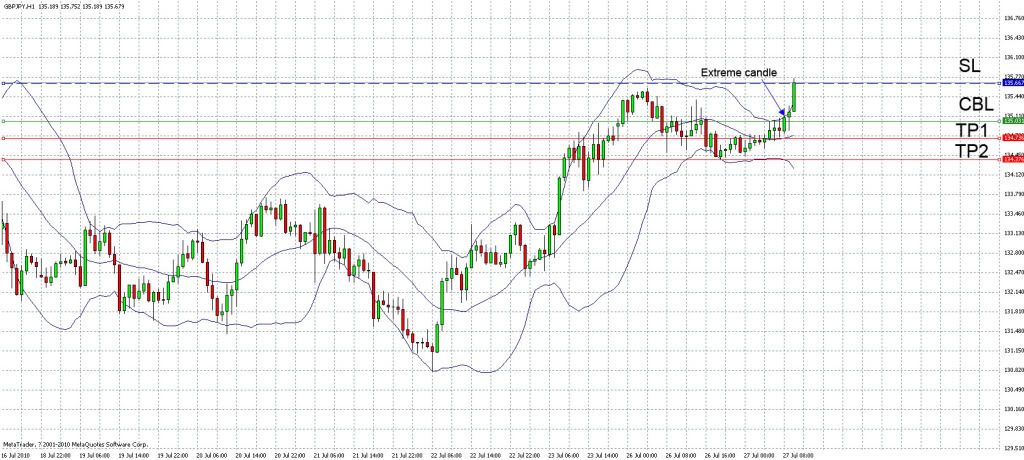
Pair: GBPJPY
Timeframe: 1H

Pending orders for a short trade with 2 contracts were set with entry price at 134.88 (extreme candle was cut in 2 to get CBL), and PCI SL was set at 135.40. As you can see from the candle marked “Exit” on my chart, that candle closed above the high of the extreme candle but below SL, thus the trade was exited at market prices of 135.11 and 135.13.
Total P&L = -48pips
27 July 2010
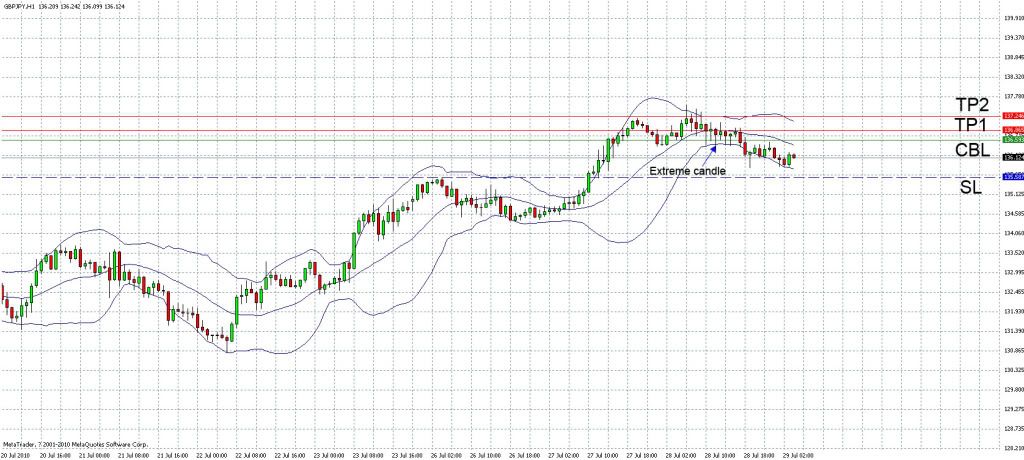
Pair: GBPJPY
Timeframe: 1H
Re-entry of the previous trade using the exit candle as the new extreme candle. Entry price was set at 135.03, PCI SL at 135.67. After triggering my orders, the PA continued on its uptrend and hit my SL. The reason why I didn’t exit at the close of the immediate candle after the extreme candle was because its close was lower than the high of the extreme candle.
Total P&L = -128pips
By now I’ve realised that trading against the direction of the ongoing trend in that particular timeframe is a poor bet. But just as I decided to try trading in the direction of the trend for my next couple of trades, it turned against me as well…
28 July 2010
Pair: GBPJPY
Timeframe: 1H
Noting that area P has been reached on the charts, I set up my orders for a long trade for 2 contracts (same direction as the apparent ongoing uptrend). Entry price was set at 136.59 while PCI SL was set at 135.59. Orders were triggered and TP1 was reached successfully, upon which I followed Master Tang’s recommendation of adjusting my SL for the 2nd contract to B/E (entry price). PA subsequently retraced and hit the new SL.
Total P&L = +28pips
29 July 2010
Pair: GBPCHF
Timeframe: 1H
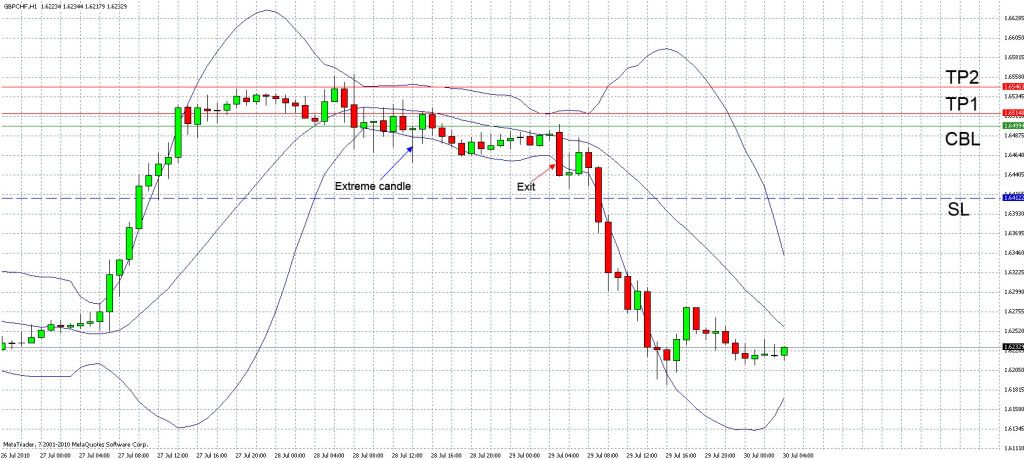
Orders for a long trade for 2 contracts were set up with entry price at 1.6499 and SL at 1.6412. As I had set up my orders late (at about the 2nd candle after the extreme candle), PA did not hit TP1 and retraced instead. When a candle finally closed below the low of the extreme candle, I exited the trade at market prices of 1.6444 and 1.6445. Another example of the trend reversing on me after entry :o
Total P&L = -109pips
30 July 2010
Pair: EURUSD
Timeframe: 1H
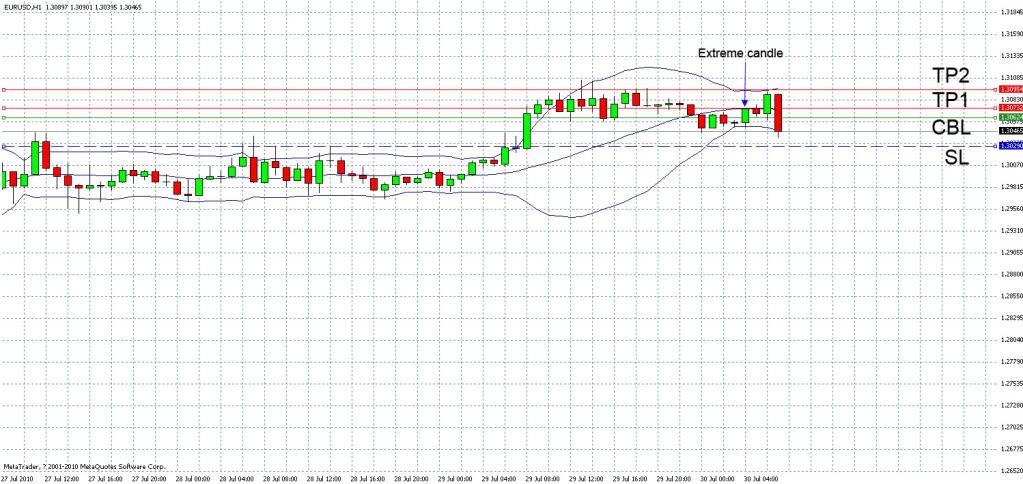
Orders for a long trade with 2 contracts were set up after area P had been reached. Entry price was set at 1.3062 while SL was 1.3029. After the orders were triggered, TP1 was reached rather quickly and I readjusted my SL for the 2nd contract to B/E. PA almost reached TP2 before retracing and hitting the new SL.
Total P&L = +9pips
So after a month of trading my current plan, I’ve decided to have a quick stock-take…
Total trades made: 19
Winning trades (trades that ended with +ve pips): 11
Losing trades (trades that ended with -ve pips): 8
Win rate = 57.89%
Slightly better than flipping a coin. Expectancy was calculated to be approximately 19.04%, but in keying the values for average winning/losing trade ($), I had used the average pip values of my wins and losses, so I’m not too sure if this number is solid.
Looks like I will still need to look at how I can further optimize my plan. Feedback and suggestions most definately welcome
I used to have similar problems like you.
Then graviton came along and shed some light to me on this matter.
Now, whenever i enter a trade, i will find 3 good reasons to enter it. Sometimes i could 4 or even 5! However, the more reasons simply increase the probability of trade going my way, not a guarantee.
I have seen some of your entries, good you had cbl entry and trading with the trend. So you have 2 good reasons.
Perharps a third?
Some suggestions could be, break of a retracement trendline or stochs heading in the right direction of your trade?
Some pointers to see if is of any use to you, hope that helps! 
Hey fartist, thanks for the inputs! I did think about using more filters to screen trades, but I’ve more or less decided against additional indicators since Tymen originally meant it to be an indicator-free method. I’m trying to read up more on price action now (kinda hard to find literature on this) and see if I can incorporate that into my plan, it may form the 3rd reason as you pointed out!
Personally i think a break of retracement trendline would serve as a good reason. No indicator as its solely price action.
Good luck!
While I’m still trying to scour the local bookstores and the web for more information on price action, I’ll still be trading my current plan. As they say, the only way to improve is to practise.
With a new month comes a new beginning and hopefully better trades
3 Aug 2010
Pair: USDCAD
Timeframe: 1H
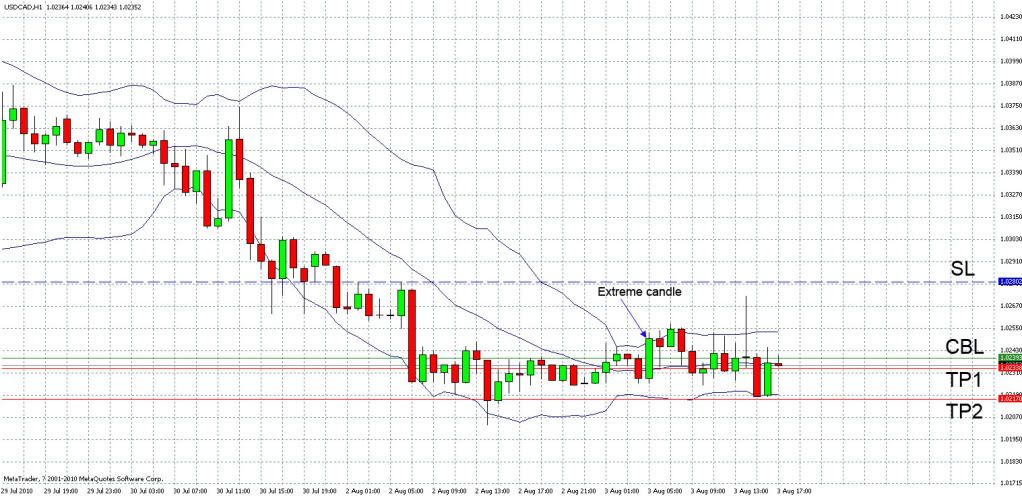
As area P had been reached, I proceeded to set pending orders for a short trade with 2 contracts, entry price was at 1.0239. CBL was drawn by cutting extreme candle in half due to its length. SL was set at 1 extreme candle length from the high of the extreme candle, at 1.0280.
The trade was then left to run as I went out on errands (a bad habit I can’t seem to kick - that is, not monitoring the trade). According to my trading plan, the trade should have been exited on the 2nd candle after extreme candle as it had closed above the extreme candle’s high. When I next checked on the trade, TP1 had been reached thankfully. SL for 2nd contract was readjusted to B/E. Price action almost reached TP2 but retraced and hit the new SL.
Total P&L = +5pips
PS: I must say I was breaking out in a cold sweat when the PA spiked upwards as seen from one of the candles.
The next 3 trades were taken more or less at the same time…
3 Aug 2010
Pair: NZDUSD
Timeframe: 1H

Pending orders for a short trade with 2 contracts were set, and entry price was at 0.7330. SL was set at 1 extreme candle length from the high of the extreme candle, at 0.7357.
After orders were triggered, PA reached TP1 rather quickly. The SL for the 2nd contract was readjusted to B/E after some monitoring. The next part is kinda strange. PA seemed to have hit TP2 as shown in the chart but trade was not exited, and subsequently retraced and hit the new SL. I suspect TP2 might not have been triggered due to the pair’s spread, though I’m not sure how to articulate this.
Total P&L = +6pips
3 Aug 2010
Pair: EURGBP
Timeframe: 1H
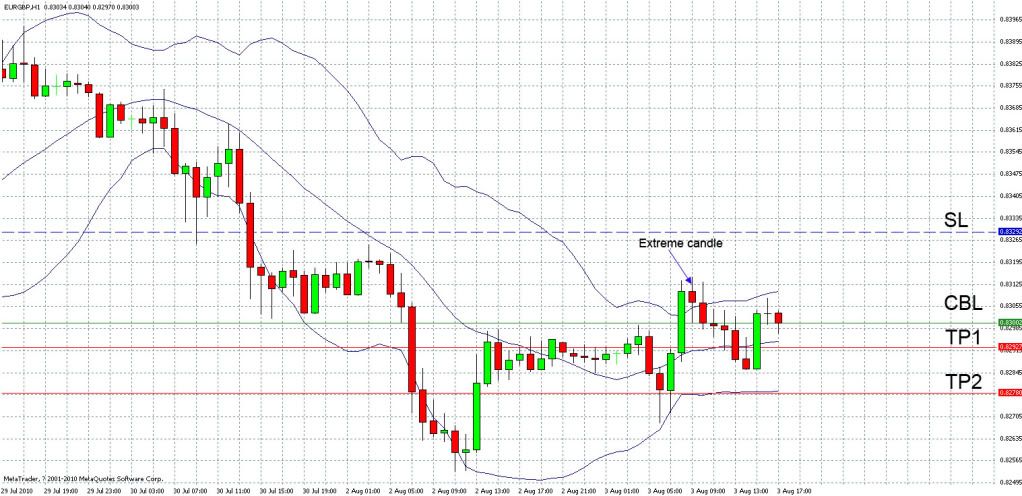
As usual, seeing that area P had been reached, I set the pending orders for a short trade for 2 contracts with an entry price of 0.8300. PCI SL was set at 1 extreme candle length from the high of the extreme candle, at 0.8329.
When price reached the level of the CBL, only 1 order was triggered. I later realised it was due to the lack of funds as they were tied up in other trades going on simultaneously. TP1 was reached rather smoothly.
Total P&L = +7pips
PPS: Another lesson learnt - don’t be greedy and hold onto too many trades at once.
3 Aug 2010
Pair: USDCHF
Timeframe: 1H
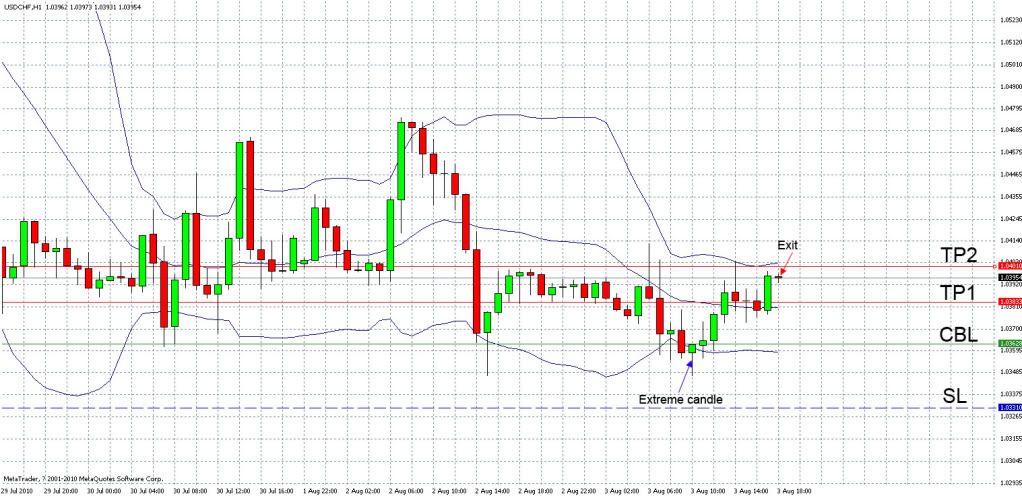
Noting that area P has been reached, I set my pending orders for a long trade for 2 contracts. Entry price was at 1.0363 and SL was set at 1 extreme candle length from the low of the extreme candle, at 1.0331.
After the orders were triggered, TP1 was reached and SL for 2nd contract was readjusted to B/E. The original TP2 was also readjusted lower to correspond to the repainted upper BB. 2nd contract was finally exited at market price 1.0395 as I was headed for bed and no trades should be left running overnight.
Total P&L = +52pips
3 trades today with 2 wins and 1 loss which was due to an oversight on my part…
4 Aug 2010
Pair: GBPUSD
Timeframe: 1H
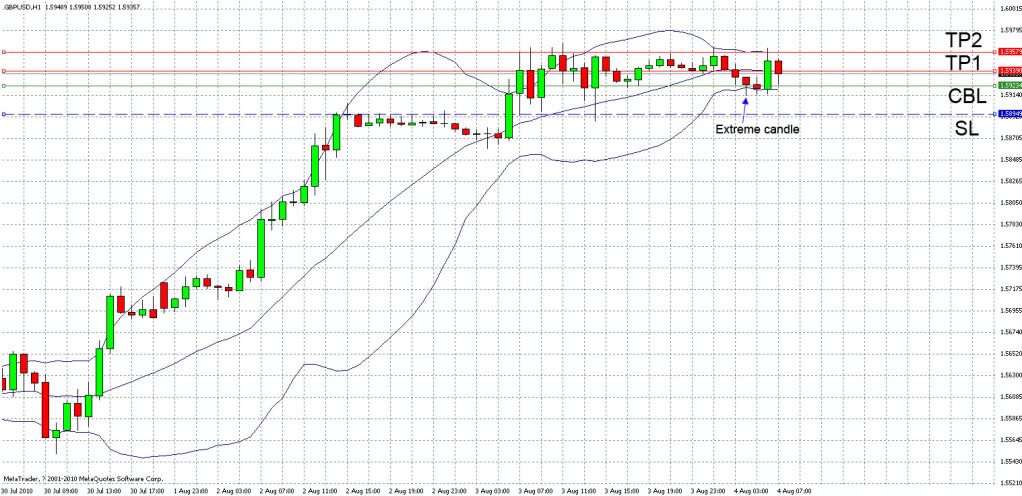
This was a straightforward trade. After area P has been reached, pending orders for a long trade with 2 contracts were set. Entry price was at 1.5923 and SL was set at 1.5895. Both TP1 and TP2 were reached quite quickly and I didn’t have to adjust the 2nd SL to B/E.
Total P&L = +51pips
4 Aug 2010
Pair: EURUSD
Timeframe: 1H

In alignment with the uptrend in the 1H chart, I set up my orders for a long trade for 2 contracts with an entry price of 1.3215. SL was set at 1 extreme candle length from the low of the extreme candle, at 1.3195.
After the orders were triggered, TP1 was hit but SL for the 2nd contract was not adjusted to B/E as PA was retracing a little then and I was hoping for PA to hit TP2. PA subsequently retraced and hit the SL for a loss of -20pips.
Lesson learnt: Greed costs pips. Always adjust the 2nd SL to B/E if possible.
PS: apologies for the chart, forgot to zoom in.
Total P&L = -10pips
4 Aug 2010
Pair: EURUSD
Timeframe: 1H

I was still counting on an uptrend to resume for the EURUSD. When I saw the extreme candle forming, I couldn’t resist setting up my entry. Entry price was at 1.3206 and SL was at 1.3159. After the orders were triggered, TP1 was hit and SL for the 2nd contract was adjusted to B/E. PA subsequently retraced and hit new SL.
Total P&L = +15pips
Keep plodding on [B]TimberWolfMk2![/B] I hope that you find enlightenment on your quest to further your knowledge of Price Action, and that it improves your trading for the best!
Happy pipping!
Hey Trizzle, thanks for the support and well wishes! I hope that you are making good progress on your journey as well
Haven’t been able to trade much this week, but overall its been a rather smooth ride. As for my literature search on the topic of price action, I’m currently reading Steve Nison’s “Beyond Candlesticks” and have placed an order for Al Brooks’ “Reading Price Charts Bar by Bar”. If you have any other recommendations, I’d be glad to hear them!
Hey! I will def try ta stay abreast of your trading journal. If it is possible for you ta post tha trade before it is actually over that would be great. I would like ta compare ur trades with my own. Please feel free ta comment on my trades as well in DayDreamin’s Dream Journal. Happy trading.
Thank you for this journal. It seems to be very useful for traders, because adopting of other’s experience is very important to each of us.
Good luck and happy trading!
Truer words have never been spoken. (They have… but chu know what I mean!  )
)
Hi guys, welcome to my humble thread! Always glad to see new faces around and to share the little I know
DayDreamin - noted, I’ll def try to post pics of the trade before it is over in the future!
Have been really busy so I haven’t had much time for trading or posting this week or so. Besides, the price movements have been really choppy for some reason this past week, making it hard to identify entry points.
I have come to a point where I doubt I will be able to continue trading and monitoring the hourly charts, so I’m considering moving to a higher timeframe (4H). Pros and cons this one, on one hand I wouldn’t need to be constantly infront of my computer all day, and the fear of missing an entry point while asleep should be negated. On the other, trade opportunities may be reduced and as price seems to move about in a bigger range on higher timeframes, the SL may get uncomfortably large. Will try this out for the remainder of the month and post the results.
And on to this week’s trades…
10 Aug 2010
Pair: GBPJPY
Timeframe: 1H
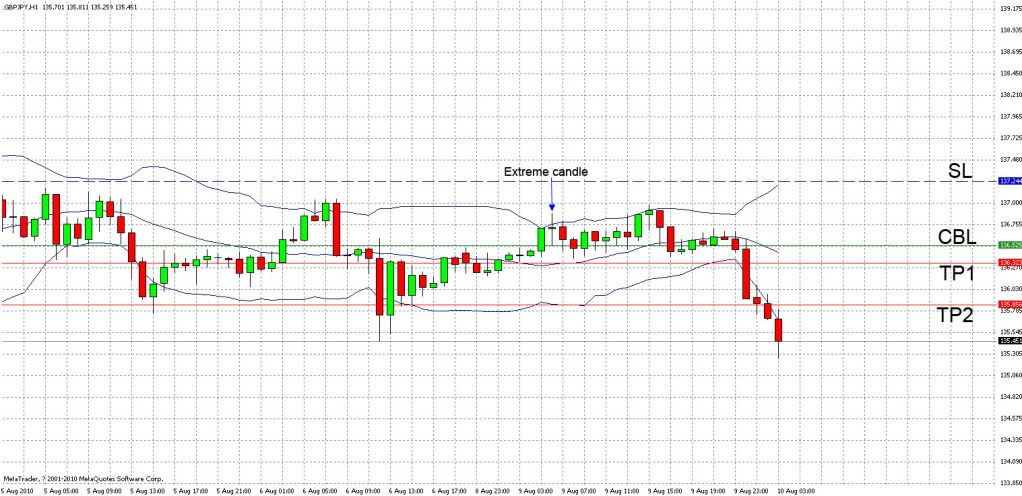
The pair has been moving in a range for sometime, so I thought I’d try to catch a bounce off the outer BBs. When an extreme candle formed off the upper BB, I set my pending orders for a short trade with 2 contracts. Entry price according to CBL was 136.53 and SL was at 137.24 (1 extreme candle length from the high of the extreme candle).
Made my favourite mistake of not monitoring the trade and leaving it to run on its own again. After the orders were triggered, there was a candle that closed above the high of the extreme candle (upon which the trade should have been exited and a re-entry made with a new extreme candle). This however was not performed as I was not at the computer. Luckily the PA reversed and hit my TPs, yielding a profit when I next checked.
Total P&L = +88pips
12 Aug 2010
Pair: USDCHF
Timeframe: 1H
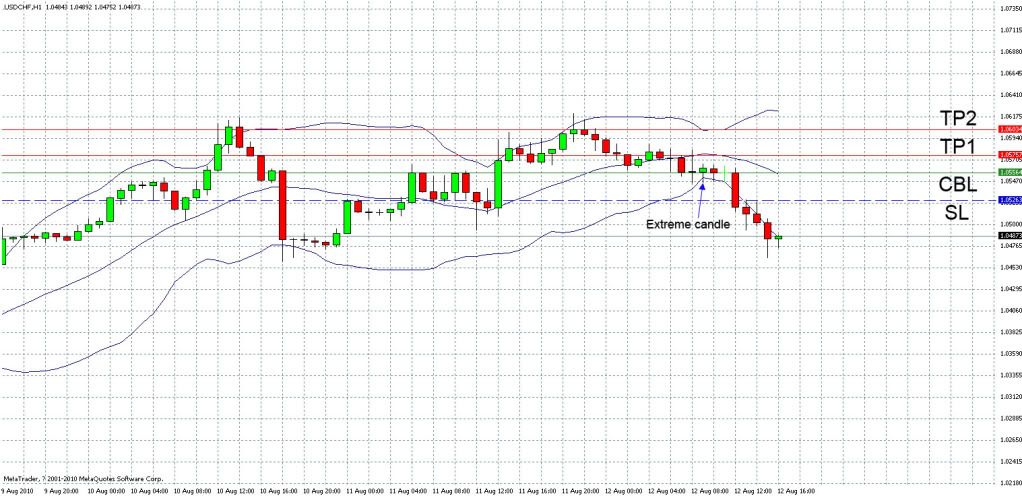
After area P has been reached, pending orders for a long trade with 2 contracts were set in alignment with apparent uptrend in the 1H chart. Entry price was at 1.0556 (extreme candle cut in 2 to get CBL). SL was set at 1 extreme candle length from the low of the extreme candle, at 1.0526. After the orders were triggered, the PA retraced and hit SL for a total loss of 60pips.
Total P&L = -60pips
13 Aug 2010
Pair: GBPCHF
Timeframe: 1H

In alignment with the prevailing downtrend in the 1H chart, pending orders for a short trade with 2 contracts were set. Entry price according to the CBL was at 1.6406, SL was set to 1.6493.
After orders were triggered, PA moved upwards and closed above the high of the extreme candle. Trade was exited at market prices of 1.6473 and 1.6474 for a total loss of 135 pips, compared to a loss of 174 pips if SL had been hit.
Total P&L = -135pips