FxGrow Daily Technical Analysis – 19th Nov, 2015
By FxGrow Research & Analysis Team
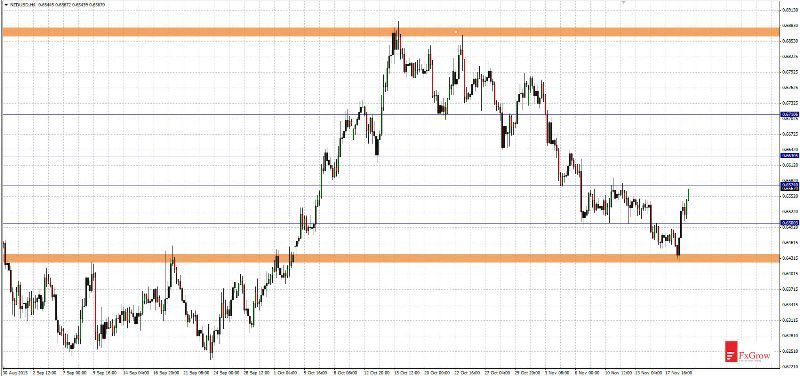
NZDUSD - dynamic rebound from 0.6430
On Monday NZDUSD broke below support at 0.6500. It seemed that declines may be deeper. However already first support at 0.6430 caused rebound. Currently dollar strengthenes at all of the battlefronts and this wave begun after FOMC minutes which were published on Wednesday. Fundamentally there are no reasons to rebound, because first hike of interest rate may - but do not have to - be during December FED meeting. Therefore this upward movement must be treated as correction as long as last high at 0.6880 is not broke above.
Next resistances which may cause declines are at levels: 0.6574, 0.6630, 0.6710. Alternatively if there will be rebound nearest supports are at levels: 0.6500, 0.6430.
For more in depth Research & Analysis please visit FxGrow.
Note: This analysis is intended to provide general information and does not constitute the provision of INVESTMENT ADVICE. Investors should, before acting on this information, consider the appropriateness of this information having regard to their personal objectives, financial situation or needs. We recommend investors obtain investment advice specific to their situation before making any financial investment decision.
FxGrow Daily Technical Analysis – 20th Nov, 2015
By FxGrow Research & Analysis Team
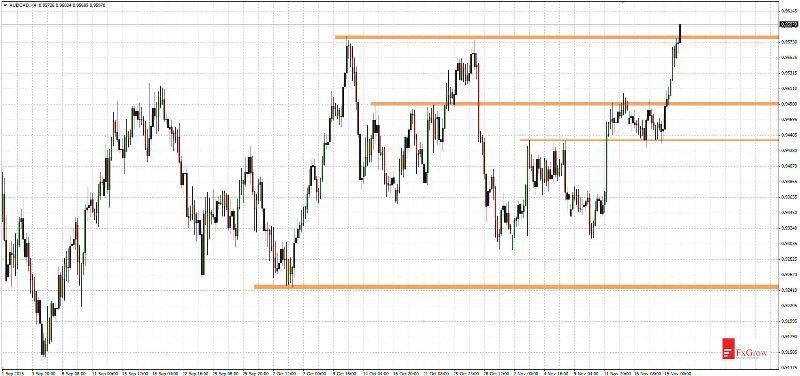
AUDCAD - new upward wave or triple top pattern
Previous analysis of November 12 gave a profit more than 100 pips. I wrote: “AUDCAD may test 0.9490. After break above this level target for the demand is at 0.9580, but fast break above is unlikely. If price rebounds, next supports will be located at: 0.9440, 0.9370”. So it happened, price after reaching 0.9580 level rebounded and correction lasted a one week. Correction ended 8 pips below level pointed in analysis at 0.9432.
Today upward movement reached 0.9600 level. Triple top pattern may complicate breaking above this resistance If it succeeds next target for demand are at levels: 0.9630, 0.9740. A little higher that 0.9740 there is a downtrend line and that level certainly will make rebound and return to main trend which is downtrend. However if there was rebound right now nearest supports are at levels: 0.9490, 0.9440.
For more in depth Research & Analysis please visit FxGrow.
Note: This analysis is intended to provide general information and does not constitute the provision of INVESTMENT ADVICE. Investors should, before acting on this information, consider the appropriateness of this information having regard to their personal objectives, financial situation or needs. We recommend investors obtain investment advice specific to their situation before making any financial investment decision.
FxGrow Daily Technical Analysis – 20th Nov, 2015
By FxGrow Research & Analysis Team
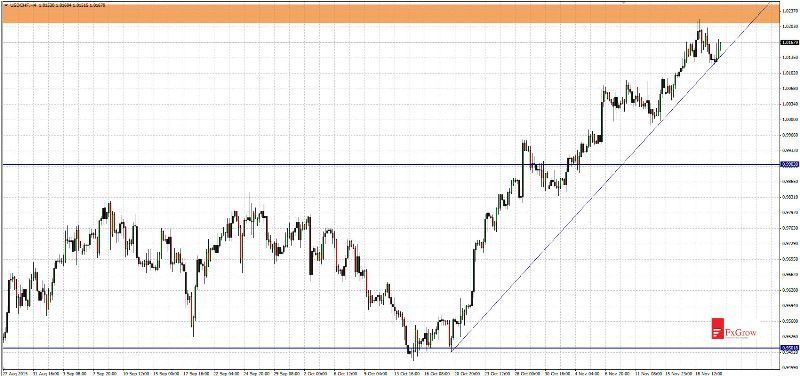
USDCHF - highest since 2015
Dollar continues its uptrend rally on most of the currency pairs. Interesting situation can be seen at USDCHF, where price reached level in which was last time in the January 2015. Then it was finished by dramatically drop from 1.0230 to 0.7810. Since a month there is a dynamic upward movement without any bigger correction. Currently price reached to resistance and that level should bring declines or maybe even a deeper correction. Strong support levels are at 1.0000, 0.9900, 0.9500.
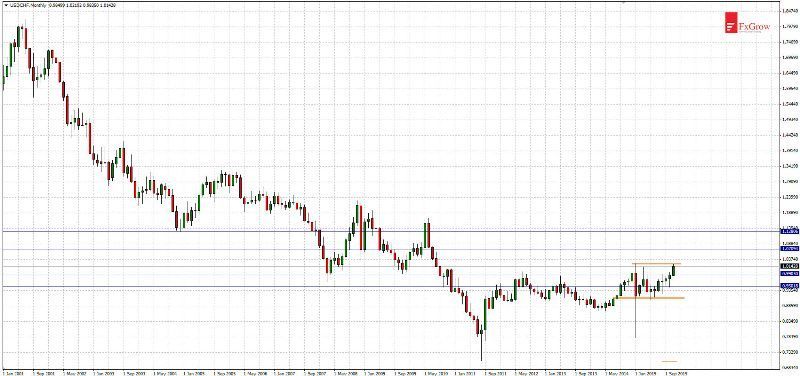
Wider view, time-frame monthly
Long-term perspective depends on what level USDCHF will end this month. Since 5 years there wasn’t end of the month above 1.0000. If demand will end this month at current levels it will be more likely that upward movement will be continued in the next month. The next strong resistance are at levels: 1.0700, 1.1280.
For more in depth Research & Analysis please visit FxGrow.
Note: This analysis is intended to provide general information and does not constitute the provision of INVESTMENT ADVICE. Investors should, before acting on this information, consider the appropriateness of this information having regard to their personal objectives, financial situation or needs. We recommend investors obtain investment advice specific to their situation before making any financial investment decision.
FxGrow Daily Technical Analysis – 23rd Nov, 2015
By FxGrow Research & Analysis Team
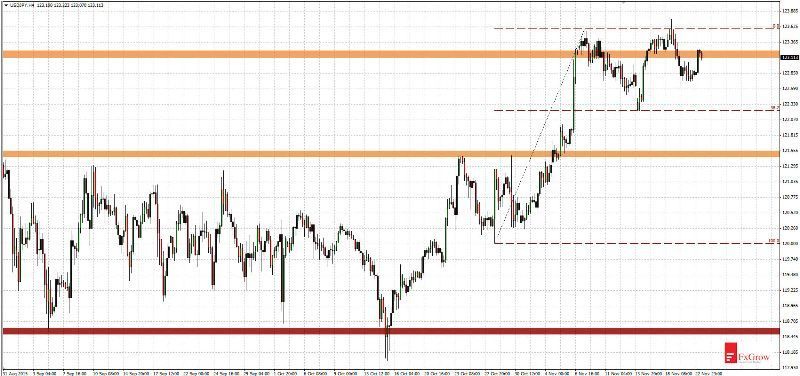
USDJPY - resistance at level 123.20 is a trouble for demand
Since mid-October USDJPY moves in uptrend. This isn’t a vertical upward movement, but higher highs and higher lows shows that trend is continue. Since two weeks demand has a problem with break above level at 123.20. Two times such attempt ended as fakey. Positive for the bulls is the fact that declines have stopped already at fibo 38.2% therefore bears do not have yet a lot to say.
If resistance at 123.20 will be break above next targets for bulls are at levels: 124.50, 125.20 and 125.85 which is this year’s high. After leaving on a new high strong resistance is at level 135.15 which is high from 2002 year. If there was correction, nearest supports are at levels: 122.23, 122.00, 121.45.
For more in depth Research & Analysis please visit FxGrow.
Note: This analysis is intended to provide general information and does not constitute the provision of INVESTMENT ADVICE. Investors should, before acting on this information, consider the appropriateness of this information having regard to their personal objectives, financial situation or needs. We recommend investors obtain investment advice specific to their situation before making any financial investment decision.
FxGrow Daily Technical Analysis – 23rd Nov, 2015
By FxGrow Research & Analysis Team
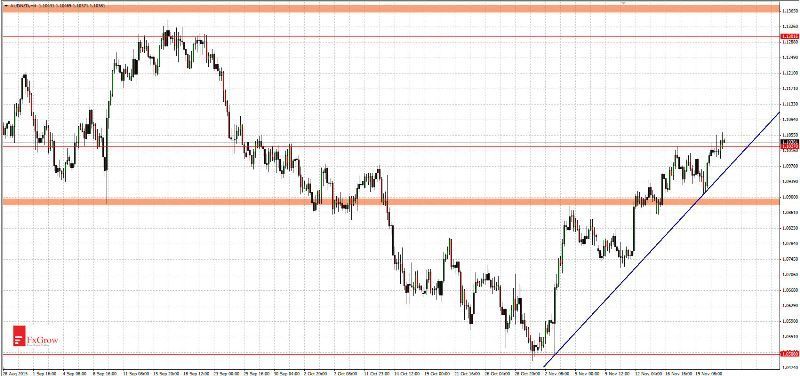
AUDNZD - highest since September 2015
AUDNZD continue its upward rally. In November price increased more than 500 pips. There was a return to consolidation in which price moved from June to October (see orange lines).
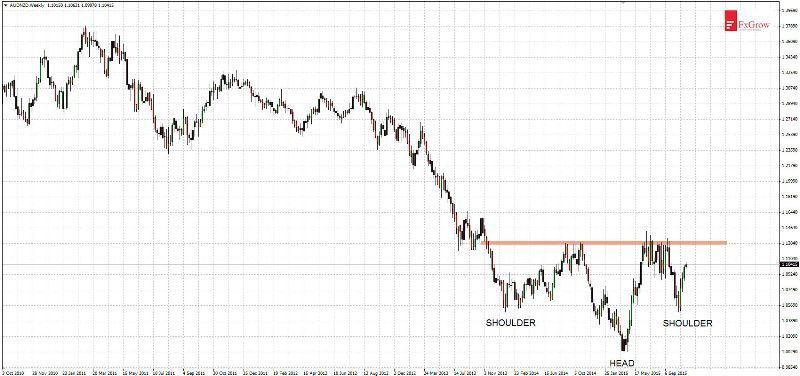
Today demand has confirmed its strength breaking above resistance at 1.1027 and test of 1.1330 and 1.1440 levels seems to be a matter of time. Break above level 1.1400 give a signal to realization of huge head and shoulders pattern. Range of upward movement which is estimated by distance between head and neck line reaches to level 1.2560. In case of rebound nearest supports are at levels: 1.1027, 1.0950, 1.0880.
Time-frame H4:
Time-frame W1:
For more in depth Research & Analysis please visit FxGrow.
Note: This analysis is intended to provide general information and does not constitute the provision of INVESTMENT ADVICE. Investors should, before acting on this information, consider the appropriateness of this information having regard to their personal objectives, financial situation or needs. We recommend investors obtain investment advice specific to their situation before making any financial investment decision.
FxGrow Daily Technical Analysis – 24th Nov, 2015
By FxGrow Research & Analysis Team
EURAUD – rebound from level 1.4700
Previous analysis of November 13 gave profit 350 pips. I wrote: “Support at 1.5150 was break below and downward movement is continuing in direction of level 1.5000. After break below support at 1.5000 target of falls will be 1.4730, 1.4400”. Actually falls reached to level 1.4700 and yesterday was a rebound.
There is a possibility that at current level will be a rebound or even trend reversal because that level is supported by fibo 61,8% of previous upward movement. If rebound will be succeed resistances are at levels: 1.5000, 1.5270, 1.5500. However if support at 1.4700 will be break below nearest supports are at levels 1.4400, 1.4000.
For more in depth Research & Analysis please visit FxGrow.
Note: This analysis is intended to provide general information and does not constitute the provision of INVESTMENT ADVICE. Investors should, before acting on this information, consider the appropriateness of this information having regard to their personal objectives, financial situation or needs. We recommend investors obtain investment advice specific to their situation before making any financial investment decision.
FxGrow Daily Technical Analysis – 25th Nov, 2015
By FxGrow Research & Analysis Team
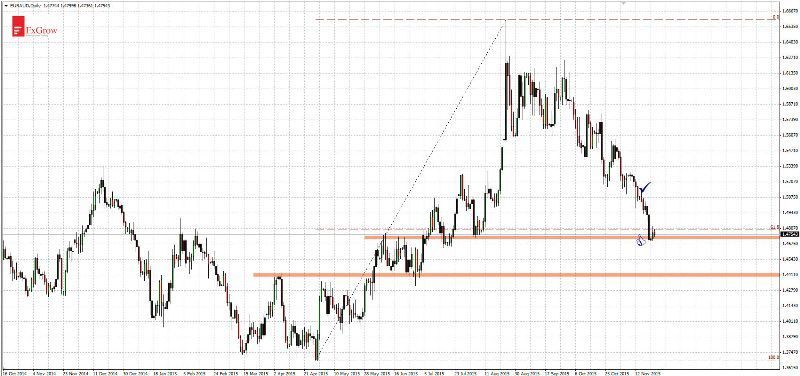
AUDUSD - rebound reached to resistance
Since November 19 on AUDUSD is rebound because downtrend line was break above. Upward movement reached to resistance at level 0.7270 and 30 pips higher at level 0.7300 there is fibo 78.6% of previous downward movement. If demand will be strong next resistances are at levels 0.7340, 0.7420. However if there will be a rebound, nearest supports are at levels 0.7250, 0.7210, 0.7080.
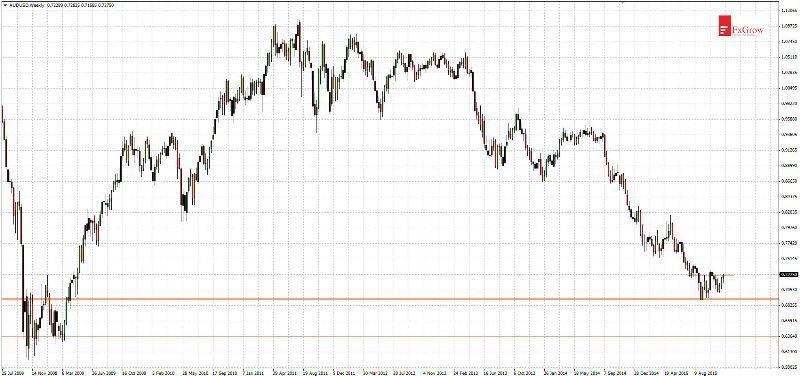
Wider view. time-frame W1
Since 2011 AUDUSD moves in downtrend. At this time price moved down by 4000 pips. Low was tested at August 2015 at level 0.6900, it was important level 7 and 11 years ago. However if that support will be break below falls may reach to more important support at 0.6350.
For more in depth Research & Analysis please visit FxGrow.
Note: This analysis is intended to provide general information and does not constitute the provision of INVESTMENT ADVICE. Investors should, before acting on this information, consider the appropriateness of this information having regard to their personal objectives, financial situation or needs. We recommend investors obtain investment advice specific to their situation before making any financial investment decision.
FxGrow Daily Technical Analysis – 25th Nov, 2015
By FxGrow Research & Analysis Team
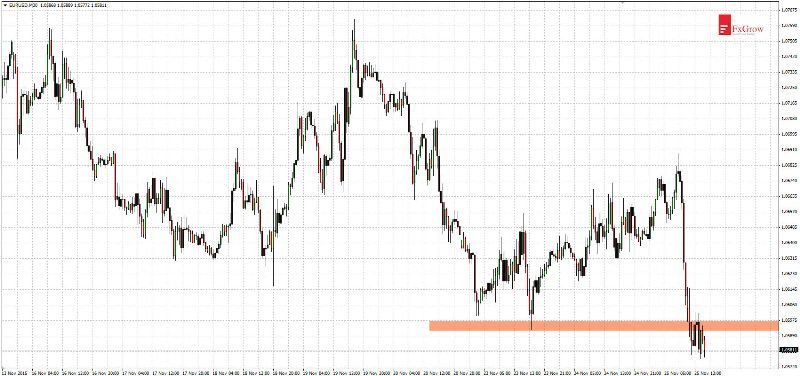
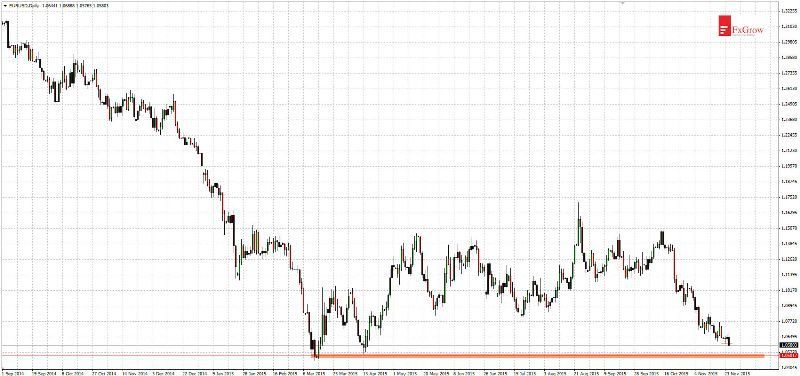
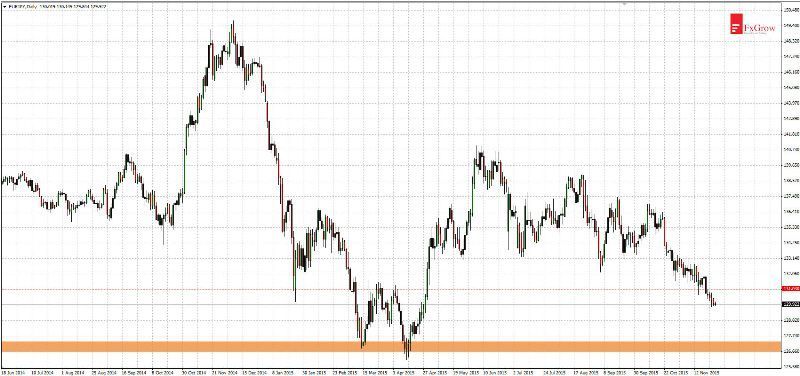
EURUSD below 1.0600 - getting closer to test of this year’s low
Today’s macro data series from the US economy led to a further strengthening of the dollar. Published data of durable goods orders are better that expected and US citizens income raised month to month. What is more, jobless claims fell by 13000.
It is another week when EURUSD deepens its lows. And it’s hard to think about bigger rebound while low of this year wasn’t tested again. Target for declines is at level 1.0500 and there should be rebound. Because for a quite long time EURUSD falls without any correction. If there will be rebound nearest resistances are at levels: 1.0600, 1.0680, 1.0730.
Time-frame M30:
Time-frame D1:
For more in depth Research & Analysis please visit FxGrow.
Note: This analysis is intended to provide general information and does not constitute the provision of INVESTMENT ADVICE. Investors should, before acting on this information, consider the appropriateness of this information having regard to their personal objectives, financial situation or needs. We recommend investors obtain investment advice specific to their situation before making any financial investment decision.
FxGrow Daily Technical Analysis – 26th Nov, 2015
By FxGrow Research & Analysis Team
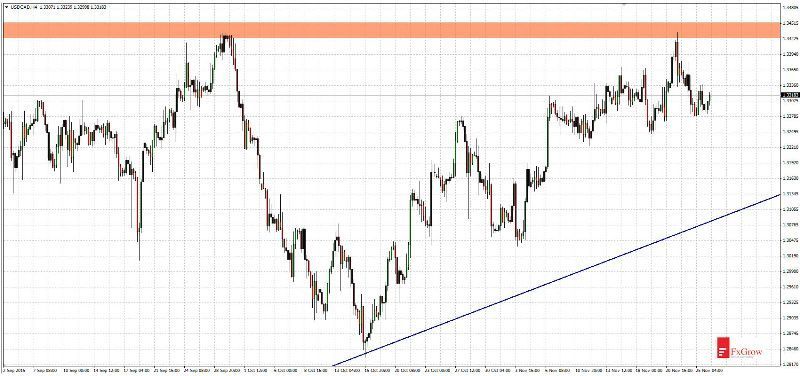
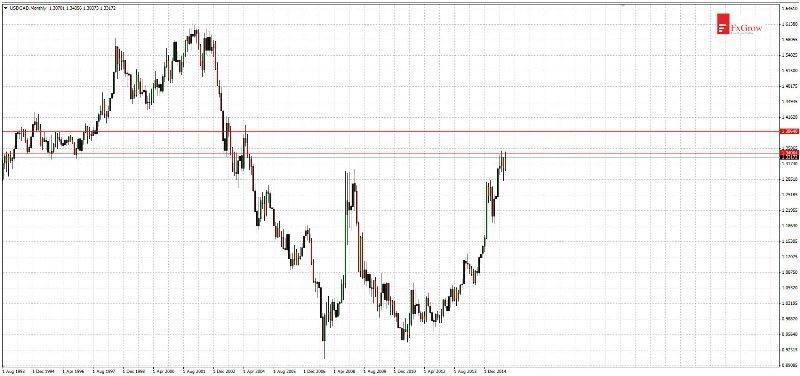
USDCAD - another test of resistance 1.3400 without a deep rebound
On Monday for the second time was tested resistance at level 1.3400. Right now rebound after that test is low. First test was in September 29 and rebound regressed price of 550 pips what took two weeks. In the coming days demand should to carry out another attack at the resistance. Deeper declines appear only when dollar start a correction of the current strengthening. Importance of level 1.3400 is visible only at monthly interval. At this level the price reacted many times in the years 1992-2005. If this resistance will be break above next target for demand is at the level 1.3860. However if there will be a rebound nearest supports are at levels: 1.3280, 1.3180 and 1.3060 which is strengthened by uptrend line.
Time-frame H4
Time-frame Monthly
For more in depth Research & Analysis please visit FxGrow.
Note: This analysis is intended to provide general information and does not constitute the provision of INVESTMENT ADVICE. Investors should, before acting on this information, consider the appropriateness of this information having regard to their personal objectives, financial situation or needs. We recommend investors obtain investment advice specific to their situation before making any financial investment decision.
FxGrow Daily Technical Analysis – 26th Nov, 2015
By FxGrow Research & Analysis Team
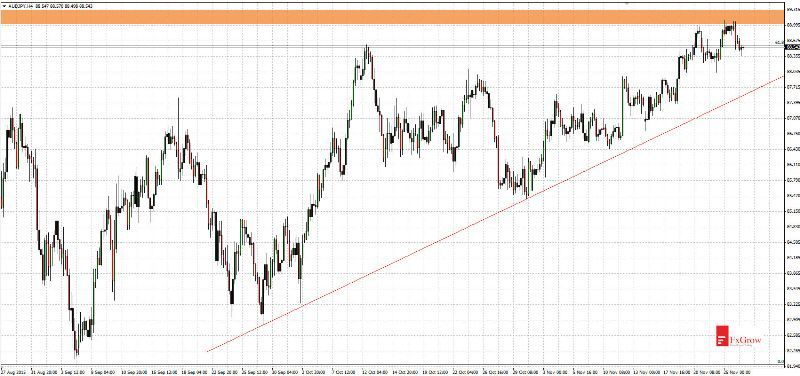
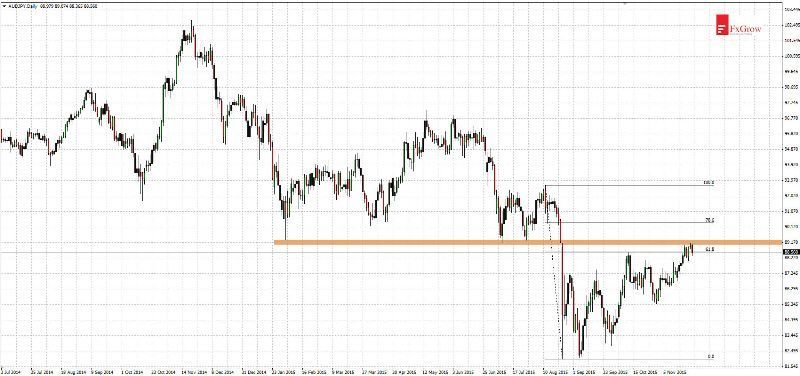
AUDJPY - rebound from important resistance
After dynamic falls in August, AUDJPY did not deepen established lows. Even more upward movement is getting stronger. Demand has exceeded the fibo 61,8% level of August’s downward movement. Strong resistance, which make rebound is the downward gap from August 24. Break above 89.30 will be a strong buy signal.
However at this moment it is more likely that decline will be a little deeper before demand will test for the second time pointed resistance. Nearest supports are at levels 88.10, 87.40, 86.50, 85.50. If 89.30 breaks next resistance is at 90.30 but upward movement could reach much higher.
Time-frame H4
Time-frame D1
For more in depth Research & Analysis please visit FxGrow.
Note: This analysis is intended to provide general information and does not constitute the provision of INVESTMENT ADVICE. Investors should, before acting on this information, consider the appropriateness of this information having regard to their personal objectives, financial situation or needs. We recommend investors obtain investment advice specific to their situation before making any financial investment decision.
FxGrow Daily Technical Analysis – 27th Nov, 2015
By FxGrow Research & Analysis Team
EURJPY - this year’s lows at the viewfinder of supply
Since half year price moves in downward trend. On last Friday supply break below important support at 131.00 level. Today EURJPY drop below 130.00. Nearest target of declines is level 128.80. Below it is strong support at 127.20 level. Currently it is more likely if there won’t be any macro data which could make upward movement, only 127.20 level could make a rebound.
For more in depth Research & Analysis please visit FxGrow.
Note: This analysis is intended to provide general information and does not constitute the provision of INVESTMENT ADVICE. Investors should, before acting on this information, consider the appropriateness of this information having regard to their personal objectives, financial situation or needs. We recommend investors obtain investment advice specific to their situation before making any financial investment decision.
FxGrow Daily Technical Analysis – 27th Nov, 2015
By FxGrow Research & Analysis Team
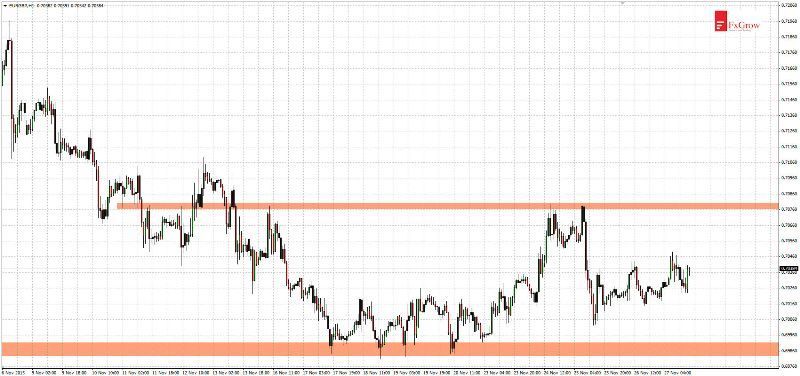
EURGBP - two weeks in consolidation of range 100 pips
EURGBP moves in consolidation after strong wave of sell-off started on mid-October. Price moves between 0.7080 - 0.6980. If price break below support at 0.6980 level next support is low from this year’s July 0.6935. After its break, next support is at 0.6600 level, which was in the game in 2004 - 2007 years. However if supply will be strong enough and 0.7080 level will be break above, next supports are at levels: 0.7100, range: 0.7130 - 0.7150, 0.7200.
For 6 years EURGBP moves in strong downward trend. The next lower lows and lower highs are break by corrections and it confirms current downward trend. Therefore there is more likely break below from the lower limit of that consolidation.
For more in depth Research & Analysis please visit FxGrow.
Note: This analysis is intended to provide general information and does not constitute the provision of INVESTMENT ADVICE. Investors should, before acting on this information, consider the appropriateness of this information having regard to their personal objectives, financial situation or needs. We recommend investors obtain investment advice specific to their situation before making any financial investment decision.
FxGrow Daily Technical Analysis – 30th Nov, 2015
By FxGrow Research & Analysis Team
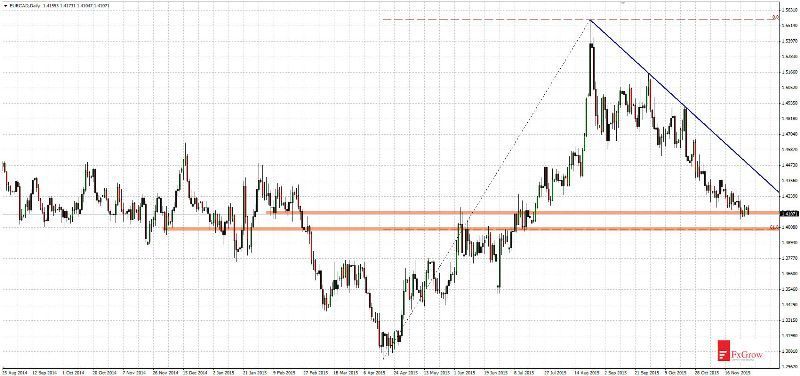
EURCAD - close to break below support
Since 2012 there is a huge volatility at EURCAD. Clear trends last many months, and later there is no consolidation, but new dynamic trends. Since August 2015 from 1.5560 level there is a downward move, which currently approaches fibo 61.8% level. At that level fibo 61,8% coincides with support and round 1.4000. Test of that level should occur during few next sessions.
That level will be a good moment for price to rebound. Even if rebound will not be very strong, it still should occur. Nearest resistances: 1.4260, 1.4360, 1.4550, 1.4640. However if rebound will be too weak and pointed supports will be broken, next base level for bulls can be found at: 1.3760, 1.3560, 1.3400, 1.3230, 1.3100
For more in depth Research & Analysis please visit FxGrow.
Note: This analysis is intended to provide general information and does not constitute the provision of INVESTMENT ADVICE. Investors should, before acting on this information, consider the appropriateness of this information having regard to their personal objectives, financial situation or needs. We recommend investors obtain investment advice specific to their situation before making any financial investment decision.
FxGrow Daily Technical Analysis – 01st Dec, 2015
By FxGrow Research & Analysis Team
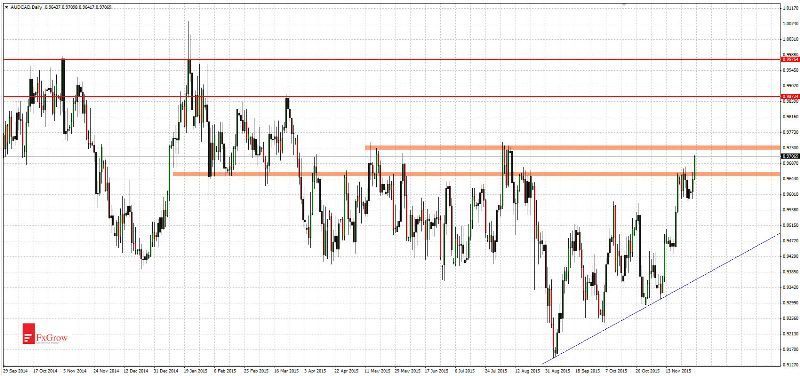
AUDCAD - break above strong resistance, nearest target 0.9750
Today AUDCAD break above strong resistance at 0.9660 and with strong upward candle moving toward next resistance. So high was for the last time in August 2015. During few next sessions it could be a withdrawal and descent should be stopped at new support 0.9660. If another resistance will be break above next base level for bulls can be found at: 0.9870 but it will be hard what I show below.
Wider view, time-frame W1
Since march 2014 AUDCAD moves in downward trend what confirms lower highs and lower lows. However since September 2015 there is a rebound, which is moving to resistance coincides with fibo 50% and downtrend line. Pointed level which should stopped upward movement is 0.9750. Its easy break above will not be easy and should be preceded by consolidation, otherwise the price can quickly return to a downtrend.
For more in depth Research & Analysis please visit FxGrow.
Note: This analysis is intended to provide general information and does not constitute the provision of INVESTMENT ADVICE. Investors should, before acting on this information, consider the appropriateness of this information having regard to their personal objectives, financial situation or needs. We recommend investors obtain investment advice specific to their situation before making any financial investment decision.
FxGrow Daily Technical Analysis – 01st Dec, 2015
By FxGrow Research & Analysis Team
EURUSD - moves up after macro data
Surprising data from the US economy cause dynamic upward movement at EURUSD. The ISM index was lower than forecasts. Instead of the expected 50,4 index dropped to 46,6 which means entry into the recession zone. Currently EURUSD moves under low volatility and since 1,5 months there wasn’t bigger rebound. Also price rebounded today from 1.0570 level which is the last support before this year’s low.
This all may indicate that it’s time for an upward correction. Targets for the bulls are located at: 1.0640, 1.0690, 1.0760. Stronger upward movement is currently unlikely until Thursday, when ECB meeting takes place. The market expects further easing of monetary policy, and this should lead to further declines in EURUSD.
For more in depth Research & Analysis please visit FxGrow.
Note: This analysis is intended to provide general information and does not constitute the provision of INVESTMENT ADVICE. Investors should, before acting on this information, consider the appropriateness of this information having regard to their personal objectives, financial situation or needs. We recommend investors obtain investment advice specific to their situation before making any financial investment decision.
FxGrow Daily Technical Analysis – 02nd Dec, 2015
By FxGrow Research & Analysis Team
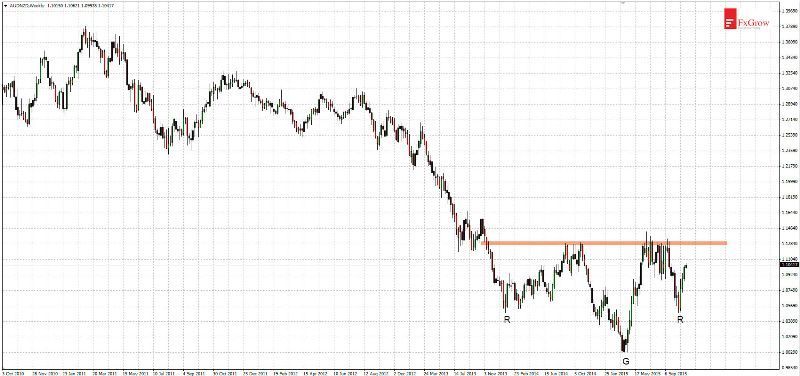
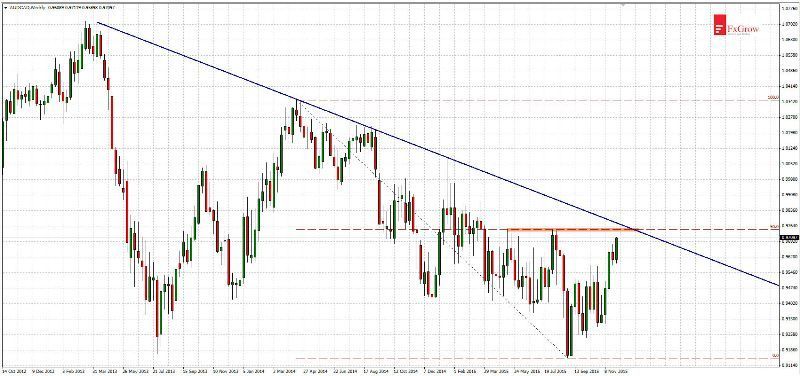
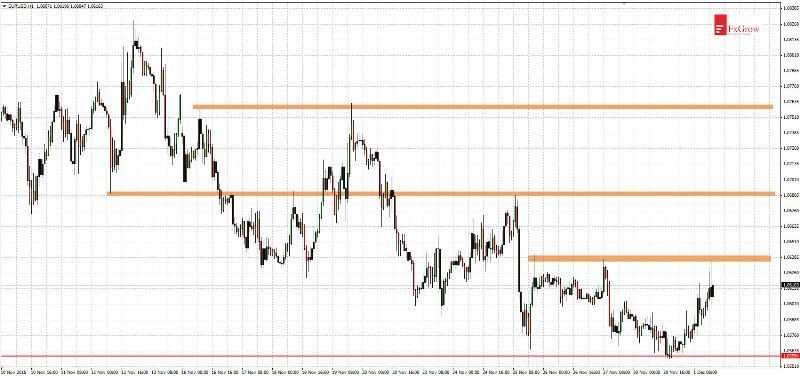
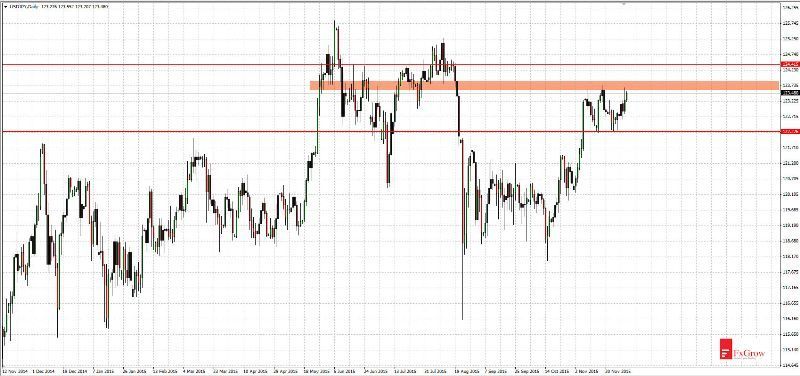
EURNZD - return to downward trend
Yesterday EURNZD broke below important support. This means six months of upward movement has been wrecked. It is worth noticing, that in long term price moves in downward trend. However last dynamic upward movement (observed in August) ended with a very long upper shadow (visible on a monthly time-frame). Currently there could be a rebound to support at 1.6040. That rebound should begin from next support at 1.5820 or from a current level. After price behavior at 1.6040 we should be able to forsee EURNZD further directions. More likely and in line with main trend is return to declines. Nearest supports: 1.5820, 1.5660, 1.5400, 1.5000. Nearest resistances: 1.6040, 1.6210, 1.6350, 6500.
For more in depth Research & Analysis please visit FxGrow.
Note: This analysis is intended to provide general information and does not constitute the provision of INVESTMENT ADVICE. Investors should, before acting on this information, consider the appropriateness of this information having regard to their personal objectives, financial situation or needs. We recommend investors obtain investment advice specific to their situation before making any financial investment decision.
[B]FxGrow Daily Technical Analysis – 02nd Dec, 2015[/B]
[I]By FxGrow Research & Analysis Team[/I]
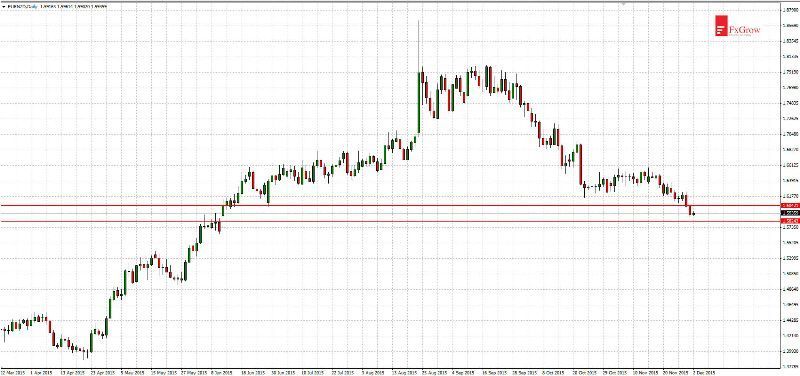
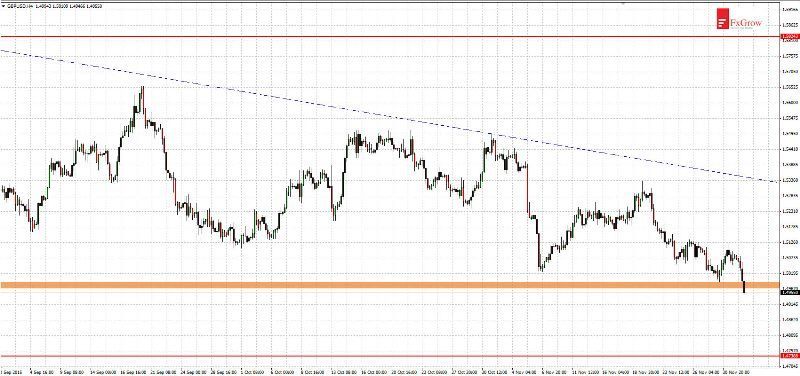
[B]GBPUSD – attempts of support defense at 1.5000 level[/B]’
GBPUSD began this week at new 6-months low. And today after one-session break, price deepened the low. If support at 1.5000 breaks, nearest target will be at: 1.4740 and next at area 1.4600-1.4565 which is a 5-year low. Alternatively if rebound occurs, the next resistances will be at: 1.5120, 1.5240, 1.5370.
Perspective of the first rate hike in USA causes the dollar strengthening against most of the currencies. Further direction of GBPUSD movement is dependent on Friday’s Non-farm Payrolls.
[B][I]For more in depth Research & Analysis please visit FxGrow.[/I][/B]
[I][B]Note:[/B] This analysis is intended to provide general information and does not constitute the provision of INVESTMENT ADVICE. Investors should, before acting on this information, consider the appropriateness of this information having regard to their personal objectives, financial situation or needs. We recommend investors obtain investment advice specific to their situation before making any financial investment decision.[/I]
[B]FxGrow Daily Technical Analysis – 03rd Dec, 2015[/B]
[I]By FxGrow Research & Analysis Team[/I]
[B]USDJPY - another attempt of breaking above consolidation upper limit[/B]
Since a month USDJPY moves in a consolidation between 122.20 - 123.60, yesterday we saw an unsuccessful attempt of breaking above consolidation upper limit. That breakout may occur today, after ECB meeting or tomorrow after Non-farm Payrolls. If upper limit of consolidation breaks, next resistances will be seen near: 124.40, 125.10. Alternatively if price moves down next supports will be at levels: 121.40, 120.30, 118.80.
In a long term, since 2012 USDJPY moves in an uptrend. However since six months we did not see a new high. It is possible that the correction is coming to an end which is currently more likely than trend reversal. Breaking above year-to-date high (125.85) will signal that price returned to an uptrend.
[B][I]For more in depth Research & Analysis please visit FxGrow.[/I][/B]
[I][B]Note:[/B] This analysis is intended to provide general information and does not constitute the provision of INVESTMENT ADVICE. Investors should, before acting on this information, consider the appropriateness of this information having regard to their personal objectives, financial situation or needs. We recommend investors obtain investment advice specific to their situation before making any financial investment decision.[/I]
[B]FxGrow Daily Technical Analysis – 03rd Dec, 2015[/B]
[I]By FxGrow Research & Analysis Team[/I]
[B]EURUSD - earth quake after ECB meeting[/B]
Today ECB meeting took place. Expectations about further easing monetary policy were huge and… have failed. Also in the previous analysis I have indicated the possibility of rebound, I wrote: “Currently EURUSD moves under low volatility and since 1,5 months there wasn’t bigger rebound”, “this all may indicate that it’s time for an upward correction. Targets for the bulls are located at: 1.0640, 1.0690, 1.0760”.
After the ECB decision and press conference by Mario Draghi, EURUSD made unpredictable upward move of 371 pips in 1,5 hours. Firstly support at 1.0520 was tested, and nextly price reached resistance at 1.0890 level which is strengthen by Fibonacci 38,2% of last downward movement. Tomorrow will be another important event - non-farm payrolls - and reaction to it could be also violent. If upward movement will be continued next resistances are located at: 1.1000, 1.1120. If price will return to declines next supports are at 1.0810, 1.0690.
[B][I]For more in depth Research & Analysis please visit FxGrow.[/I][/B]
[I][B]Note:[/B] This analysis is intended to provide general information and does not constitute the provision of INVESTMENT ADVICE. Investors should, before acting on this information, consider the appropriateness of this information having regard to their personal objectives, financial situation or needs. We recommend investors obtain investment advice specific to their situation before making any financial investment decision.[/I]
FxGrow Daily Technical Analysis – 04th Dec, 2015
By FxGrow Research & Analysis Team
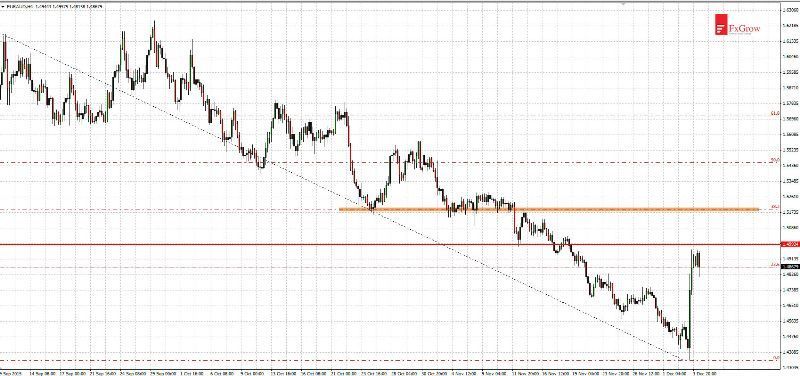
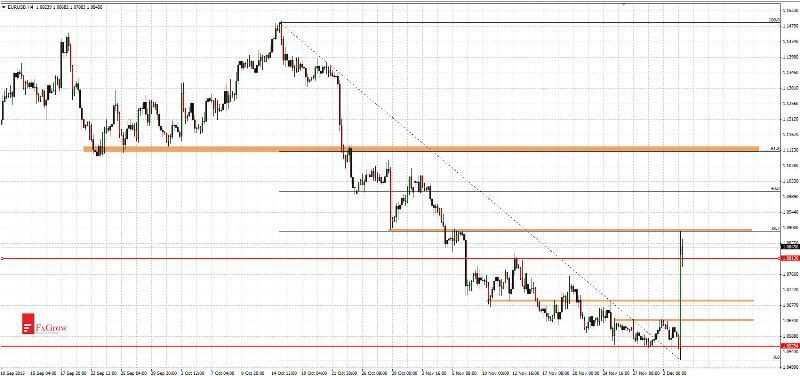
EURAUD - dynamic upward movement, but this is only a correction
Since August 2015 EURAUD moves in downward trend. Yesterday price dynamically rebounded from support area 1.4350 and within a few hours made upward movement (620 pips). Awaken expectations after Thursday ECB meeting helped here a lot: central bank didn’t extend QE program what was expected.
However market overreacted and that was caused not due to the lack of correction for a long time but due to the ECB. Current rebound has to be treated just like a correction before new wave of falls. Today price reached Fibonnaci 23,6% 1.4870 and resistance 1.4990. But rebound can reach higher, good level is Fibonacci 38,2% at 1.5200. Don’t forget about today’s very important data from US economy which may cause volatility on the market (similiar to the yesterday’s one).
For more in depth Research & Analysis please visit FxGrow.
Note: This analysis is intended to provide general information and does not constitute the provision of INVESTMENT ADVICE. Investors should, before acting on this information, consider the appropriateness of this information having regard to their personal objectives, financial situation or needs. We recommend investors obtain investment advice specific to their situation before making any financial investment decision.