Daily Technical Analysis by FxGrow

FxGrow Fundamental Analysis – 21st March, 2017
By FxGrow Investment Research Desk

Oil levels Declines Over Concerns Of Bloated U.S Storage, Awaiting U.S Inventories

Fundamentals :

Oil prices dipped on Wednesday at 47.80 low as rising crude stocks in the United States underscored an ongoing global fuel supply overhang despite an OPEC-led effort to cut output. U.S. crude oil inventories surged by 4.5 million barrels in the week to March 17 to 533.6 million barrels, the American Petroleum Institute (API) said late on Tuesday.

“The American Petroleum Institutes’ crude inventories stuck the knife into crude overnight, coming in at a 4.5 million barrel increase against an expected increase of 2.8 million barrels,” said Jeffrey Halley, senior market analyst at futures brokerage OANDA in Singapore.

“If the API stuck the knife in, tonight’s EIA Crude Inventory figures may twist it. A blowout above the 2.1 million barrel increase expected, may well torpedo oil below the waterline,” he added.

New production projects and a fresh shale boom could boost oil output by a million barrels per year and result in an oversupply in the next couple of years, according to Goldman Sachs.

OPEC’s landmark decision to limit output for the first time in eight years in a bid to arrest the existing supply glut reduced price volatility and increased stability, unintentionally helping the shale producers, the bank said.

“OPEC’s decision in November 2016 to cut production was rational, in our view, and fit into its role of inventory manager of last resort,” Goldman said.

“However, the unintended consequence was to underwrite shale activity through a bullish credit market at a time when delayed delivery of the 2011-13 capex boom could lead to record non-OPEC production growth in 2018.”

The Organization of the Petroleum Exporting Countries (OPEC) agreed to curb its output by about 1.2 million barrels per day (bpd) from Jan. 1 this year. Russia and 10 other non-OPEC producers agreed to jointly cut by an additional 600,000 bpd.

Sources within the Organization of the Petroleum Exporting Countries have indicated that its members increasingly favor extended production cuts but want the backing of non-OPEC oil producers, such as Russia, which have yet to deliver fully on existing reductions. ( CNBC )

PEC compliance in Feb 2017 was estimated over 94% which helped oil boosters to sustain levels above $52 bp on average but the war continues between the US and OPEC counties with opposed interests.

Russia has reduced oil production through first 2017 quarter by 200000 bpd and promised to increase further reductions to 300000 bdp by end of April or May with OPEC plan being in accord. According to sources to CNBC, OPEC is on the edge of striking a powerful strike where the cartel is considering extending initial Vienna deal till end of 2017 if OPEC and Non-OPEC counties agree to further oil reduction to curb market demand, but details about quotas were not specified. Markets, although OPEC next move is currently cooked in a low steam, are looking forward for such deal in which, in case established or achieved, should energize oil bullish levels back to Feb 2017 prices.

Conclusion : Currently US has the upper with increase shale drilling and inventories storage. The rift continues and the war tone is ascending between U.S and OPEC, each trying to drive oil levels higher and lower depending on their economic interests. Keep an eye on OPEC next chess move which will set oil course for the coming weeks. Look forward for U.S crude inventories today set for a release at 2:30 PM GMT.
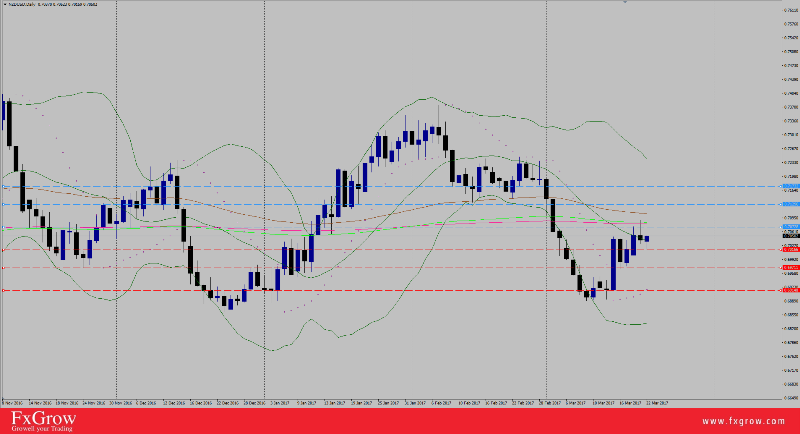
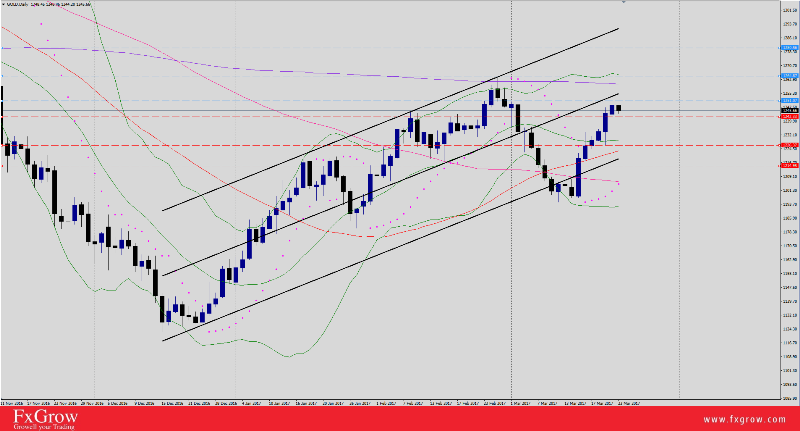
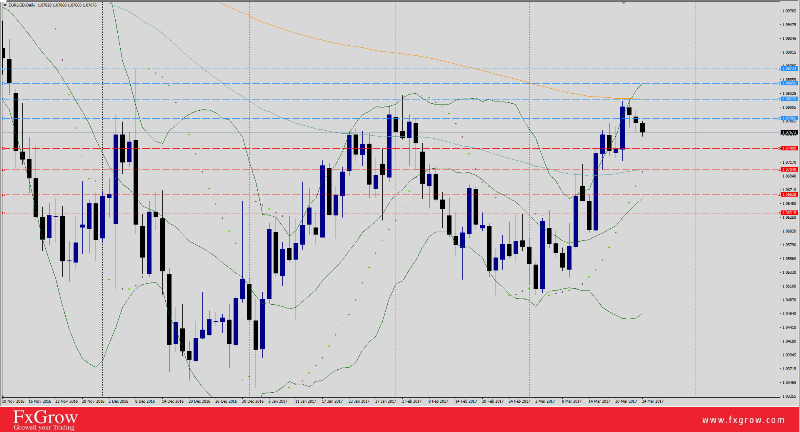
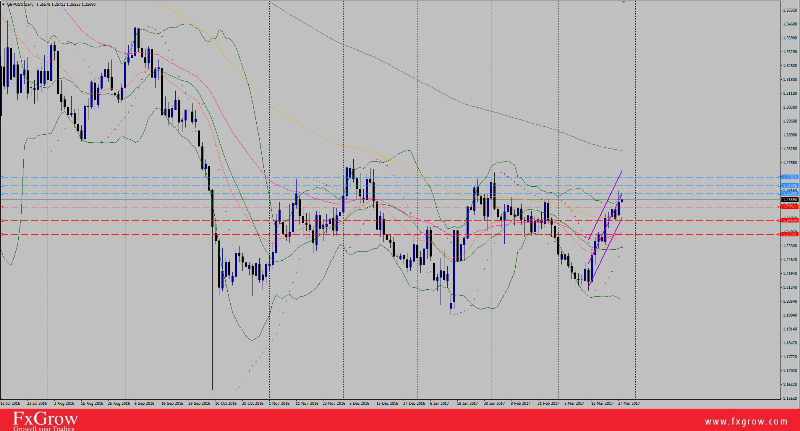
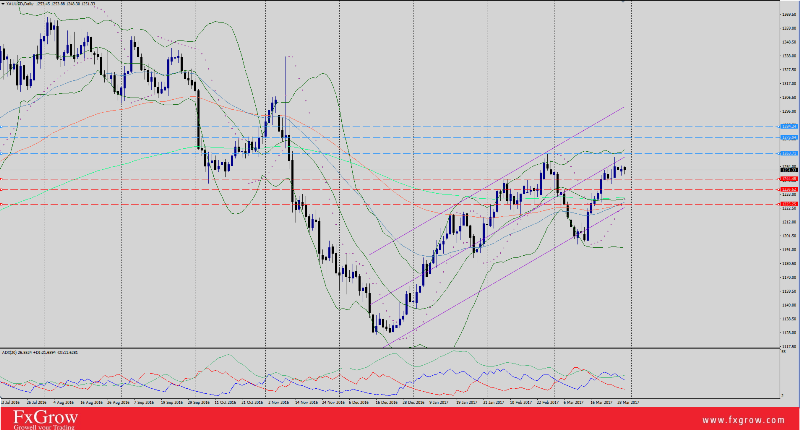
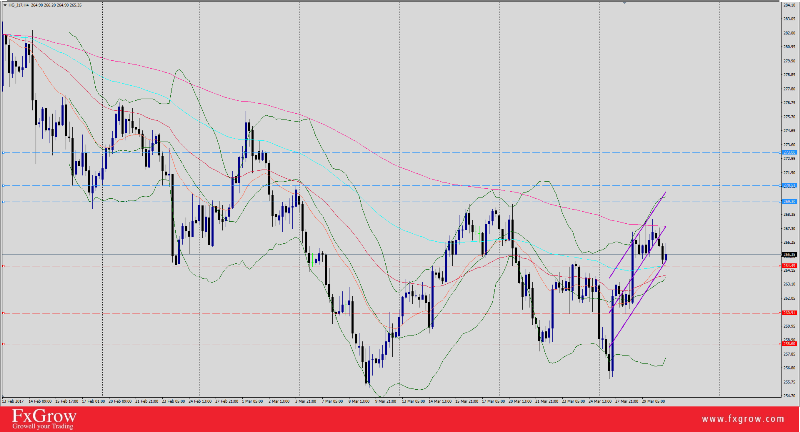
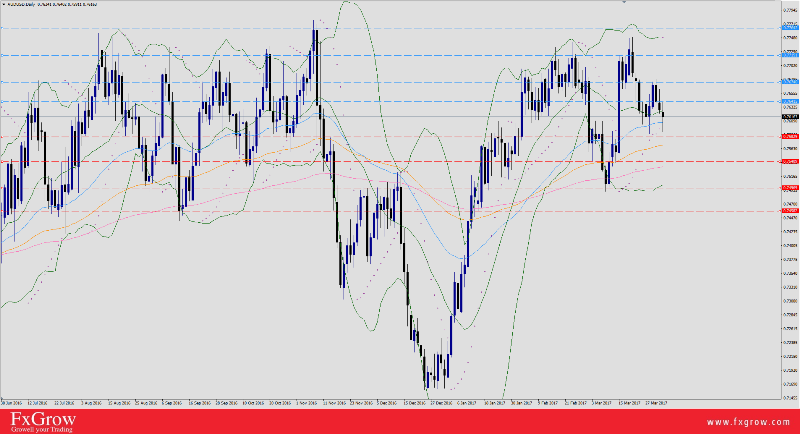
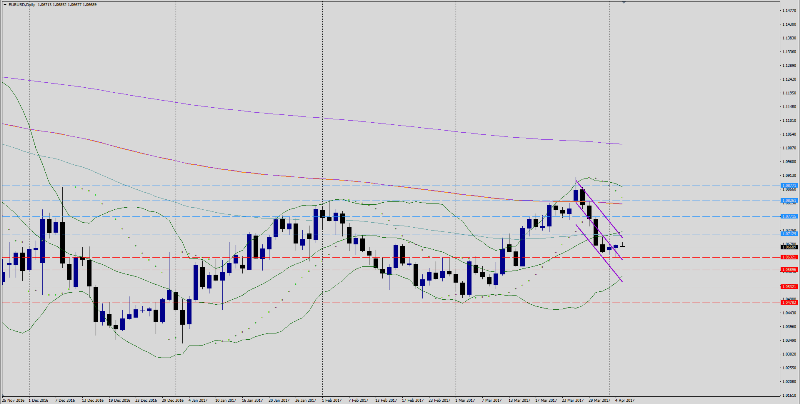
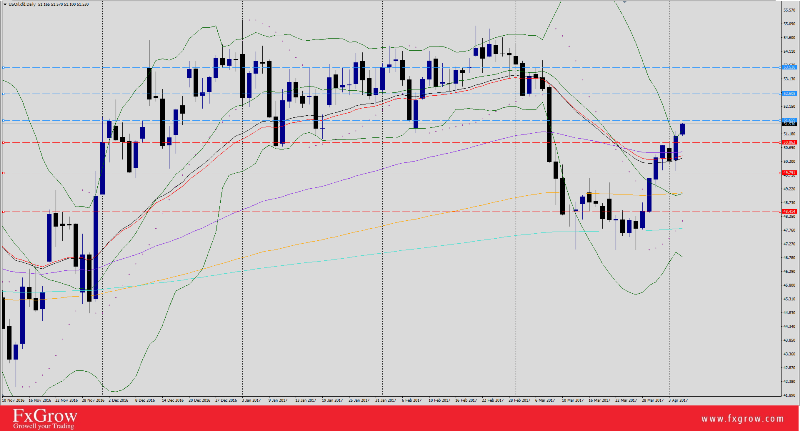
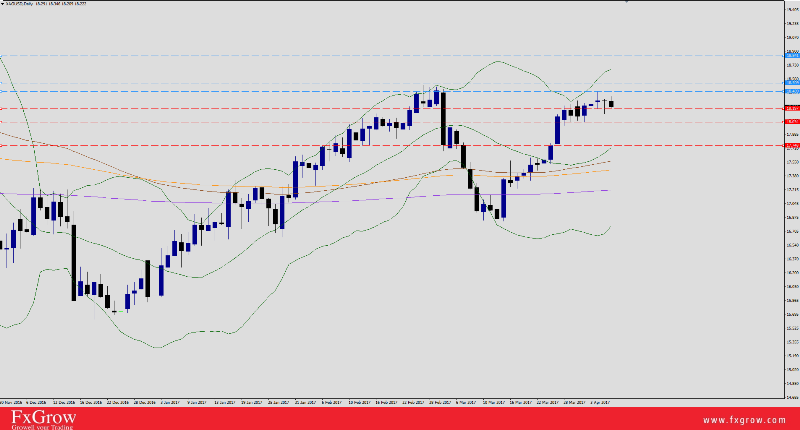
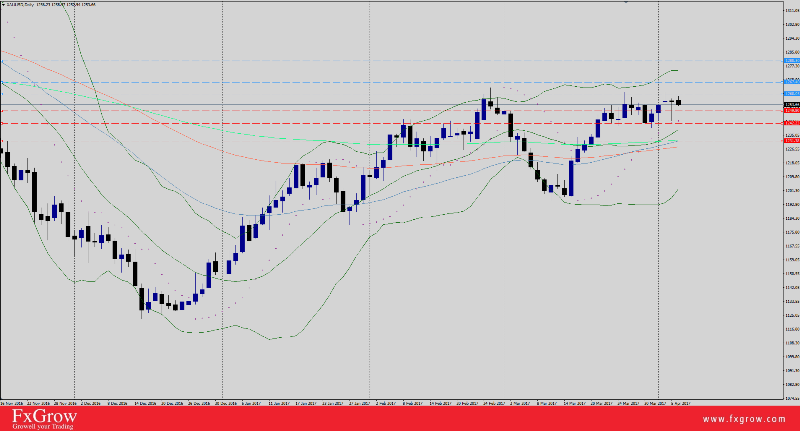
Technical Overview

The market currently bearish due to the above mentioned data, but OPEC keep an eye on OPEC coming moves. If OPEC managed to struck the deal with extension till end of 2017, crude levels will sustain the $50>$52 levels. In absence of news from Organization of the Petroleum Exporting Countries, markets should expect further declines with $47<$46 as targets.

For more in depth Research & Analysis please visit FxGrow.

Note: This analysis is intended to provide general information and does not constitute the provision of INVESTMENT ADVICE. Investors should, before acting on this information, consider the appropriateness of this information having regard to their personal objectives, financial situation or needs. We recommend investors obtain investment advice specific to their situation before making any financial investment decision.

FxGrow Fundamental Analysis – 22nd March, 2017
By FxGrow Investment Research Desk

Kiwi Trades flat Ahead of RBNZ’s Wheeler Speech

NZD/USD rallied yesterday to 0.7089 high following positive Global Diary Trade (GDT) with 1.7% compared to -6.3% on previous session. Kiwi boosters found comfort with collapsing U.S Index yesterday with 99.44 low. Today, the pair has managed to recover few pips from session low and is currently trading around 0.7032 handle. A fresh wave of global risk aversion, coupled with a modest US Dollar recovery from multi-week lows, has been key factors weighing on the major on Wednesday.

Eyes now are focused on RBNZ interest rate decision with high forecasts that rates to be left at current 1.75%. However, since rates are a done deal, the market will be looking for any hawkish signasl they can find from Gov Wheeler. This central bank is notorious for talking their currency down and Gov Wheeler may take this opportunity to drive the currency lower. However, if he sounds more upbeat or offers any hawkish hints there may be an opportunity to buy the kiwi.

Fundamentals:

1- NZD Interest Rate Decision today at 8:00 PM GMT.

2- NZD RBNZ Wheeler speech today at 8:00 PM GMT.

3- USD Unemployment Claims tomorrow at 12:30 PM GMT.

4- USD speech tomorrow at 12:45 PM GMT.

Technical:

Trend: Bearish Sideways

Resistance levels : R1 0.7072, R2 0.7129, R3 0.7132

Support levels : S1 0.7016, S2 0.6971 , S3 0.6914

Remark : Look forward for Kiwi local data today. U.S data tomorrow not to be missed especially Yellen speech which will determine U.S index levels for the coming days.

For more in depth Research & Analysis please visit FxGrow.

Note: This analysis is intended to provide general information and does not constitute the provision of INVESTMENT ADVICE. Investors should, before acting on this information, consider the appropriateness of this information having regard to their personal objectives, financial situation or needs. We recommend investors obtain investment advice specific to their situation before making any financial investment decision.

FxGrow Fundamental Analysis – 23rd March, 2017
By FxGrow Investment Research Desk

Gold Seeks Further Gains Over Crisp U.S Dollar, Eyes on Yellen

Gold has prolonged bullish trading session with a 1251.34 high yesterday and currently, XAUUSD is confined 47-pips range price action, slightly above 50-SMA (H1). Overall, gold added +$53.89 since March Fed hike. USD collapsed dramatically on Tuesday and extended losses yesterday at 99.32 low, digging deeper for 2017-new-lows at 99.19, which supported gold bullish momentum.

History and logic suggest that when the United States starts a monetary tightening cycle, gold will under-perform, since as a non-yielding asset it loses out to instruments that will enjoy higher yields from the rising rates.

According to the World Gold Council (WGC), China’s gold demand has dropped this year, with third quarter consumer demand at 182.5 tons, down 22% from the same period in 2015, while India’s 194.8 tons is 28% lower. Analysts are expecting China’s and India’s gold demand to remain steady in 2017… China and India are the world’s biggest gold-consuming nations.

Today, U.S economic data is heavy first with Unemployment claims which in case positive, should re-balance U.S index levels with upward correction, but the main focus is on Yellen speech and traders will try to decipher words and signals out of her speech.

Fundamentals:

1- USD unemployment rate today at 12:30 PM GMT.

2- USD Yellen speech today at 12:45 PM GMT.

Technical :

Trend : Bullish Sideways

Daily Pp 1247

Resistance levels : R1 1252.20, R2 1264.87, R3 1280.76

Support levels : S1 1242.33, S2 1230.62, S3 1218.83

Remark : Overall gold is bullish but U.S data today is vital especially Yellen speech in relation with low USD levels. Stalling above R1 level is a Déjà vu of last 2 weeks rallies with R2 level as target. Closing above R2 projects further bullish attacks at R3 level. A stall around 1251 could prompt setbacks, but trade should hold within Tuesday’s range to maintain strong bull forces. Closing below S2 alerts for trend reversal and market to consider gold bearish. U.S index is the main player.

For more in depth Research & Analysis please visit FxGrow.

Note: This analysis is intended to provide general information and does not constitute the provision of INVESTMENT ADVICE. Investors should, before acting on this information, consider the appropriateness of this information having regard to their personal objectives, financial situation or needs. We recommend investors obtain investment advice specific to their situation before making any financial investment decision.

FxGrow Fundamental Analysis – 23rd March, 2017
By FxGrow Investment Research Desk

Wallowing U.S Index and Supper Yellen with Possible Scenarios

Since FOMC epic decision with 0.25% hike to initial 0.75%, U.S Index has collapsed dramatically. After peeking to $102.26 Feb-highs, the Index has shed -$2.94 and anchored yesterday at $99.32, closing to 2017 lowest at $99.19. Below are the factors contributing to bearish U.S Index Foreces.

1- Markers had already priced in and traded on the fact that Fed hike was inevitable. So basically, the FOMC decision had zero contribution to the market "Buy the rumor sell the fact " fitted like the last peace of puzzle and the USD decline picture was drawn.

2- Traders were awaiting further instructions by Yellen and Co. about coming Fed hikes, but details were not listed.

3- Doubts about Trump’s capacity to provide the right leadership for Republican party have been creeping into the market fueled by allegations about links of his election campaign with relation to Russian contributes and recent Trump’s real estate bought by Russians as Greg Gibbs, Director at Amplifying Global FX Capital pointed yesterday. Also Trump’s bombastic style including wild claims about wire taps for the white house when he addressed journalists in previous appearances.

Fact : Combine these above elements, no wonder why U.S Index has tumbled and in case of further declines, it’s logic.

Now after we have briefed the above, the real question is, How will Yellen play along today when she appears preceded by U.S Unemployment Claims. If Yellen came out with promises about coming hikes, markets will start pricing in and trading on her words and the whole cycle ( U.S Index ) will be repeated again as Déjà vu. Recent speeches of FOMC’s members Dudley and Evans with their declrelations supports the coming scenario further more. So, Yellen will try to avoid this scenario and turn into different aspect in which she will focus on how strong the U.S economy is supported by positive unemployment data, inflation rate, recent CPI, NFP, and retails sales which should boost U.S Index to a 100.46 where trend will make a reverse and turn bullish.

Remark: Previous unemployment claims were 240K and forecasts for today are 241, narrowing down the gaps between the number, skepticism or confusion about comparison between recent, initial, and forecasts will be tight. Traders always tend to read the data in different way when recent is more than forecasts but less then previous, along with it, bearish and bullish volatility.

For more in depth Research & Analysis please visit FxGrow.

Note: This analysis is intended to provide general information and does not constitute the provision of INVESTMENT ADVICE. Investors should, before acting on this information, consider the appropriateness of this information having regard to their personal objectives, financial situation or needs. We recommend investors obtain investment advice specific to their situation before making any financial investment decision.

FxGrow Fundamental Analysis – 24th March, 2017
By FxGrow Investment Research Desk

EUR/USD Guarding Tuesday’s Gains Ahead of Local Data

EUR/USD inaugurated Friday’s trading sessions with aggressive selling and lost -26-pips after clocking a high 1.0786. The pair peeked to 1.0819 on Monday and prolonged additional 5-pips on Tuesday over arousing political optimism driven by Netherlands recent elections and French polls claiming Macron ahead of Le Pen ( Anti EU). However, the political optimism was jinxed by stingy reviving U.S Index today with a 99.79 high today.

Yesterday, U.S unemployment claims were negative with 258K compared to 241K on previous sessions but markets were focused on Yellen speech, and as always, Yellen will always be Yellen with her vague hints. Markets were expecting a support for U.S Index justified by Yellen timing and collapsing U.S Index, but the lady didn’t even comment on monetary policy. Eyes today are shifted towards Trump health care program which should boost U.S Dollar up or down, depending on the final outcome.

Today, EU economic pocket is heavy from French and Germany, services and manufacturing PMI, which will give an estimate on how the EU economy is heading and it’s health.

Fundamentals :

1- EUR - French Flash Manufacturing and services PMI today at 8:00 AM GMT.

2- -EUR - German Flash Manufacturing and services PMI today at 8:30 AM GMT.

3- EUR - EU Flash Manufacturing and services PMI today at 9:00 AM GMT.

4- USD - Core Durable Goods Orders today at 12:30 PM GMT.

Technical :

Trend : Bullish Sideways

Resistance levels : R1 1.0790, R2 1.0822, R3 1.0843, R4 1.0866

Support levels : S1 1.0744, S2 1.0705, S3 1.0662, S4 1.0635

Remark :Currently the pair is still considered bullish due to weaker U.S Dollar with sideways options due to the ebb and flow between EUR and USD. The above variety of economic news will decide how cable trend will settle in the coming hours. Keep an eyes on U.S index with coloration of U.S data and Trump health care voting today.

For more in depth Research & Analysis please visit FxGrow.

Note: This analysis is intended to provide general information and does not constitute the provision of INVESTMENT ADVICE. Investors should, before acting on this information, consider the appropriateness of this information having regard to their personal objectives, financial situation or needs. We recommend investors obtain investment advice specific to their situation before making any financial investment decision.

FxGrow Fundamental Analysis – 24th March, 2017
By FxGrow Investment Research Desk

USD/CAD Remains Bullish Despite Bearish U.S Dollar

Although U.S Dollar is toothless for the past 12 consecutive sessions with 99.32 weekly-fresh-lows, USD/CAD remained bullish today and confined with 31-pips price action. Unlike USD rivals, the Loonie failed to take advantage of weaker U.S Dollar, tailed by collapsing crude oil levels for the past 2 weeks. The pair clocked 1.3377 high and currently shifting sail course and reversing daily bullish candle to inverse hammer candle supported by rising crude oil levels. The pair is currently trading 1.3354, slightly above its daily Pp 1.3341.

Loonie economic data is colorful today, but the main focus will be on Consumer Price Index ( CPI ), taking into consideration that inflation currently has reached 2.13%. Today’s data could be an indicator for the coming BOC meeting for interest rates.

Fundamentals:

1- CAD - CPI today at 12:30 PM GMT.

2- CAD - CPI common, CPI median, and CPI trimmed y/y today at 12:30 PM GMT.

3- USD - Core Durable goods today at 12:30 PM GMT.

Technical :

Trend : Bullish sideways

Resistance levels : R1 1.3408, R2 1.3463, R3 1.3535

Support levels : S1 1.3315, S2 1.3247, S3 1.3174

Remark : Keep an eyes on U.S Index levels as its a measurement for USD/CAD performance. Also, Canadian today is vital on the short and long run.

For more in depth Research & Analysis please visit FxGrow.

Note: This analysis is intended to provide general information and does not constitute the provision of INVESTMENT ADVICE. Investors should, before acting on this information, consider the appropriateness of this information having regard to their personal objectives, financial situation or needs. We recommend investors obtain investment advice specific to their situation before making any financial investment decision.

FxGrow Fundamental Analysis – 27th March, 2017
By FxGrow Investment Research Desk

EUR/USD Gaps Upward and U.S Index Downward, Eyes on German Ifo

EUR/USD inaugurated Monday trading session with a +23-pips upward and added additional gains +23-pips with 1.0849 high supported by Friday’s positive Data and overwhelming political optimism . On the other hand, U.S index prolonged the bearish momentum for the second week in a row, and today the Index gaped downward with -$.042, and bottomed at 99.06 11-Nov-2016 fresh lows.

On Friday, markets were awaiting for the white smoke coming from of Trump’s oval office with a positive vote to replace Obamacare health program, but unfortunately, a darker smoke was instead which added more negative weight and pressured U.S Dollar facing its classic rival EURO. Currently the pair is trading 1.0849, with one pip difference to re-reach today’s high indicating additional bullish waves for the cable as a reminder of 2016 glorious levels for EUR/USD. In addition to that, Firday’s heathcare decision consecqunces are still to impact USD.

Analysts at ANZ explained that the failure of Donald Trump’s replacement healthcare bill to make it through congress will be viewed by the market as a major setback for the ‘Trump trade’ (although market moves late on Friday were a little surprising).

Fundamentals :

1- EUR- German Ifo Business climate today at 9:00 AM GMT.

2- EUR- M3 Money Supply y/y today at 9:00 AM GMT.

3- EUR - Private Loans y/y today at 9:00 GMT.

4- USD - FOMC member Evans speech at 6:15 AM GMT.

Technical :

Trend : Bullish

Resistance levels : R1 1.0873, R2 1.0908, R3 1.0949.

Support levels : S1 1.0819, S2 1.0759, S3 1.0673

Remark : Taking the current situation of collapsing, the market posture is bullish and signals for a larger emerging upswing, hinting for a trending drive towards R2 level. Stable action over 1.800+ will encourage follow through rallies. A full retraction of Tuesday’s range is needed to flip trade to a correction page, but only a close below S3 level is needed for trend reversal and the market to consider the cable bearish. EU data not be missed today, in addition to that, FOMC member Evans speech today where markets should look for hawkish tilts which might lift or save U.S Index from further declines.

For more in depth Research & Analysis please visit FxGrow.

Note: This analysis is intended to provide general information and does not constitute the provision of INVESTMENT ADVICE. Investors should, before acting on this information, consider the appropriateness of this information having regard to their personal objectives, financial situation or needs. We recommend investors obtain investment advice specific to their situation before making any financial investment decision.

FxGrow Fundamental Analysis – 27th March, 2017
By FxGrow Investment Research Desk

Japanese Yen Holds a Ruthless Grip Over Softer US Dollar

Japanese Yen launched Asian trading sessions with a sharp strong tone facing pale greenback supported by positive summary by BOJ and Services Producer Price Index SPPI 0.8% compared to 0.5% on previous sessions. The pair penetrated the taboo support level (110.60) aggressively with 110.25 22-Nov-2016-fresh lows, from which bull forces rallied at 103.71 7-Nov-2016 low. Overall, USD/JPY has shed -79-pips as price action, trading below 200 SMA (111.17 D1), and it is expected to drift downward further more given the current circumstances.

BOJ Summary was as follows :

1- Japan’s economy has continued its moderate recovery trend and Private consumption has been resilient against the background of steady improvement in the employment and .

2- Exports and production have remained firm on the back of a global pick-up in manufacturing, mainly supported by IT-related goods.

3- Japan’s economy is likely to continue to recover in line with the path we expect, backed by synergy effects of the government’s large-scale stimulus package and the Bank’s monetary easing measures, with improvements in overseas economies.

4- Japan’s economy is projected to continue to see moderate recovery toward fiscal 2018 unless downside risks stemming from developments in overseas economies materialize, such as a rise of protectionism, political and economic instability in Europe, and an increase in geopolitical risks in the Middle East and Asia.

On the other hand, US Dollar was bearish for the second consecutive week with a clear signal for additional bearish forces as the Index gaped downward -$0.42 and dug deeper at 99.06, 2017-new-lows. Trump’s health care voted with an annulment on Friday showed Republicans weak trying to replace ex-Democratic Obamacare health program, which added additional question mark around Trump’s capacity to lead the free world nation (USA), and consequences are expected to dilate further more as U.S Wallstreet opens.

Fundamentals :

1- USD - FOMC Member Evans speech today at 6:15 PM GMT.

2- USD - CB Consumer Confidence tomorrow at 3:00 PM GMT.

3- USD FOMC Member Kaplan speech tomorrow at 6:00 PM GMT.

Technical:

Trend : Bearish

Resistance levels : R1 111.33, R2 112.38, R3 113.33

Support levels : S1 110.25, S2 109.33, S3 108.20

Trend : Bearish Sideways

Remark : Current situation of low U.S Index and positive Japanese Data signals for further dips for USD/JPY. Negative decision on Trump’s healthcare program will still tail for the coming trading hours and market should expect further declines for US Dollar.Also, FOMC members appearance this week is heavy, traders should watch for hawkish hints regarding coming U.S Fed hikes with efforts to rescue U.S Index.

A penetration for S1 will increase further selloffs and wash towards S2 level. A close below S2 level projects additional bear forces for the cable but be careful from setback as a test on support levels. Keep in mind that below S3 level is a threat for USD/JPY Nov-2016 rallies. A close above R2 level is an alert for trend reversal and above R3, bullish trend will re-confirmed once again.

For more in depth Research & Analysis please visit FxGrow.

Note: This analysis is intended to provide general information and does not constitute the provision of INVESTMENT ADVICE. Investors should, before acting on this information, consider the appropriateness of this information having regard to their personal objectives, financial situation or needs. We recommend investors obtain investment advice specific to their situation before making any financial investment decision.

FxGrow Fundamental Analysis – 28th March, 2017
By FxGrow Investment Research Desk

GBP/USD Clocks Two Months High Ahead of Article 50 Release

Sterling was the talk of the market yesterday with a 1.2615 high and extended the bearish momentum for the 10th consecutive sessions. Although the pair lost -47-pips as price action since yesterday, the pair successfully sustained the 1.25 handle and currently trading 1.2568 intraday. Overall, GBP/USD rallied 471-pis since the U.S Fed hike, till yesterday high, and the pair is preparing for additional bullish waves due to soaring U.S Index yesterday with 98.65 2017-fresh-lows.

On the other hand, UK demands a final departure politically and financially from the EU. Political is by PM May releasing article 50 on the 29th of March which will set a new course for UK, but before that, PM May met with Scottish PM Nicola Sturgeon. Sturgeon has called for a second Scotland independence referendum, against May’s will, but the terror attack from last week has interrupted the tense relations between them both. After officially lunching the Brexit, the UK will have two years to negotiate new arrangements, after which it will no longer be subject to EU treaties.

On the Financial level, The EU has to make up a budget gap once the Brexit becomes official. Britain’s exit from the European Union indicates that one of the bloc’s biggest economies will stop making donations to its budget. This arouses questions as to how long the U.K. will proceed to pay its share of the budget and how can the EU fill the blacnk once Britain has officially left. The U.K. has already said it will not pay a 60 billion euro ($64.73 billion) bill to departure the bloc – money that according to the EU would be used for the U.K.'s share of commitments to the pensions of its workers and U.K.-based projects that have already received funding approval. At the same time, some member states have already told Brussels that the UK are not willing to pay more into the EU budget to compensate for the U.K.'s divorce. (CNBC)

Fundamentals:

1- USD - Goods Trade Balance today at 1:30 PM GMT.

2- USD- CB Consumer Confidence today at 3:00 PM GMT.

Technical :

Trend : Bullish Sideways

Resistance levels: R1 1.2598, R2 1.2640, R3 1.2682

Support levels : S1 1.2531, S2 1.2462, S3 1.2392

Remark : Given the current situation of pale greenback trading 98.96, and GBP/USD significant rallies Sterling has the upper hand which supports the pair’s bullish forces. Closing above R1 restores confidence for Sterling and the pair has the tendency to climb to R2 level. On the other hand, stalling below S1 will increase further selloffs and wash towards S2 level signaling a beginning for trend reversal. Closing below S2 is a confirmation that bearish forces has taken control and market to consider GBP/USD bearish with a reminder that the pair collapses intensively on psychological level. Political issues such as article 50 and Scottish referendum are vital for Sterling levels on the fundamental level.

For more in depth Research & Analysis please visit FxGrow.

Note: This analysis is intended to provide general information and does not constitute the provision of INVESTMENT ADVICE. Investors should, before acting on this information, consider the appropriateness of this information having regard to their personal objectives, financial situation or needs. We recommend investors obtain investment advice specific to their situation before making any financial investment decision.

FxGrow Fundamental Analysis – 29th March, 2017
By FxGrow Investment Research Desk

GBP/USD Digests Monday’s Gains Ahead of Article 50 Release

Sterling lost the sharp tone yesterday and went to a softer one today as UK gears up for the historic release for Article 50. GBP/USD bled -239-pips since Monday and plunged to 1.2376 low today over fears of consequences of what might outcome as PM releases the article. Traders has abandoned buying positions of GBP/USD high levels and left the pair to cast at lower levels with aggressive selling. On the other hand, U.S Index is showing a minor recovery today, with +$0.71 increase following positive U.S Consumer Confidence release yesterday with a positive 125.5 compared to 116.1 on previous sessions.

PM May has already signed the Article 50 letter, which will be delivered by Tim Barrow today at 11:30 GMT. Thereafter, the European Council (EC) President Donald Tusk will hold a press conference at 13:45 GMT on the UK Article 50 notification. The UK PM May finally invoking the Article 50 means the process of the Britain to exit EU’s membership commences, after the referendum vote held in June last year showed Brits favoring a Brexit by 51.9% to 48.1%.

Once the Article 50 is triggered later today, the terms of Britain’s exit will have to be agreed by 27 national parliaments, a process which could take some years. Some EU leaders believe, it could take as long as 5 years to agree to new trading and immigration policies with the remaining countries In the meantime, the UK will continue to abide by EU treaties and laws.”

Once the Article 50 is released, the terms of Britain’s exit will have to be approved by 27 national parliaments, a process which could take some years. Some EU leaders believe, it could take as long as 5 years to agree to new trading and immigration policies with the remaining countries In the meantime, the UK will continue to abide by EU treaties and laws.”

Timeline post-Article 50 trigger (via the Sun)

MARCH 31: Donald Tusk will give the EU’s remaining 27 member states’ initial response to Mrs May.

APRIL 29: Emergency summit of the 27 EU leaders to agree on the mandate for their lead negotiator Michel Barnier to conduct exit talks.

MAY 7: French presidential elections final run-off. Many believe serious talks cannot begin until we know who the next French president is.

MID MAY: Michel Barnier draws up EU’s negotiating guidelines based on the mandate given to him. The EU’s council of foreign ministers meets to sign them off.

LATE MAY/EARLY JUNE: Face-to-face Brexit negotiations between Britain and the EU begin.

SEPT 24: German elections, to decide if Angela Merkel continues as Chancellor or is ousted. Difficult for much to be agreed on Brexit until then.

OCTOBER 2018: Both sides want to conclude negotiations six months before Britain leaves the EU to give the Houses of Commons and Lords, as well as the European Parliament and other national assemblies, time to ratify the final Brexit deal.

We could see a ‘soft’ Brexit landing if the UK agrees to compromise on issues like the free movement of people in order to maintain access to the EU single market. Contrarily, a ‘hard’ Brexit would be inevitable, in case the UK fails to reach a deal for the single market access with the EU.

Remark: Due to uncertainties evolving currently around UK with correlation of Article 50, and U.S Index sudden recovery, market to expect high volatility for GBP/USD. A break above 1.2464 projects additional bullish waves towards Monday’s range at 1.2535 & 1.2605. The opposite scenario, A penetration for 1.2337 will increase further selloffs and wash towards 1.2241 & 1.2112 intensively. UK economic data today could be ignored due to Article 50 topic being the main frame for Sterling.

For more in depth Research & Analysis please visit FxGrow.

Note: This analysis is intended to provide general information and does not constitute the provision of INVESTMENT ADVICE. Investors should, before acting on this information, consider the appropriateness of this information having regard to their personal objectives, financial situation or needs. We recommend investors obtain investment advice specific to their situation before making any financial investment decision.

FxGrow Fundamental Analysis – 29th March, 2017
By FxGrow Investment Research Desk

Oil Bullish Forces In Action Over OPEC Deal Extension, Eyes on U.S Inventories

The long waited deal between OPEC and Non-OPEC counties has finally saw the light as we mentioned in the last article we posted. Yesterday, oil levels surged +$0.94, with a high 48.73, highest levels for this week and today, crude extended bullish candles with 48.57 with expectations to surpass Wednesday’s highs. Crude levels were confined with $1.65 price action with six consolidation consecutive sessions indicating low volatility as markets were anticipating hints from either U.S increased shale drilling or from OPEC striking a newer deal, other than Vienna.

API data showed U.S. crude supplies up 1.9 million barrels. The American Petroleum Institute late Tuesday reported a rise of 1.9 million barrels in U.S. crude supplies for the week ended March 24, according to sources. The API data also showed a decline of 1.1 million barrels in gasoline supplies and a fall of 2.0 million barrels in distillates, sources said. Supply data from the Energy Information Administration will be released Wednesday morning. Analysts polled by S&P Global Platts forecast an increase of 300,000 barrels in crude inventories.

Between the U.S and OPEC, another fundamental catalyst logged the field, (Libya) an armed protesters blocked Sharara and Wafa oil western fields, reducing output by 252,000 barrels per day (bpd), a source at the National Oil Corporation (NOC) told Reuters late on Tuesday.

MOSCOW (Reuters) - Russia and Iran have pledged to continue efforts to rein in oil production and stabilize markets, the presidents of both countries said in a joint statement on Tuesday. “Russia and Iran will continue cooperation in this sphere (in oil output cuts) in order to stabilize the global energy market and ensure stable economic growth,” the statement from Russian President Vladimir Putin and Iranian counterpart Hassan Rouhani said.

According to Bank of America Merrill Lynch, U.S. oil production growth between September and December was almost entirely the result of offshore wells, which increased production by 220,000 barrels a day in that period. Offshore projects are much more long-term investments. They are far more costly to develop and take years to get started. “Those projects have an inertia,” said John Kilduff of Again Capital. Total U.S. oil production peaked at 9.6 million barrels a day in 2015 and fell to 8.56 million by September, according to Energy Information Administration data. Since then, U.S. production has jumped back, reaching 9.1 million barrels a day this month, according to the latest EIA weekly data. (CNBC).

The Organization of the Petroleum Exporting Countries (OPEC), along with some other producers including Russia, have agreed to cut production by almost 1.8 million bpd during the first half of the year in order to rein in a global fuel supply overhang and prop up prices. But as markets remain bloated halfway into the cuts, there is a broad expectation that the supply cuts will be extended into the second half of the year. Despite the rising consensus of extended cuts, the OPEC-led strategy to re-balance oil markets is not without controversy. As OPEC and especially Saudi Arabia cut their production, other producers not participating in the cuts have been quick to fill the supply gap and gain market share. (Reuters).

In the United States in particular, shale oil drillers have seized the opportunity to ramp up output and exports. As a result, China became the third biggest overseas destination for U.S. crude oil in 2016, according to data from the Energy Information Administration (EIA), up from ninth position the previous year.

“In 2016, U.S. crude oil exports averaged 520,000 bpd, 12 percent above the 2015 level, despite a year-over-year decline in domestic crude oil production,” the EIA said.

Conclusion: Currently, the U.S has the upper hand controlling oil bearish levels, but given the above fundamentals between Libyan oil field issues and OPEC and Non-OPEC deal waving on horizon, crude levels could steady back to $50>$52 pb, that’s if and only if. Otherwise, crude levels will sustain the $47>$49 pb.

Remark : Look forward for U.S Crude inventories set to be released today at 3:30 PM GMT and forecasts are 1.2M compared to 5.2M on previous sessions. The above fundamentals are the key player and markets should pay attention about what’s coming next, either from OPEC or perhaps another new fundamental other than Libyan protesters, which could tackle oil prices upward or downward.

For more in depth Research & Analysis please visit FxGrow.

Note: This analysis is intended to provide general information and does not constitute the provision of INVESTMENT ADVICE. Investors should, before acting on this information, consider the appropriateness of this information having regard to their personal objectives, financial situation or needs. We recommend investors obtain investment advice specific to their situation before making any financial investment decision.

FxGrow Fundamental Analysis – 30th March, 2017
By FxGrow Investment Research Desk

Gold Bullish Forces Decelerate By Awakening U.S Dollar, Awaiting Further Data

Gold has entered the 6th bullish consolidation session and has been jailed with 200-pips price action. The yellow metal plunged to 1248.30 low today after a long struggle with 1250 handle, and yesterday, XAUUSD couldn’t overcome the 1255 hitch which still supports the bullish trend. On Tuesday, gold peeked to 1258.47 high, keeping a tight range between Monday’s 1261.10 high, as U.S index sank to 98.65 2017 low, and markets expected gold to jet ride for higher levels giving the circumstances.

Gold bullish forces were tackled by positive U.S CB consumer confidence which sparked USD bearish levels and U.S index showed a minor recovery today with 99,89 high, postponing gold sky trip for another session as U.S releases today unemployment claims, but the main focus will be on the GDP as analysts tend to relate it directly to U.S fed policy and their in take. U.S GDP today will set the tone for next FOMC members speech with the possibility of hawkish or dovish tone regarding next interest hikes, and traders has to take U.S data today as articular as well gold levels will.

Note: Keep in mind that releasing Article 50 with the French coming election could provoke uncertainties around EU, and gold prices could rally as traders tend to turn to XAUUSD as a sacred haven metal instead of currencies.

Fundamentals:

USD - Unemployment Claims today at 1:30 PM GMT.

USD - Final GDP q/q today 1:30 at 1:30 PM GMT.

Technical:

Trend: Bullish Sideways

Resistance levels : R1 1263.71, R2 1275.94, R3 1284.24

Support levels : S1 1244.48, S2 1236.62, S3 1225.25

Remark: The market remains bullish and calls for additional attacks towards R1 although U.S index has showed vital signs. A break above R1 which is considered articular which projects intensive bullish waves towards R3 level due to previous retracements and setbacks from R1. Staying within Monday’s range keeps bullish forces in action as well as the trend. A penetration for S2 levels, signals a beginning for bearish trend and closing below S3, market to consider gold downward. U.S economic data not to be missed today in corelation with U.S Index levels which impacts gold levels directly.

For more in depth Research & Analysis please visit FxGrow.

Note: This analysis is intended to provide general information and does not constitute the provision of INVESTMENT ADVICE. Investors should, before acting on this information, consider the appropriateness of this information having regard to their personal objectives, financial situation or needs. We recommend investors obtain investment advice specific to their situation before making any financial investment decision.

FxGrow Fundamental Analysis – 30th March, 2017
By FxGrow Investment Research Desk

Copper Technical Overview

Trend : Sideways Up

Daily Pp : 266.6

Resistance levels : R1 : 269.30 , R2 270.51 , R3 273

Support levels: S1 264.45 , S2 260.90 , S3 258.60

Comment: The rebounds this week are triggering short term reversal, signaling for rallies to 273. Trade is poised to extend rallies today. Any corrective dips that show a sideways day will provide a staging level for rallies. The trend reversal point is 260.91, and a close below is needed to reverse back to negative trade.

For more in depth Research & Analysis please visit FxGrow.

Note: This analysis is intended to provide general information and does not constitute the provision of INVESTMENT ADVICE. Investors should, before acting on this information, consider the appropriateness of this information having regard to their personal objectives, financial situation or needs. We recommend investors obtain investment advice specific to their situation before making any financial investment decision.

FxGrow Fundamental Analysis – 31st March, 2017
By FxGrow Investment Research Desk

Silver Retreats Temporary As US Index Inches higher

Although silver suffered -15-pips loss yesterday over mix US Data with positive GDP 2.1% being in main focus, XAGUSD sustained the bullish trend despite recovering U.S Index peeking to 100.46 high, 9-pips below 50 SMA D1, after two weeks dwelling below 99. Negative unemployment claims with 3K narrow difference on 261K previous sessions, analysts took it as neutral despite the overall outcome. But what really energized U.S index was the GDP, paving the scenario content for next FOMC meeting next Wednesday, and market took it as a sign of possible hawkish tone where FOMC releases the statement. Markets started placing bets against odds of U.S Fed meeting, and the process of pricing the market is already in action. Currently, silver trades 18.09 after tumbling to 18.04 early this morning.

U.S Index is confined with 17-pips price action and its expected to keep that thin due to further U.S Data coming today with PCE and Personal spending in the main frame with, and the result could tackle the tone of FOMC members Dudley and Kashkari. GDP, PCE, Personal Spending, CPI, and inflation are the basis that central banks focus on whenever there is an interest rate decision.

Finally, metals drop on strong US GDP data which increases bets on Fed rate hike decision. FOMC members Dudley and Kashkari will talk today and will give clues on future monetary policy.

Note: Kashkari was the only FOMC member who waved a red card in last the U.S Fed meeting where 0.25% took action.

Fundamentals:

1- USD - Core PCE Price Index m/m today at 1:30 PM GMT.

2- USD - Personal Spending m/m today at 1:30 PM GMT.

3- USD- FOMC members Dudley and Kashkari speeches today.

Technical:

Bullish Sideways

Resistance levels : R1 18.04, R2 18.30, R3 18.55

Support levels : S1 18.04, S2 17.83, S3 17.55.

Remark : Silver still to be considered bullish although XAGUSD trading near sensitive support levels that could provoke bearish forces. Staying within 29th price actions support silver bullish forces and a break above R2 alerts for larger bullish wave towards S3 level. A break below S2 level alerts for a beginning of a trend reversal, and below S3, market to consider silver bearish.

For more in depth Research & Analysis please visit FxGrow.

Note: This analysis is intended to provide general information and does not constitute the provision of INVESTMENT ADVICE. Investors should, before acting on this information, consider the appropriateness of this information having regard to their personal objectives, financial situation or needs. We recommend investors obtain investment advice specific to their situation before making any financial investment decision.

I have made some profits in trading Silver as it came below 18.25 and now i am holding to my trades for the next week also.

The analysis that you are giving is very good and helps me in my trading. I am always waiting for the latest tech updates before plunging into the markets :slight_smile:

FxGrow Fundamental Analysis – 03rd April, 2017
By FxGrow Investment Research Desk

Aussie Slips on Negative Data Ahead of RBA Rate Decision

Australian Dollar opened Asian trading session with negative Retails Sales -0.1% compared to 0.4$ on previous sessions and plunged 49-pips at 0.7591 low. On the other hand, U.S Index shifted the downtrend and instead, a significant recovery +$1.84 since last week and the Index clocked 100.49 today, ahead of local ISM Manufacturing PMI which will either confirm the bullish trend, or the Index will hit a bump. Currently AUD/USD 0.7604, with efforts to withhold the 0.78 level as USD pressures the Aussie.

AUD/USD is trading thin today with 49-pips as price action, and it’s expected to extend narrow ahead of Australian Trade Balance, followed by RBA’s interest decision tomorrow early. Although forecasts highly bet that RBA wont wave the changing card and to leave it at current 1.5%, which leaves traders more anticipated on what will Lowe has to say on behalf of RBA preceded by local Trade balance. Analysts will try to decipher words out of Lowe with hawkish or dovish tone regarding the economic outlook and monetary policy supported by the result of trade balance.

Fundamentals:

1- USD - ISM Manufacturing PMI today at 2:00 PM GMT.

2- AUD - Trade Balance tomorrow at 1:30 AM GMT.

3- AUD - RBA Interest Rate Decision tomorrow at 4:30 AM GMT.

4- AUD- Lowe, Gov of RBA speech tomorrow at 9:15 AM GMT.

Technical Overview:

Trend: Bullish Sideways

Resistance levels: R1 0.7641, R2 0.7674, R3 0.7719, 0.7764

Support levels : S1 0.7582, S2 0.7540, S3 0.7496, S4 0.7458

Remark : Market to consider AUD/USD bullish despite early losses due to U.S Dollar bullish trend. Trade is poised with expectations of low action as market awaits vital Australian economic news tomorrow, market should kick with high volatility on Australian Trade balance and Lowe speech. A break S1 level signals a beginning of trend reversal and only a close below S2, market to consider the pair bearish.

For more in depth Research & Analysis please visit FxGrow.

Note: This analysis is intended to provide general information and does not constitute the provision of INVESTMENT ADVICE. Investors should, before acting on this information, consider the appropriateness of this information having regard to their personal objectives, financial situation or needs. We recommend investors obtain investment advice specific to their situation before making any financial investment decision.

FxGrow Fundamental Analysis – 05th April, 2017
By FxGrow Investment Research Desk

EUR/USD Steadies Ahead of local Data, Eyes on FOMC Meeting

Last week, EUR/USD witnessed an intensive decline and the pair plunged to 1.0649 on Friday after peeking to 1.0906 last Monday. This week, the pair was confined with 50-pips as price action and prolonged the third consolidation consecutive session with a weekly high at 1.0685. Although U.S Dollar has awakened with a 100.59 high yesterday, market is showing some immunity by other currency rivals due to overall political uncertainties and economies are shifting courses at a high pace, add to that, mixed data leaving markets confused and cautious trading.

According to the analysts at Danske Bank, if we are close to a peak in inflation and they are right that the pricing of hikes in the Eurozone will prove premature, EUR/USD should stay under pressure in coming months and fall back towards 1.05 as close-to-neutral positioning in the cross makes room for a revival in relative rates. Eurozone still has many obstacles to overcome before the whole image is drawn, especially the French coming elections and Frexit is already on tongues.

This week, currency majors traded narrow as analysts awaits FOMC meeting minutes today and U.S NFP this Friday which should create higher volatility despite a negative or positive outcome especially EUR/USD. Local EURO services PMI is expected to have minor volatility. The main focus will be on tonight’s FOMC meeting with eyes and ears focused on every word, trying to decipher messages, and the process of pricing the market could start all over again and FOMC members will do their best of avoid this scenario.

Fundamentals:

1- EUR - Final Services PMI today at 7:00 AM GMT.

2- USD - FOMC Meeting Minutes today at 6:00 PM GMT.

3- USD - Non-Farm Payrolls on Friday at 12:30 PM GMT.

Remark : U.S Data is heavy this week, but market poised and tied with FOMC meeting and NFP result, which leaves other data less significant.

Technical Overview:

Trend: Bearish / Sideways

Resistance levels : R1 1.0712, R2 1.0771, R3 1.0826, R4 1.0877

Support levels : S1 1.0632, S2 1.0589, S3 1.0532, S4 1.0478

Summary: Overall, the pair remains under pressure by strong U.S Index and market to consider EUR/USD bearish. But economic data this week will determine the trend further more. A penetration for S1 level will increase further selloffs and wash towards S2. A break below S2 level warns for additional intensive declines towards S3&S4. Any close below 1.07 is negative. Rallies that stay capped by 1.0800 should maintain bear forces. Closing above R3 level, traders to take it as sign for shifting trend course and above R4, uptrend is 100% confirmed. Be careful from setbacks as a first test on S&R levels due to high volatility.

For more in depth Research & Analysis please visit FxGrow.

Note: This analysis is intended to provide general information and does not constitute the provision of INVESTMENT ADVICE. Investors should, before acting on this information, consider the appropriateness of this information having regard to their personal objectives, financial situation or needs. We recommend investors obtain investment advice specific to their situation before making any financial investment decision.

FxGrow Fundamental Analysis – 05th April, 2017
By FxGrow Investment Research Desk

Crude Oil Surges Over Fears Of Supply Tightening, Eyes on U.S Inventories

Fundamentals:

Crude oil level rallied yesterday +$1.41, and added +$0.14 today clocking a high 51.47, with expectation of additional gains, ahead of U.S Crude Inventories today. Oil bullish forces accelerated yesterday over signs of a gradual tightening in global oil inventories and on concerns about a supply outage at a field in the United Kingdom’s North Sea that feeds into an international benchmark price.

Another contributor (Iraq), entered the field on Sunday pledging to a full compliance with oil cut deal as OPEC chief hinted. Iraq has assured OPEC that it will fully comply with an agreement to cut oil supply in order to curb crude prices and the deal as a whole is encouraging, OPEC Secretary General Mohammed Barkindo said on Sunday in Baghdad. Iraq’s compliance stands now at 98 percent, the nation’s oil minister Jabar al-Luaibi told reporters, after addressing a conference in the Iraqi capital, also attended by Barkindo. General compliance with supply cuts by the oil producers was 86 percent in January and 94 percent in February and the market is already balancing, he added.

On the other hand, the OPEC amd Non-OPEC deal for additional six months extension is cooked on a low steam and under the table which leaked optimism to the market as traders are anticipating it. Such deal, if struck, could accelerate rising price pace of crude oil despite U.S increased Shale drilling.

Conclusion: Currently OPEC with above fundamentals have the upper hand, and markets should expect oil prices to climb back to Feb 2017 average $53 bp.

Note: Look forward for U.S crude inventories today at 2:30 PM GMT which will give new perspectives for oil levels depending on the outcome.

Technical Overview:

Resistance levels: R1 51.65, R2 52.60, R3 53.52

Support levels : S1 50.86, S2 49.60, S3 48.41

Comment: The market has turned short-term bullish and calls for a larger bull wave up around R2&R3 levels. Stable action above 51.0 sustains bullish forces and boosts additional hikes. A slip below S1 cautions for near term correction, but only a close below S2 alerts for a trend reversal action and below S3, down-trend is confirmed. R1 level is sensitive as a psychological reminder of 2017 early rallies.

For more in depth Research & Analysis please visit FxGrow.

Note: This analysis is intended to provide general information and does not constitute the provision of INVESTMENT ADVICE. Investors should, before acting on this information, consider the appropriateness of this information having regard to their personal objectives, financial situation or needs. We recommend investors obtain investment advice specific to their situation before making any financial investment decision.

FxGrow Fundamental Analysis – 06th April, 2017
By FxGrow Investment Research Desk

Silver Technical Overview Ahead of U.S Data

Silver technical overview

Trend : Bullish

Resistance levels: R1 18.40 , R2 18.50, R3 18.73

Support levels: S1 18.19, S2 18.03, S3 17.74

Comment : The market is staying bullish with yesterday’s bounce calling for another push higher. However, trade is pressed up against the previous downturn levels at R1&R2. A close over 18.55 is needed for a larger bull drive to R3 level. Be careful for a stall a stall against R1 and possible back off into flagging congestion. A slip through S2 level cautions for near term selling. A close under S3 is a signal for short term reversing turnover. Keep an eye on U.S Data today and tomorrow which will impact silver levels instantly. Be careful from setbacks as a first test on S&R due to high volatility. Only long positions above or below S&R is a confirmation for levels failure.

For more in depth Research & Analysis please visit FxGrow.

Note: This analysis is intended to provide general information and does not constitute the provision of INVESTMENT ADVICE. Investors should, before acting on this information, consider the appropriateness of this information having regard to their personal objectives, financial situation or needs. We recommend investors obtain investment advice specific to their situation before making any financial investment decision.

FxGrow Fundamental Analysis – 06th April, 2017
By FxGrow Investment Research Desk

Gold Bull Forces Remain Under Pressure, U.S Data Will Decide

Gold has postponed breaking the 1260 level for the third consecutive session and for the 8th time in 2017, XAUUSD has built a higher wall being impossible to penetrate. Yesterday, the yellow metal plunged to 1243.75 dramatically over ADP Non-Farm Employment Change with an upbeat 263K while forecasts were 184K. Markets awaited FOMC meeting yesterday with expectations about a precise or clear figure about coming hikes with date, but details were left unspoken, as a result, market reacted negatively and U.S Index shed -$0.69 after peeking to 100.95 earlier. Currently gold trades 1245.30 intraday, with agitated volatility.

The same scenario has been repeated where gold reaches the climax of 1259, then fades aggressively as if the market is on an autopilot mood or Déjà vu. Today and tomorrow, U.S Data will decide once and for all, gold’s destination. A break above 1261 will fuel gold bullish candles with fury, whilst, a failure to break above, market could witness pressured selling and gold will plunge below 1245 as a reminder of recent scenarios.

On the other hand, other keys could provoke gold inclines including Trump’s political continuous tension with China and doubts about his leadership, North Korea declarations of launching nuclear missile as a test arousing uncertainties, French coming elections with Frexist as what happened on Brexit, markets might head to gold a safe haven substitute when doubts creap into the market.

Fundamentals:

1- USD - Unemployment Claims today at 12:30 PM GMT.

2- USD - Non-Farm Payrolls NFP tomorrow at 12:30 PM GMT.

Technical Overview:

Trend : Bullish Sideways

Resistance levels: R1 1260.05, R2 1267.40, R3 1280.30

Support levels: S1 1249.80, S2 1242.26, S3 1236.75

Comment: Gold levels will be determined depending on U.S Data outcome. As for technical, staying above 1250 rekindles bull forces. A break above R1 with long positions should fuel larger bull hikes towards R2&R3 level. Yesterday’s spike rebound has trade positioned for rallies as a restore of confidence. Any penetration for S1 level holds congestion with a reminder of aggressive selloffs towards S2 level. Closing below S2 is a signal for trend reversal and market to consider gold bearish. Expectations of high volatility during economic data release and traders to be careful from setbacks as recent behavior when gold tests support and resistance levels.

For more in depth Research & Analysis please visit FxGrow.

Note: This analysis is intended to provide general information and does not constitute the provision of INVESTMENT ADVICE. Investors should, before acting on this information, consider the appropriateness of this information having regard to their personal objectives, financial situation or needs. We recommend investors obtain investment advice specific to their situation before making any financial investment decision.