The Currency Score analysis is one of the parameters used for the Ranking and Rating list which was published earlier. It is recommended to read the page Currency score explained and Models in practice for a better understanding of the article. This article will provide my analysis on the 8 major currencies based on the technical analysis charts using the MACD and Ichimoku indicator on 3 time frames, the monthly, weekly and daily. The result of the technical analysis are the 2 screenshots in this article showing the Currency Score and the Currency Score Difference.
Last 12 months currency classification
The last 12 months currency classification from a longer term perspective are provided for reference purposes. There are some changes and the new classification is provided here with the necessary charts which can be found at the bottom of this article. The currencies are classified for the coming months as follows:
[ul]
[li]Strong: CHF / GBP / USD. The preferred range is from 6 to 8.[/li][li]Average: .EUR / JPY. The preferred range is from 4 to 5.[/li][li]Weak: AUD / CAD / NZD. The preferred range is from 1 to 3.[/li][/ul]
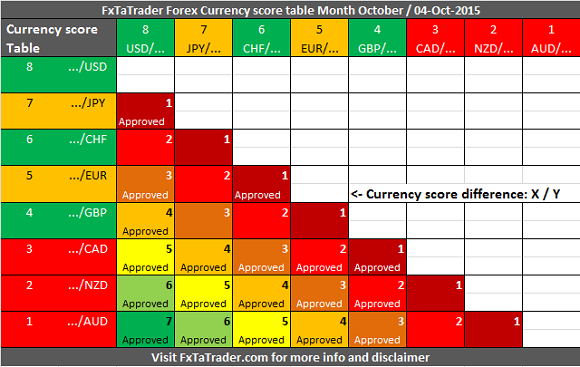
Currency Score for October 2015
For analyzing the best pairs to trade this classification is the first issue. When looking at the most recent score that is used for the coming period we can see in the screenshot below the following deviations:
[ul]
[li]The GBP has a score of 4. This is a strong currency and it should have by preference a score from 6 to 8. It has a score at the moment of an average currency.[/li][li]The JPY has a score of 7. This is an average currency and it should have by preference a score from 4 to 5. It has a score at the moment of a strong currency.[/li][/ul]
The conclusion is:
[ul]
[li]Most of the currencies are at the right level when looking at the last 12 months currency classification except for the GBP and the JPY.[/li][li]There is most probably a pullback for the GBP when looking at the market as a whole. The uptrend has lost momentum.[/li][li]There is an increase of momentum for the JPY which is getting stronger.[/li][li]The pairs that we may look at are all most probably trending except for the pairs with the JPY which are most probably ranging. Some pairs may be in a trend and having momentum. These can be interesting, check the Ranking and Rating list published this weekend for more information.[/li][li]The GBP may offer a good opportunity to step in. However, it is important to determine if the specific pair is indeed having a pullback. For that reason it is good to see the momentum returning in that pair.[/li][/ul]

Currency Score difference for October 2015
According to the Ranking and Rating list already published this month the following pair combinations look interesting:
[ul]
[li]AUD/JPY with the NZD/USD[/li][li]AUD/USD with the EUR/NZD[/li][li]NZD/USD with the EUR/AUD[/li][li]NZD/JPY with the AUD/USD[/li][/ul]
When looking at the Currency Score Table here below for this month we can see the currency score differences. The interesting pairs should have by preference a score difference of 4 or higher when they are similarly classified. Or the better classified pair should have a higher score than the counterpart. All the pairs mentioned above comply for trading in the coming month. The Currencies are colored Green, Orange and Red resp. by the classification they have. This way it is easier to see what currencies should have a certain score difference.
The technical analysis is the most important issue to consider before taking positions. The Weekly Chart is analyzed. I prefer the Bollinger Band for defining where a pair is in the chart. Once a pair is outside a Bollinger Band it is in a strong trend which can cause a strong pullback. Although this may be a good opportunity for other analysts I avoid taking positions because of the possible unexpected strong pullback. Positions are only opened inside the Bollinger Band and this may be at the start of a possible trend or on a good pullback in an existing trend.
[ul]
[li]The AUD/JPY is in a downtrend and at the Bollinger Band.[/li][li]The NZD/USD is in a downtrend and within the Bollinger Band.[/li][li]The AUD/USD is in a downtrend and within the Bollinger Band.[/li][li]The EUR/NZD is in an uptrend but within the Ichimoku cloud and with prices falling in the last months. Other pairs look more interesting.[/li][li]The NZD/USD is in a downtrend and within the Bollinger Band.[/li][li]The EUR/AUD is in an uptrend and at the Bollinger Band.[/li][li]The NZD/JPY is in a downtrend and within the Bollinger Band.[/li][/ul]
Last 12 months currency classification charts for October 2015
Here below are the charts providing the Currency classifications for reference purposes. There are three charts showing resp. the stronger, average and weaker currencies.


When trading according to the FxTaTrader Strategy some rules are in place. For more information see the page on my blog FxTaTrader Strategy. Depending on the opportunities that may come up the decision to trade a currency may become more obvious at that moment. If you would like to use this article then mention the source by providing the URL [FxTaTrader.com](file:///C:/Users/portiz/Dropbox/TIS/Dropbox/Forex/_SocialMedia/Blog/2015/W05/FxTaTrader.com) or the direct link to this article. Good luck in the coming month.
DISCLAIMER: The articles are my personal opinion, not recommendations, FX trading is risky and not suitable for everyone.The content is for educational purposes only and is aimed solely for the use by ‘experienced’ traders in the FOREX market as the contents are intended to be understood by professional users who are fully aware of the inherent risks in forex trading. The content is for ‘Forex Trading Journal’ purpose only. Nothing should be construed as recommendation to purchase any financial instruments. The choice and risk is always yours. Thank you.