I can’t see a favorable opening for a deal right now. Therefore, I’ll wait to see which of the variants is the right one.

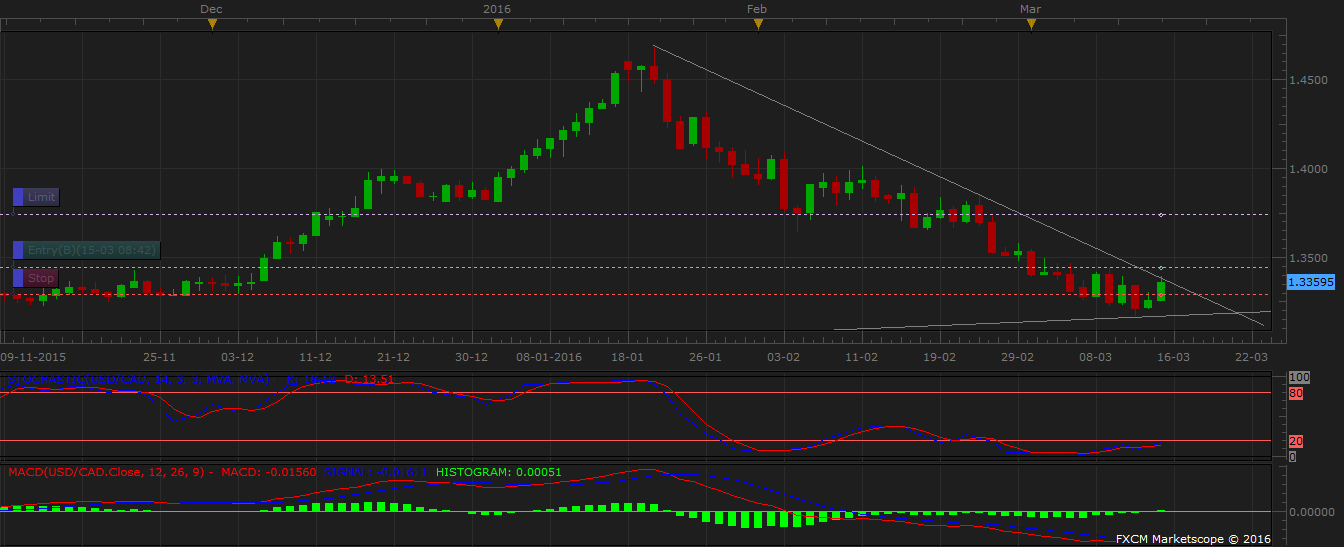


Right now, I can’t see the entrance for opening a deal on the asset, so I’ll wait until the price reaches one of the levels, and then I’ll make a decision.

[QUOTE=“Wonel;770994”]Right now, I can’t see the entrance for opening a deal on the asset, so I’ll wait until the price reaches one of the levels, and then I’ll make a decision. <img src=“301 Moved Permanently”/>[/QUOTE]
Thats audusd not usdcad

The asset is flat now. I’ll set pending orders nearby the upper bound and bottom line and will see which one is gonna work.

The price will soon reach the level, where it will be possible to plan the exit point from the deal. I hope the price won’t go another way; it happens sometimes.

I also think the USDCAD will be falling after the monthly OPEC report. But i will watching out for the crude oil report.
I also think the CADJPY will go up and rise like a sun:
I see i break out

And the EURCAD will fall like a rock:
I see i break out

I hope i am write. If not: it is a learning moment.

The price went not as I expected, but nothing bad happened because the stop order had been triggered. This transaction didn’t harm me much.

I can see an excellent entrance to the USD/CAD market after passing the 1.3115 level. The price will go up.

I’m having a bid order on USD/CAD until the price reaches the level of resistance at 1.3228. After that, I’m starting to buy.

Well, the asset moves as I’ve predicted. I think that I can earn even more on USD/CAD! Definitely, the show must go on =)

USDCAD Elliott Wave View: Ending 5 wave Impulse
Short term Elliott wave view in USDCAD suggest that the cycle from 4/13 low (1.3218) is unfolding as an impulsive Elliott wave structure . This 5 wave move could be wave ((a )) of an Elliott wave zigzag structure structure or wave ((c )) of FLAT correction. In either case, after 5 wave move ends, pair should pull back in 3 waves at least as the Elliott Wave Theory suggests. Minutte wave (i) ended at 1.3337 peak, Minutte wave (ii) ended at 1.3261, Minutte wave (iii) ended at 1.3498, Minutte wave (iv) pullback ended at 1.3455 low and above from there Minutte wave (v) of ((a)) already reached the minimum extension area between 1.3509-1.3527 which is the inverse 1.236-1.618% Fibonacci extension area of proposed wave (iv) dip. This means cycle is now mature and can end at any moment resulting in a 3 wave pull back at minimum. The pull back is shown to be wave ((b)) and should correct the cycle from 4/13 low in 3, 7 or 11 swings. If the decline turns out to be stronger than expected and breaks the pivot at 1.3218 low, that would suggest 5 wave move up from 1.3218 low was a B wave FLAT from 3/21 (1.3261) low and pair could then see 1.3252 – 1.3187 area before bouncing again. Although Minutte wave (v) of ((a)) has reached the minimum extension area, another high towards (v) = (i) target @ 1.3571 can’t be ruled out to end wave ((a)) cycle from 4/13 low. In either case, cycle from 4/13 (1.3218) low is mature and should result in a pull back soon.
USDCAD 1 Hour Elliott Wave Chart 04/21/2017

USDCAD Elliott Wave View: Ending an impulse
Short term Elliott Wave view in USDCAD suggest the decline to 1.322 ended Intermediate wave (X). Up from there, the pair is showing 5 waves impulse structure where Minutte wave (i) ended at 1.3338, Minutte wave (ii) ended at 1.3258, Minutte wave (iii) ended at 1.3525, and Minutte wave (iv) ended at 1.3406. Near term focus is on 1.3596 – 1.364 area to complete Minutte wave (v) and also Minute wave ((a)). The next push higher towards above target should end the cycle from 4/13 low, after which the pair should pullback in Minute wave ((b)) in 3, 7, or 11 swing to correct cycle from 4/13 low before turning higher again. We don’t like selling the proposed pullback and expect buyers to appear again once Minute wave ((b)) pullback is complete in 3, 7, or 11 swing provided that pivot at 1.322 low remains intact.
USDCAD 1 hour Elliott Wave Chart 04/25/2017

USDCAD Elliott Wave View: More Upside
Short term Elliott Wave view in USDCAD suggest the decline to 1.322 ended Intermediate wave (X). Revised view suggests that the rally from there is unfolding as a double three Elliott Wave structure where Minute wave ((w)) ended at 1.3525 and Minute wave ((x)) ended at 1.3406. Minute wave ((w)) is subdivided as a Flat Elliott wave structure where Minutte wave (a) ended at 1.3338 and Minutte wave (b) ended at 1.3258. Near term, pair is within Minutte wave (x) pullback to correct the cycle from 4/24 low in 3, 7, or 11 swing before the rally resumes. We don’t like selling the proposed pullback and expect buyers to appear once wave (x) pullback is complete in 3, 7, or 11 swing as far as pivot at 1.3406 stays intact.
USDCAD 1 hour Elliott Wave Chart 04/26/2017

USDCAD Elliott Wave View: Flat correction
Short term Elliott Wave view in USDCAD suggest the decline to 1.322 ended Intermediate wave (X). The rally from there is unfolding as a double three Elliott Wave structure where Minute wave ((w)) ended at 1.3525 and Minute wave ((x)) ended at 1.3406. Minute wave ((w)) is subdivided as a Flat Elliott wave structure where Minutte wave (a) ended at 1.3338 and Minutte wave (b) ended at 1.3258. Near term, pair is within Minutte wave (x) Flat pullback to correct the cycle from 4/24 low towards 1.346 – 1.3498 area before the rally resumes. We don’t like selling the proposed pullback and expect buyers to appear once wave (x) pullback is complete in 3, 7, or 11 swing as far as pivot at 1.3406 stays intact.
USDCAD 1 hour Elliott Wave Chart 04/27/2017
