WEEKLY USD/CHF TECHNICAL OUTLOOK
Last Update At 30 Mar 2014 23:21GMT
Trend Daily Chart
Sideways
Daily Indicators
Turning up
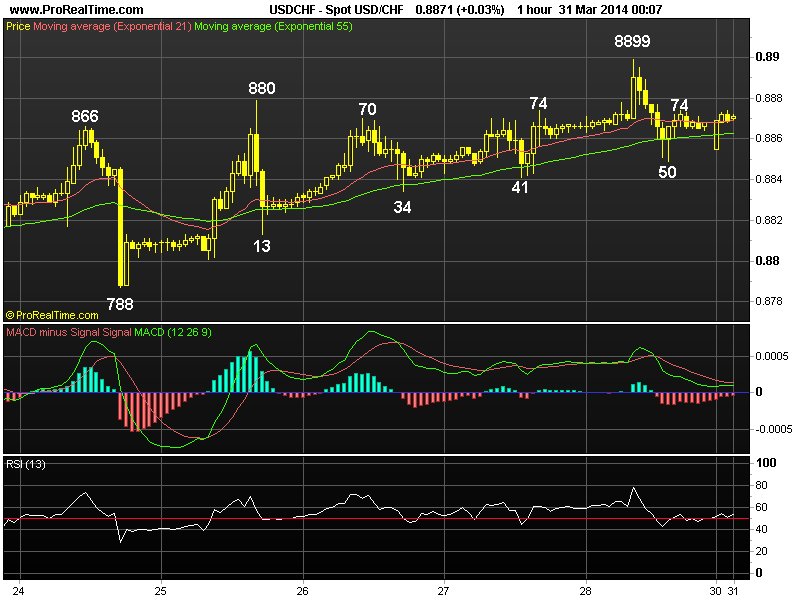
21 HR EMA
0.8869
55 HR EMA
0.8863
Trend Hourly Chart
Sideways
Hourly Indicators
Turning down
13 HR RSI
59
14 HR DMI
-ve
Daily Analysis
Consolidation with a neutral bias
Resistance
0.8981 - 61.8% r of 0.9156-0.8698
0.8930 - Feb 26 high
0.8899 - Last Fri’s high
Support
0.8834 - last Wed’s low
0.8813 - Last Tue’s NY low
0.8788 - Last Mon’s low
. USD/CHF - 0.8873…The greenback swung wildly in opposite direction to
eur/usd last week. Despite initial brief but sharp retreat to 0.8788on Mon,
renewed weakness in eur/usd helped price ratchet higher to a 4-week high of 0.8899
on Fri b4 coming off to 0.8850 in NY due to selling in eur/chf cross.
. Looking at the bigger picture, dlr’s erratic rise fm Mar’s near 2-1/2
year trough at 0.8698 to as high as 0.8899 Fri signals MT downtrend fm 2012 peak
at 0.9972 (Jul) has formed a temporary low there n as daily technical indicators
are turning up, suggesting consolidation with upside bias remains for further
gain to next daily chart obj. at 0.8930, then 0.8981, this is the ‘dynamic’
61.8% r of intermediate fall fm 0.9156 to 0.8698, however, abv there is needed
to retain bullish prospect of further headway twd next chart res at 0.9082 in
Apr/May. Having said that, as Fri’s high was accompanied by prominent ‘bearish
divergences’ on the hourly oscillators’ readings, suggesting initial consolida-
tion is in store this week b4 prospect of further gain to indicated targets.
. Today, expect sideways trading below 0.8899 with downside bias, as long
as 0.8813 sup holds, bullishness remains n only below 0.8788 risks 0.8737/42.