DAILY USD/JPY TECHNICAL OUTLOOK
Last Update At 27 Mar 2014 00:39GMT
Trend Daily Chart
Sideways
Daily Indicators
Turning down
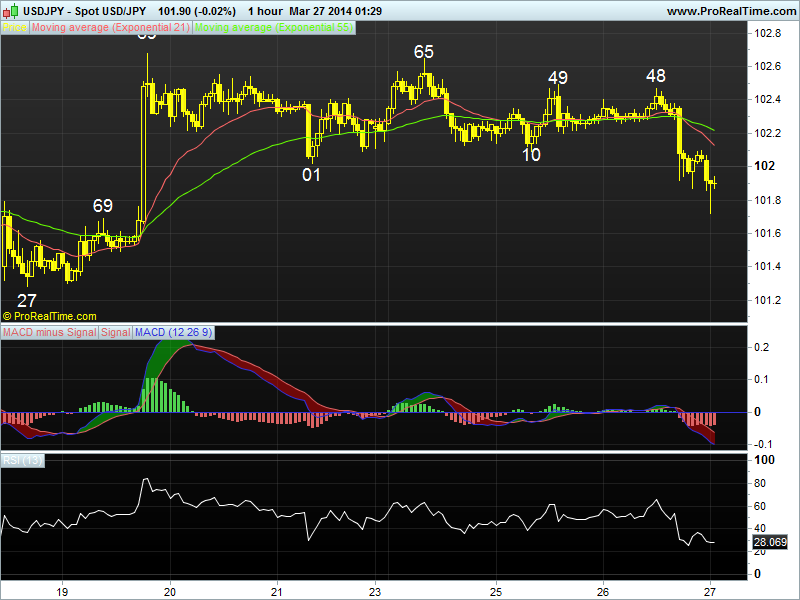
21 HR EMA
102.14
55 HR EMA
102.22
Trend Hourly Chart
Sideways
Hourly Indicators
O/sold
13 HR RSI
25
14 HR DMI
-ve
Daily Analysis
Consolidation with downside bias
Resistance
103.10 - Mar 12 high
102.69 - Last Wed’s high
102.49 - Tue’s high
Support
101.69 - Last Wed’s European morning high
101.21 - Mar 14 low
100.76 - Feb 4 low
. USD/JPY - 101.83… Although dlr edged higher fm Asian low at 102.26 on
Wed n briefly rose to 102.48 in NY morning after robust U.S. durable goods data,
active cross buying in yen on risk aversion due to fall in U.S. equity markets
knocked price lower to 101.87 in late NY n then to 101.80 at Asian open today.
. Looking at the hourly n daily charts, y’day’s retreat fm after meeting
renewed selling at 102.48 n then breach of 102.01 (last Fri’s low) strongly
suggests the rise fm 101.21 (Mar 14 low) has ended at 102.69 (last Wed’s peak
after hawkish comments fm Fed’s chief Yellen) n as hourly oscillators are
currently falling, suggesting choppy trading with downside bias remains for
weakness to 101.49, being the 80.9% r of 101.21-102.69, firm break there wud
confirm this view n yield resumption of early fall fm Mar’s peak at 103.77 to
re-test said sup n then twd Feb’s bottom at 100.76 next week.
. In view of abv analysis, selling dlr on recovery is favored n only a daily
close abv 102.65/69 wud ‘prolong’ choppy trading inside recent broad range
of 100.76-103.77 n bring further gain twd 103.10 (Mar 10 high) but price shud
falter well below said res n yield retreat.