DAILY USD/JPY TECHNICAL OUTLOOK
Last Update At 11 Aug 2014 23:48GMT
Trend Daily Chart
Sideways
Daily Indicators
Turning down
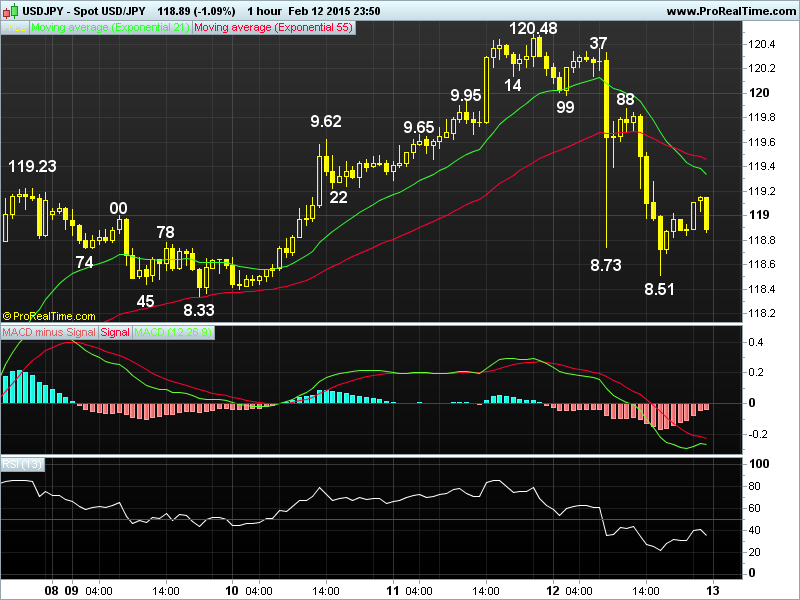
21 HR EMA
102.15
55 HR EMA
102.12
Trend Hourly Chart
Near term up
Hourly Indicators
Rising
13 HR RSI
62
14 HR DMI
+ve
Daily Analysis
Marginal rise b4 retreat
Resistance
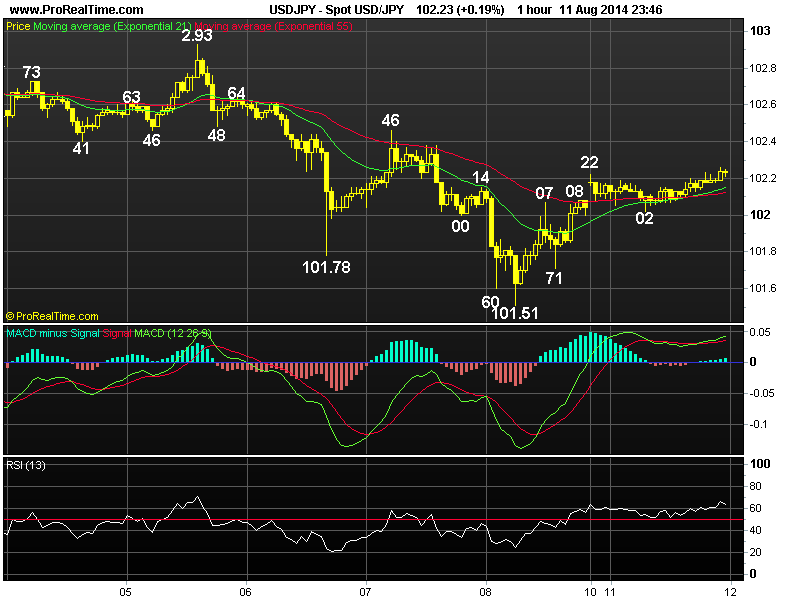
102.93 - Last Tue’s high
102.46 - Last Thur’s high
102.34 - Aug 01 low
Support
101.78 Last Wed’s low
101.51 - Last Fri’s low
101.32 - Jul 23 low
. USD/JPY - 102.23 … Despite dlr’s gap-up opening to 102.22 in New Zealand on Monday following last Fri’s rally fm a 2-week low of 101.51, the pair then traded narrowly below there in Asia n retreated briefly to 102.02 in European morning b4 edging high in New York, price climbed to 102.26 in Australia.
. Looking at the bigger picture, despite the 3-legged rise fm May’s 100.81 trough to 103.15 twd end of July, subsequent cross-inspired selloff to 101.51 signals aforesaid upmove has indeed made a top there. As mentioned in previous updates, dlr’s MT choppy sideways move inside the established broad 105.45-100.76 range is expected to continue n the decline fm 103.15 adds credence to this view n as long as 102.46 res (last Thur’s high) holds, consolidation with initial downside bias wud be seen n below 101.51 wud bring another drop twd 101.26 (being 80.9% r of 100.81-103.15), however, only a firm breach of 100.76/81 sup area wud bring stronger correction of the LT uptrend fm 79.75-105.45 (however, this is not an anticipated scenario).
. Today, in view of abv analysis, selling dlr on intra-day rise in anticipation of a subsequent fall is favoured. Abv 102.46 wud defer n risk 102.93 res.