Nice… I see you have started trading with this technique. I am with you on this. I will also start posting Patterns I find and trade. I am still trying to refining my entry setups though.
Are you using a indicator or drawing the patterns? Feel free to post any patterns you may find here. It would be great to get harmonic community going here at babypips again.
Currently using Korharmonics together with supdem…
Reading [I]Trade What you See[/I] as we speak. It’s all super interesting and I look forward to adding something to this thread.
ok so I created this gartley patter on the USD / JPY timeframe using FXCM, but now I can’t take a screen shot or upload the
image. soooo frustrating.
Ok. I was able to attach the image of my hard work. Put together what I think is a Gartley 222. Would love to get some feedback.
Which currency pair is it?
I dont think that is a Gartley… what is the the XA fib retracement to C?
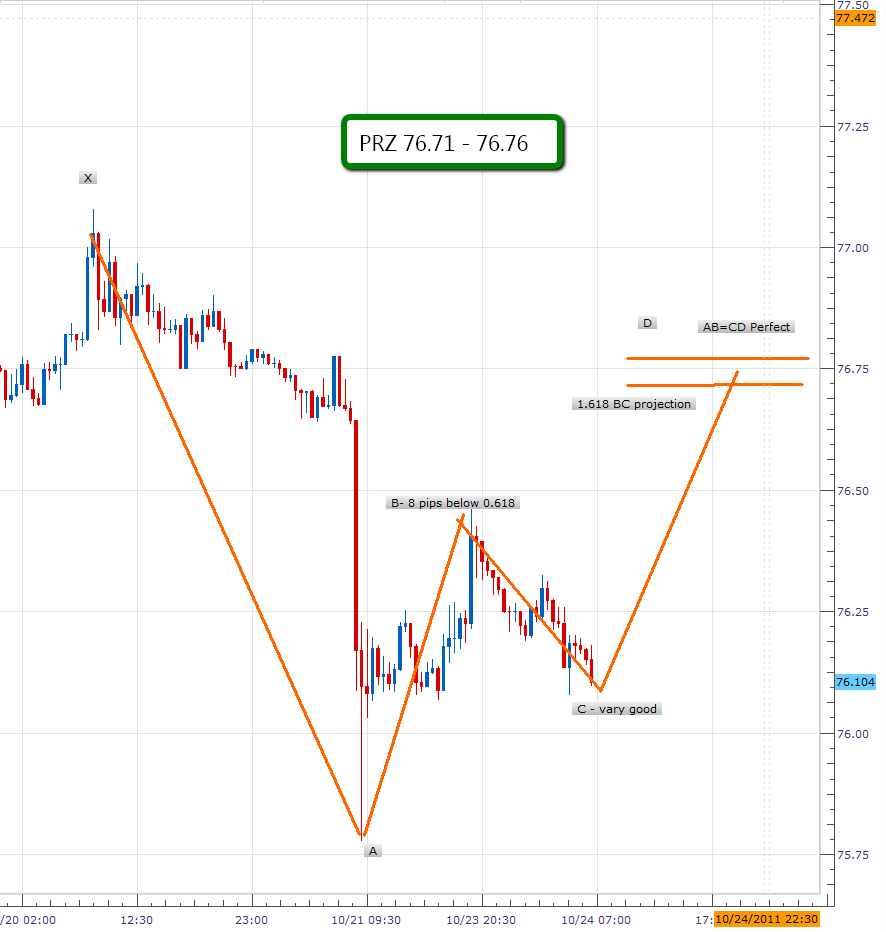
Awesome gartely almost textbook perfect. Accept your D point is at 0.618 of XA it should be 0.786. Are you trading from C to D? AB=CD completion at previous resistance. Tight price reversal zone to see image below.

Edit:
Added wrong image lol. :57:
The chart is a 30 minute USD/JPY. I don’t have the exact retracement levels at the moment - at work and I can’t remember what levels the legs hit. Look to sell the pair at D once it hits my level. This is the first time I am trading this pair and I feel like it may take some time to hit my level, if at all. Correct me if I am wrong, but I could swear I read that if the retracement of the AB leg is to the .382 level, then it could take a longer time for the CD leg to reach target. I am only trading a demo account right now; working two jobs really cuts into learning/trading time, but my goal is to find one pattern a day and become more thorough and detailed with my explanatation / diagrams. Sorry for the confusion liftoff.
checking out the rates right now and it looks like the pair is going in the opposite direction of my target D. gotta get reading TMbag’s posts and figure out what happened.
I’ve redrawn the pattern have a look. 0.786 is just a tad below the upper prz line.
ok, I see what you did now. I feel like I may have been forcing the pattern based on the price action available to me at the time. Thanks, 10pips.
Glad to help any time. With the price action at that time I probably would have done that same thing.
I am having the hardest time finding patterns right now. Argh!
10pips, I was able to find what I believe to be bullish butterfly on the m30 EUR/GBP. For whatever reason (and Im sure there was a reason) I was having the hardest time finding patterns today. I did manage to find this pattern. Question, on the BC leg, do you use the .886 retracement level? And is it a requirement for the BC leg to land exactly ( +/- 5 pips) on a fib retrace level. My hangup seems to be finding BC legs that land on a fib retrace level.
Sometimes patterns just are not there try not to force them. BC fib ratio’s for most patterns can retrace from 0.382 to 0.886 with C being the most extreme price point from C to D. Refer to the list of ideal or perfect pattern fib ratio’s listed on page one. The C point above should be on the next high above the one on the chart. It doesn’t have to be perfect either fib ratio’s can be off from 10-15 pips of course the closer the better imho. Try using the fractal indicator (pin points highs and lows) if marketscope has one it may help you see the patterns better.
Hi guys.
I’ve just started trading with harmonics too. Also using Korharmonics as it has better option than Zup or Bps.
Reading Scott Carney Harmonic Trading vol 1 & 2 helps also.
At the moment I’m focusing on 1Hr/4Hr/Daily setups as I find them more reliable, and I am time poor.
Looking forward to collaborating here.
Good to see we are bringing more people on board. 
Hey, Dave. I’m in your position too, lack of time is killing me. Have you read [I]Trade What you See Yet[/I]??? If so, how do they compare??

