Looking over the gold chart now I drew a trend channel zoomed right out on the daily and it’s still well within it. I’m wondering if 1200 will hold as support and we’ll see a good buying area or if it will crash a bit more.
There has been MACD divergence on the daily chart for a while now…
dont worry about it. Not all trades are going to work. Thats where your improvement of mental trading strength comes in.
Look at like this, you have an edge in the market. Some trades will win, some will lose. You can never know which trades will be the winners. It’s youre job as a trader to just consistently keep placing your trades with discipline and let youre edge play out over time.
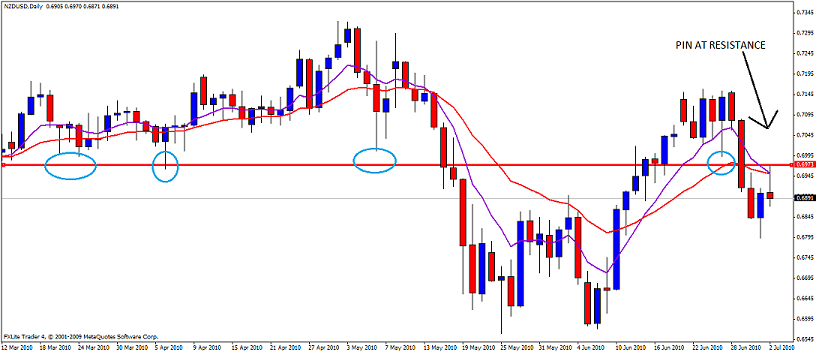
On another not, check out NZDUSD. I’m short.
Oh and hope you traded eurusd NFP fri as had some nice 4hr PA rolling into it which turned out nicely.
ddinnov, just wanted to point out something, maybe it will help.
On your gold chart, you show a divergence.
While yes, there IS a divergence, you drew the lines off the highs of the MACD, and the lows of the chart.
The lines should be drawn on the same sides on both.
In this case, the chart is making higher highs, but the MACD is making lower highs, therefore the divergence.
You are looking for divergences between the corresponding sides of the indicator, and the chart.
If that doesn’t make sense, let me know, I’ll post up some samples:)
Had some really nice trades this week, didn’t post them up here but discussed them over at the other place.
AUD/USD - long - T/P hit
EUR/AUD - short - T/P hit
USD/CAD - short - T/P hit
EUR/USD - long - 1/3 profit taken at 1.2700 and rest stopped out at B/E
Cotton - short - stopped out at B/E.
Made back all the (2%) loss from the NZD/USD trade and about 2% more on top.
Took longs in gold and crude (WTI) on my experiment account as well.
I didn’t post up any trades here this week but discussed them all over at the J16 thread. The only charts I posted up were for EUR/AUD.
Bearish outside bar at a swing high with lots of space coming off a very big round number - 1.5000. Also it looked liek a retracement move on a strong down trend. This to me is an A+ setup. When it broke it moved fast and hit the T/P in a few hours. Looking back I wish I’d stayed in with a position split into 2/3 parts but maybe next time eh…
This to me is a good general attitude to always keep close when trading. Simple money management and analysis of zones where price is likely to meet support and resistance. It need not be more complicated than that.
Quite odd to find someone with so similar strategy so fast, however i do not hesitate using indicators. Trend lines, Support/Resistance, & Stochastic - all I need